Review
. 2020 Dec 15:170:112674.
doi: 10.1016/j.bios.2020.112674. Epub 2020 Oct 2.

Developments in integrating nucleic acid isothermal amplification and detection systems for point-of-care diagnostics

Affiliations
Review

Developments in integrating nucleic acid isothermal amplification and detection systems for point-of-care diagnostics

Elizabeth A Pumford et al. Biosens Bioelectron. .

Abstract

Early disease detection through point-of-care (POC) testing is vital for quickly treating patients and preventing the spread of harmful pathogens. Disease diagnosis is generally accomplished using quantitative polymerase chain reaction (qPCR) to amplify nucleic acids in patient samples, permitting detection even at low target concentrations. However, qPCR requires expensive equipment, trained personnel, and significant time. These resources are not available in POC settings, driving researchers to instead utilize isothermal amplification, conducted at a single temperature, as an alternative. Common isothermal amplification methods include loop-mediated isothermal amplification, recombinase polymerase amplification, rolling circle amplification, nucleic acid sequence-based amplification, and helicase-dependent amplification. There has been a growing interest in combining such amplification methods with POC detection methods to enable the development of diagnostic tests that are well suited for resource-limited settings as well as developed countries performing mass screenings. Exciting developments have been made in the integration of these two research areas due to the significant impact that such approaches can have on healthcare. This review will primarily focus on advances made by North American research groups between 2015 and June 2020, and will emphasize integrated approaches that reduce user steps, reliance on expensive equipment, and the system's time-to-result.

Keywords: Isothermal amplification; LAMP; Nucleic acids; Point-of-care detection; RPA; Review.


Conflict of interest statement

The authors declare that they have no known competing financial interests or personal relationships that could have appeared to influence the work reported in this paper.

Figures

Fig. 1
Fig. 1
Steps in the LAMP mechanism. (I) Initiation of LAMP results in the generation of a dumbbell structure. (II) Stem-loop structures are generated in the cyclic stage of LAMP. (III) Stem loop structures are elongated; amplification occurs exponentially (Notomi et al., 2000) (CC BY 4.0 license: https://creativecommons.org/licenses/by/4.0/).
Fig. 2
Fig. 2
Structure of microRAAD. A) Workflow for HIV detection: (1) The user assembles the device in the plastic housing. (2) Wash buffer and sample are deposited into inlets and sealed with tape. (3) Heating is initiated by powering with a cellular phone. (4) Temperature was maintained at 65 °C for 90 min (5) Results were analyzed on LFA. B) The assembled device connected to phone power. Reprinted with permission from Phillips et al. (2019) - Published by The Royal Society of Chemistry.
Fig. 3
Fig. 3
RPA reaction mechanism. The reaction is initiated by the binding of the T4 UvsX recombinase (yellow) to the primers with the help of the T4 UvsY loading factor (orange). The recombinase-primer complexes scan dsDNA for homologous sequences, and they invade these sequences with the strand-displacement activity of the recombinase. Single stranded binding proteins (purple) stabilize the displaced strand and the recombinase dissociates, leaving a 3′ group available for extension. Strand displacing DNA polymerase (green) binds the 3′ end of the primers and extension begins, eventually resulting in two DNA duplexes. (For interpretation of the references to color in this figure legend, the reader is referred to the Web version of this article.)
Fig. 4
Fig. 4
Colorimetric detection using a TMB-HRP system. The target nucleic acid sequence is amplified with RPA using biotinylated deoxyuridine triphosphates (dUTPs). Streptavidin-HRP and streptavidin-magnetic beads bind to the biotinylated amplicons which are then magnetically isolated and purified. In the presence of TMB, a color change occurs allowing for the naked eye detection of positive samples. Reprinted with permission from (Islam et al., 2018). Copyright 2018 Royal Society of Chemistry. (For interpretation of the references to color in this figure legend, the reader is referred to the Web version of this article.)
Fig. 5
Fig. 5
Modified probes for RPA detection. A) The nfo probe is composed of a 5′ label, an internal abasic site such as tetrahydrofuran (THF), and a 3′ block. The probe is exchanged at the cognate site using recombinase proteins and the abasic site is cleaved by an endonuclease (yellow). The probe is converted to a primer and DNA polymerase (purple) begins extension. B) The fpg probe is cleaved by glycosylase/lyase E coli. fpg at the dR site (the deoxyribose of the abasic site via a C-O-C linker) to release the fluorophore and allow a fluorescent signal to develop. C) The exo probe is cleaved by the E. coli exonuclease III at the abasic site (THF) releasing the fluorophore from the quencher and creating a fluorescent signal. (For interpretation of the references to color in this figure legend, the reader is referred to the Web version of this article.)
Fig. 6
Fig. 6
Septa-plex amplification and detection using RPA-LFA. A) Positioning of the antibodies in the 7 segment display. B) Number displays based on amplicon tags. C) Corresponding 5′ forward primer labels necessary for the aforementioned number displays. D) Successful detection of targets with visible numbers 0–9 and control lines (composed of rabbit anti-mouse antibody). Reprinted with permission from (Li et al., 2019). Copyright 2019 American Chemical Society.
Fig. 7
Fig. 7
Schematics of RCA mechanisms. A) Ligation RCA. B) Linear RCA. C) Hyperbranched RCA.
Fig. 8
Fig. 8
Schematic of the PNA-based padlock probe system. A) The bis-PNAs bind to one strand of the target DNA, leaving the opposite strand open for padlock probe ligation. B) The linear padlock probe hybridizes to the displaced strand to form a PD-loop. C) The circularized template undergoes HRCA. D) Nicking enzymes cut one strand of the double-stranded product into multiple nicked pieces. Primer extension subsequently displaces the nicked strands which then form G-quadruplex structures to complex with hemin to form DNAzymes. Reprinted with permission from (Gomez et al., 2014). Copyright 2014 American Chemical Society.
Fig. 9
Fig. 9
DNAzyme-mediated ABTS colorimetric detection of PDGF-BB, with concentrations ranging from 0 to 1000 pg/mL. A) Photographs captured 5 min after ABTS oxidation. B) Changes in absorbance as a function of time. C) Absorbance at 415 nm as a function of PDGF-BB concentration. Reprinted with permission from (Tang et al., 2012). Copyright 2012 American Chemical Society.
Fig. 10
Fig. 10
Schematic of liquid crystal colorimetric detection of PDGF-BB or adenosine. (A) Ligation-RCA amplifies the target on the magnetic bead, while (B) RCA does not proceed in the absence of the target. (C) Following RCA, the positive sample induces a planar orientation of the liquid crystal, which (D) then appears bright. (E) In the absence of the RCA product, the liquid crystal interface retains a homeotropic arrangement, (F) appearing dark. Reprinted with permission from (Qi et al., 2019). Copyright 2019 American Chemical Society.
Fig. 11
Fig. 11
Paper-based detection of RCA products using (A) a radioactive tracer, (B) a fluorophore-labeled oligonucleotide, (C) functionalized GNs for colorimetric detection, and (D) DNAzyme-mediated oxidation of TMB for colorimetric detection. TP1: non-fluorescently labeled primer; CDT1: circular DNA template. Reprinted with permission from (Liu et al., 2016). Copyright 2016 WILEY-VCH Verlag GmbH & Co.
Fig. 12
Fig. 12
Schematic of the NASBA mechanism. A target RNA is introduced to the noncyclic phase, resulting in an RNA (-) product that acts as a template for cyclic phase amplification, which in turn forms more RNA (-) products.
Fig. 13
Fig. 13
Workflow of Zika virus detection. Online databases are used for primer design. In less than 7 h, sequence-specific toehold sensors can be assembled and validated. In 1 day, toehold sensors can be freeze-dried and embedded into a paper disc with a shelf life of more than 1 year. The paper-based sensor can then be used to detect RNA of interest with a change of color, using the NASBA technique. Reprinted from (Pardee et al., 2016), Copyright 2016, with permission from Elsevier. (For interpretation of the references to color in this figure legend, the reader is referred to the Web version of this article.)
Fig. 14
Fig. 14
Schematic of the HDA mechanism. Reprinted with permission from (Tröger et al., 2015).
Fig. 15
Fig. 15
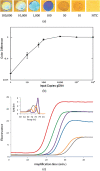
The sensitivity of the MRSA detection device. (a) Colorimetric results from the detection of MRSA with 0 to 106 copies of genomic DNA. (b) Color difference as a function of target DNA copy number. (c) Real-time tHDA amplification plot with each color representing the quantity of input genomic DNA: no template control (gray), 102 copies (orange), 103 copies (blue), 104 copies (purple), 105 copies (green), 106 copies (red). Reprinted with permission from (Jenison et al., 2014). Copyright 2014 Royal Society of Chemistry. (For interpretation of the references to color in this figure legend, the reader is referred to the Web version of this article.)
Fig. 16
Fig. 16
Comparison of DNA amplification by the one-pot reaction and the conventional tHDA reaction detected by gel electrophoresis. Whole cell samples were used in these experiments. Reprinted by permission from Springer Nature: Springer Nature, Analytical and Bioanalytical Chemistry (Cheung et al., 2018), Copyright 2018.

Similar articles

Cited by

References

    1. Abdolahzadeh A., Dolgosheina E.V., Unrau P.J. RNA detection with high specificity and sensitivity using Nested Fluorogenic Mango NASBA. RNA. 2019;25:1806–1813. - PMC - PubMed
    1. Ali M.M., Li F., Zhang Z., Zhang K., Kang D., Ankrum J.A., Le X.C., Zhao W. Rolling circle amplification: a versatile tool for chemical biology, materials science and medicine. Chem. Soc. Rev. 2014;43:3324–3341. - PubMed
    1. An L., Tang W., Ranalli T.A., Kim H., Wytiaz J., Kong H. Characterization of a thermostable UvrD helicase and its participation in helicase-dependent amplification. J. Biol. Chem. 2005;280:28952–28958. - PMC - PubMed
    1. Ao W., Jenison R. Detection of rpoB gene mutations using helicase-dependent amplification. In: Kolpashchikov D.M., Gerasimova Y.V., editors. Nucleic Acid Detection: Methods and Protocols. Humana Press; New Jersey: 2013. pp. 89–98. - PubMed
    1. Ao W., Aldous S., Woodruff E., Hicke B., Rea L., Kreiswirth B., Jenison R. Rapid detection of rpoB gene mutations conferring rifampin resistance in. Mycobacterium Tuberculosis. J. Clin. Microbiol. 2012;50(7):2433–2440. - PMC - PubMed

Supplementary concepts