

Deceased donor kidney allocation: an economic evaluation of contemporary longevity matching practices
- PMID: 33036621
- PMCID: PMC7547436
- DOI: 10.1186/s12913-020-05736-y
Deceased donor kidney allocation: an economic evaluation of contemporary longevity matching practices
Abstract
Background: Matching survival of a donor kidney with that of the recipient (longevity matching), is used in some kidney allocation systems to maximize graft-life years. It is not part of the allocation algorithm for Australia. Given the growing evidence of survival benefit due to longevity matching based allocation algorithms, development of a similar kidney allocation system for Australia is currently underway. The aim of this research is to estimate the impact that changes to costs and health outcomes arising from 'longevity matching' on the Australian healthcare system.
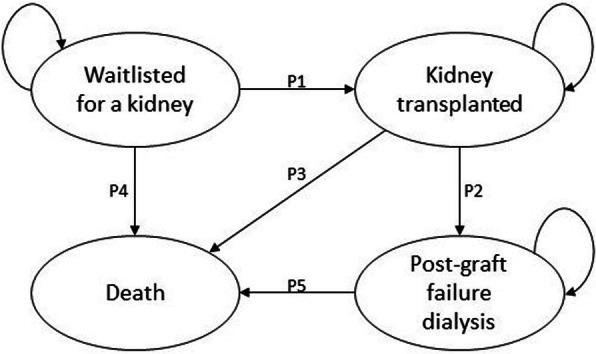
Methods: A decision analytic model to estimate cost-effectiveness was developed using a Markov process. Four plausible competing allocation options were compared to the current kidney allocation practice. Models were simulated in one-year cycles for a 20-year time horizon, with transitions through distinct health states relevant to the kidney recipient. Willingness to pay was considered as AUD 28000.
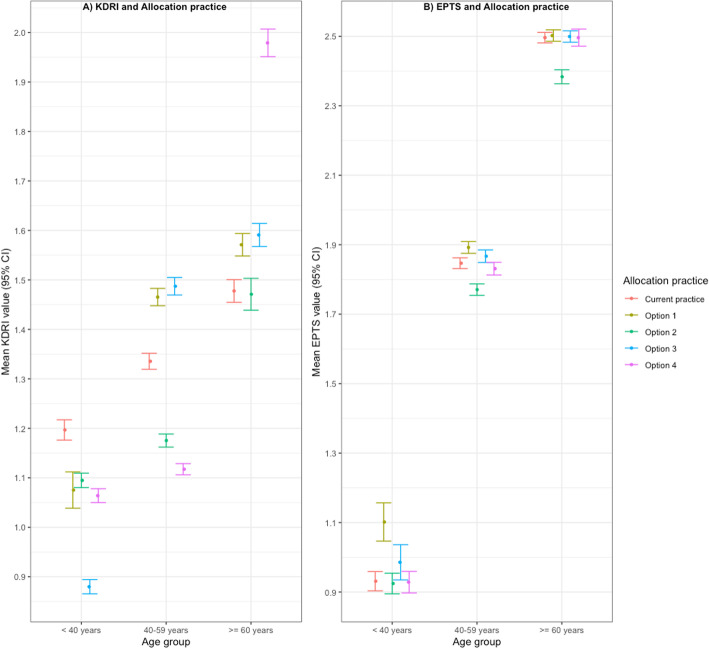
Results: Base case analysis indicated that allocating the worst 20% of Kidney Donor Risk Index (KDRI) donor kidneys to the worst 20% of estimated post-transplant survival (EPTS) recipients (option 2) and allocating the oldest 25% of donor kidneys to the oldest 25% of recipients are both cost saving and more effective compared to the current Australian allocation practice. Option 2, returned the lowest costs, greatest health benefits and largest gain to net monetary benefits (NMB). Allocating the best 20% of KDRI donor kidneys to the best 20% of EPTS recipients had the lowest expected incremental NMB.
Conclusion: Of the four longevity-based kidney allocation practices considered, transplanting the lowest quality kidneys to the worst kidney recipients (option 2), was estimated to return the best value for money for the Australian health system.
Keywords: Cost utility analysis; Kidney allocation; Longevity matching; QALY; Transplant.
Conflict of interest statement
The authors declare that they have no competing interest.
Figures

Similar articles
-
Donor Kidney Quality and Transplant Outcome: An Economic Evaluation of Contemporary Practice.Value Health. 2020 Dec;23(12):1561-1569. doi: 10.1016/j.jval.2020.07.007. Epub 2020 Sep 15. Value Health. 2020. PMID: 33248511
-
Survival and Quality of Life Impact of a Risk-based Allocation Algorithm for Deceased Donor Kidney Transplantation.Transplantation. 2018 Sep;102(9):1530-1537. doi: 10.1097/TP.0000000000002144. Transplantation. 2018. PMID: 29485512
-
Graft and Patient Survival in Kidney Transplant with Deceased Donor Using KDRI (Kidney Donor Risk Index), KDPI (Kidney Donor Profile Index), and EPTS (Estimated Post-Transplant Survival) in Colombia.Ann Transplant. 2023 Aug 1;28:e940522. doi: 10.12659/AOT.940522. Ann Transplant. 2023. PMID: 37525450 Free PMC article.
-
A critical assessment on kidney allocation systems.Transplant Rev (Orlando). 2017 Jan;31(1):61-67. doi: 10.1016/j.trre.2016.10.002. Epub 2016 Oct 8. Transplant Rev (Orlando). 2017. PMID: 27919635 Review.
-
The development of new allocation policy for deceased donor kidneys.Curr Opin Nephrol Hypertens. 2007 Nov;16(6):512-5. doi: 10.1097/MNH.0b013e3282f08638. Curr Opin Nephrol Hypertens. 2007. PMID: 18089963 Review.
Cited by
-
Impact of Change in Allocation Score Methodology on Post Kidney Transplant Average Length of Stay.J Clin Med Res. 2022 Mar;14(3):111-118. doi: 10.14740/jocmr4673. Epub 2022 Mar 25. J Clin Med Res. 2022. PMID: 35464605 Free PMC article.
-
Time-to-event analysis in economic evaluations: a comparison of modelling methods to assess the cost-effectiveness of transplanting a marginal quality kidney.Health Econ Rev. 2021 Apr 15;11(1):13. doi: 10.1186/s13561-021-00312-4. Health Econ Rev. 2021. PMID: 33856573 Free PMC article.
-
Cost-Effectiveness and Budget Impact Analysis of Implementing a 'Soft Opt-Out' System for Kidney Donation in Australia.Appl Health Econ Health Policy. 2022 Sep;20(5):769-779. doi: 10.1007/s40258-022-00747-8. Epub 2022 Jul 18. Appl Health Econ Health Policy. 2022. PMID: 35843996 Free PMC article.
References
-
- Gill JS, Gill J, Rose C, Zalunardo N, Landsberg D. The older living kidney donor: part of the solution to the organ shortage. Transplantation. 2006;82(12):1662–1666. - PubMed
-
- National Kidney Foundation. Organ donation and transplantation statistics: National Kidney Foundation; 2019 [cited 2019 October 23]. Available from: https://www.kidney.org/news/newsroom/factsheets/Organ-Donation-and-Trans....
-
- NHS Blood and Transplant. Kidney acticity United Kingdom: NHS Blood and Transplant; 2020 [cited 2020 July 29]. Available from: https://nhsbtdbe.blob.core.windows.net/umbraco-assets-corp/19192/section....
-
- Australian Government OaTA. Facts and statistics Australia: Australian Government, Organ and Tissue Authority; 2019 [cited 2020 July 29]. Available from: https://donatelife.gov.au/about-donation/frequently-asked-questions/fact....
-
- Global Observatory on Donation and Transplantation. Global data: World Health Organization (WHO) and the Spanish Transplant Organization; 2020 [cited 2020 July 29]. Available from: http://www.transplant-observatory.org/summary/.
MeSH terms
LinkOut - more resources
Full Text Sources
Medical
