. 2020 Oct 9;17(1):295.
doi: 10.1186/s12974-020-01973-4.

Inhibiting HMGB1-RAGE axis prevents pro-inflammatory macrophages/microglia polarization and affords neuroprotection after spinal cord injury

Affiliations

Inhibiting HMGB1-RAGE axis prevents pro-inflammatory macrophages/microglia polarization and affords neuroprotection after spinal cord injury

Hong Fan et al. J Neuroinflammation. .

Abstract

Background: Spinal cord injury (SCI) favors a persistent pro-inflammatory macrophages/microglia-mediated response with only a transient appearance of anti-inflammatory phenotype of immune cells. However, the mechanisms controlling this special sterile inflammation after SCI are still not fully elucidated. It is known that damage-associated molecular patterns (DAMPs) released from necrotic cells after injury can trigger severe inflammation. High mobility group box 1(HMGB1), a ubiquitously expressed DNA binding protein, is an identified DAMP, and our previous study demonstrated that reactive astrocytes could undergo necroptosis and release HMGB1 after SCI in mice. The present study aimed to explore the effects and the possible mechanism of HMGB1on macrophages/microglia polarization, as well as the neuroprotective effects by HMGB1 inhibition after SCI.

Methods: In this study, the expression and the concentration of HMGB1 was determined by qRT-PCR, ELISA, and immunohistochemistry. Glycyrrhizin was applied to inhibit HMGB1, while FPS-ZM1 to suppress receptor for advanced glycation end products (RAGE). The polarization of macrophages/microglia in vitro and in vivo was detected by qRT-PCR, immunostaining, and western blot. The lesion area was detected by GFAP staining, while neuronal survival was examined by Nissl staining. Luxol fast blue (LFB) staining, DAB staining, and western blot were adopted to evaluate the myelin loss. Basso-Beattie-Bresnahan (BBB) scoring and rump-height Index (RHI) assay was applied to evaluate locomotor functional recovery.

Results: Our data showed that HMGB1 can be elevated and released from necroptotic astrocytes and HMGB1 could induce pro-inflammatory microglia through the RAGE-nuclear factor-kappa B (NF-κB) pathway. We further demonstrated that inhibiting HMGB1 or RAGE effectively decreased the numbers of detrimental pro-inflammatory macrophages/microglia while increased anti-inflammatory cells after SCI. Furthermore, our data showed that inhibiting HMGB1 or RAGE significantly decreased neuronal loss and demyelination, and improved functional recovery after SCI.

Conclusions: The data implicated that HMGB1-RAGE axis contributed to the dominant pro-inflammatory macrophages/microglia-mediated pro-inflammatory response, and inhibiting this pathway afforded neuroprotection for SCI. Thus, therapies designed to modulate immune microenvironment based on this cascade might be a prospective treatment for SCI.

Keywords: HMGB1; Macrophages/microglia; Polarization; RAGE; Spinal cord injury.


Conflict of interest statement

The authors declare no conflicts of interest.

Figures
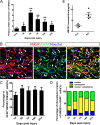
Fig. 1
Fig. 1
HMGB1 Expression after SCI. a Temporal pattern of HMGB1 mRNA in spinal cord of sham-operated and SCI rats. Note that the mRNA level of HMGB1 was significantly increased from 3 to 21 dpi. Results were expressed as mean ± SEM of 3 rats, *P < 0.05, **P < 0.01. b Immunohistochemistry of HMGB1. Note that all the cells around the epicenter were labeled with HMGB1-positive signal, with different intracellular localization (nuclear indicated by arrowheads, cytoplasmic indicated by thick arrows, and both cytoplasmic and nuclear indicated by thin arrows). Asterisks indicate the epicenter. Scale bar = 80 μm. cd Quantification of intracellular localization of HMGB1. About 60% of the HMGB1-positive cells were GFAP-positive. Note that percentage of cytoplasmic HMGB1 in GFAP-positive cells reached peak (67.0 ± 7.56%) at 7 dpi, and lowest percentage (10.2 ± 1.81%) of nuclear HMGB1 at 7 dpi. e Elevated HMGB1 serum levels in 4 rats 3 days after SCI compared with sham-operated controls, *P < 0.05
Fig. 2
Fig. 2
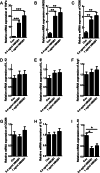
HMGB1 increased the expression of pro-inflammatory markers in the microglia. The mRNA expression of pro-inflammatory markers of TNFα (a), iNOS (b), CD86 (c), and IL-12 (d) was significantly increased in microglia 24 h after recombinant HMGB1 treatment, except for no change of IL-18 (e). No significant changes in anti-inflammatory markers of Arg1, CD206, and IL-4 after HMGB1 treatment (fh), except for a decrease of IL-10 (i). Results are presented as mean ± SEM. N = 3, *P < 0.05, **P < 0.01, ***P < 0.001
Fig. 3
Fig. 3
HMGB1 activated TLR4 and RAGE in vitro, and SCI induced the expression of RAGE in macropgahes/microglia. The mRNA expression of TLR4 (a) and RAGE (b) was significantly increased in microglia at 24 h after 0.4 or 1 μg/ml HMGB1 treatment. (cd) Double-staining of GFAP/TLR4 and quantification of TLR4-positive cell types at 5 dpi. Note that about 80% TLR4-positive cells were GFAP-positive, while 17% were Iba-1 positive. Scale bar = 50 μm. e Representative images of double-staining of RAGE and F4/80 in injured cord of saline- or glycyrrhizin-treated rats. Scale bar = 50 μm. f Quantification of the relative percentage of RAGE-positive cells in F4/80-positive cells. N = 4, *P < 0.05
Fig. 4
Fig. 4
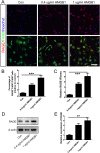
HMGB1 induced RAGE expression in microglia. a Representative images of double-staining of RAGE and F4/80 in microglia under normal condition or HMGB1 treatment. Scale bar = 50 μm. bc Quantification of the numbers of RAGE-positive cells and the IFI/area of RAGE. Note that both the percentage of RAGE-positive cells and IFI of RAGE were significantly increased after HMGB1 treatment. N = 3, ***P < 0.001. IFI, immunofluorescence intensity. de Quantification of the protein expression levels of RAGE in control and HMGB1-treated group. β-actin was used as a loading control. Data were expressed as mean ± SEM. N = 3, **P < 0.01
Fig. 5
Fig. 5
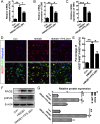
Inhibiting RAGE-suppressed HMGB1- or SCI-induced pro-inflammatory polarization of macrophages/microglia. FPS-ZM1 (a RAGE-specific blocker) significantly reversed the increased mRNA of iNOS (a), CD86 (b), and TNFα (c) induced by HMGB1. N = 3, *P < 0.05, **P < 0.01, ***P < 0.001. d Representative images of double-staining of iNOS and F4/80 in microglia under normal condition, HMGB1 or HMGB1plus FPS-ZM1 treatment. Scale bar = 30 μm. e Quantification of the percentage of iNOS-positive cells in F4/80-positive cells. Note that FPS-ZM1 significantly inhibited the increased number of iNOS-positive cells induced by HMGB1. N = 3, *P < 0.05, **P < 0.01. fg Quantification of the expression levels of RAGE and p-NF-κB in microglia under different conditions. β-actin was used as a loading control. Data were expressed as mean ± SEM. N = 3, *P < 0.05, **P < 0.01
Fig. 6
Fig. 6
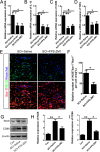
Inhibiting HMGB1or RAGE reduced the numbers of pro-inflammatory macrophages/microglia after SCI. Quantification of pro-inflammatory mRNA of iNOS (a), IL-12 (b), CD86 (c), and TNFα (d) in saline-, glycyrrhizin-, or FPS-ZM1-treated rats at 14 dpi. Results are presented as mean ± SEM. N = 3/group, *P < 0.05. e Representative images of double-staining of iNOS and Iba-1 in saline- or FPS-ZM1-treated rats at 14 dpi. Scale bar = 80 μm. f Quantification of iNOS-positive microglia/macrophages in the bilateral areas 200 μm rostral and caudal to the lesion site. Notice the decrease of iNOS-positive microglia/macrophages in FPS-ZM1-treated rats. Results are mean ± SEM. N = 5/group, *P < 0.05. gi Quantification of the expression levels of iNOS and CD86 in sham group, saline-, or FPS-ZM1-treated rats at 14 days after SCI. N = 5/goup, *P < 0.05, **P < 0.01
Fig. 7
Fig. 7
The effects of FPS-ZM1 treatment on lesion area and neuronal survival after SCI. a Dashed lines indicate the lesion border defined by GFAP immunoreactivity in saline- or FPS-ZM1-treated rats at 21 dpi. Scale bar = 500 μm. b Quantification of lesion area. N = 6/group, *P < 0.05. c A representative Nissl-stained section of saline- or FPS-ZM1-treated rats at 21 dpi. Broken lines mark the lesion borders. Arrows indicate Nissl-stained neurons. Scale bar = 600 μm in the left lower-magnification pictures and 100 μm in the right higher-magnification pictures from the boxes of left. d Quantification of the numbers of Nissl-stained neurons at 21 dpi. Note that the numbers of Nissl-stained neurons was significantly increased by FPS-ZM1 treatment in rostral and caudal areas of 600 μm adjacent to lesion. N = 6/group, **P < 0.01
Fig. 8
Fig. 8
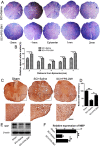
Inhibiting RAGE by FPS-ZM1 reduced myelin loss after SCI. a Spinal cords at 21 days after injury were processed for Luxol fast blue in saline- or FPS-ZM1-treated rats. Transverse cryosections were selected 1000 μm, 2000 μm rostral and caudal to the lesion site, and the epicenter. b Quantification of spared myelin at 1000 μm, 2000 μm rostral and caudal to the lesion site, as well as at the epicenter. Data were expressed as mean ± SEM of 6 rats, *P < 0.05. c DAB staining of MBP in transverse sections at 21 dpi. Scale bar = 100 μm. d Quantification of MBP intensity. Note that FPS-ZM1 attenuated the reduction of MBP intensity in the white matter after injury. Data were expressed as mean ± SEM of 6 rats, *P < 0.05, **P < 0.01. ef Quantification of the protein expression level of MBP in sham group, saline-, or FPS-ZM1-treated rats at 21 days after SCI. N = 6/group, *P < 0.05, **P < 0.01
Fig. 9
Fig. 9
Locomotion recovery improvement by glycyrrhizin or FPS-ZM1 treatment. a BBB scores at 1, 3, 7, 10, 14, and 21 days after SCI. The average BBB scores in glycyrrhizin- or FPS-ZM1-treated group were significantly higher than those in saline group at 7, 10, 14, and 21 days after injury. b SRHI values at 1, 3, 7, 10, 14, and 21 days after SCI. N = 6/group, *P < 0.05

Similar articles

Cited by

References

    1. Ahuja CS, Wilson JR, Nori S, Kotter MRN, Druschel C, Curt A, Fehlings MG. Traumatic spinal cord injury. Nat Rev Dis Primers. 2017;3:17018. doi: 10.1038/nrdp.2017.18. - DOI - PubMed
    1. Chen J, Shifman MI. Inhibition of neogenin promotes neuronal survival and improved behavior recovery after spinal cord injury. Neuroscience. 2019;408:430–447. doi: 10.1016/j.neuroscience.2019.03.055. - DOI - PubMed
    1. Li Q, Houdayer T, Liu S, Belegu V. Induced neural activity promotes an oligodendroglia regenerative response in the injured spinal cord and improves motor function after spinal cord injury. J Neurotrauma. 2017;34:3351–3361. doi: 10.1089/neu.2016.4913. - DOI - PubMed
    1. Fan H, Tang HB, Shan LQ, Liu SC, Huang DG, Chen X, Chen Z, Yang M, Yin XH, Yang H, Hao DJ. Quercetin prevents necroptosis of oligodendrocytes by inhibiting macrophages/microglia polarization to M1 phenotype after spinal cord injury in rats. J Neuroinflammation. 2019;16:206. doi: 10.1186/s12974-019-1613-2. - DOI - PMC - PubMed
    1. Chen H, Ji H, Zhang M, Liu Z, Lao L, Deng C, Chen J, Zhong G. An agonist of the protective factor SIRT1 improves functional recovery and promotes neuronal survival by attenuating inflammation after spinal cord injury. J Neurosci. 2017;37:2916–2930. doi: 10.1523/JNEUROSCI.3046-16.2017. - DOI - PMC - PubMed

MeSH terms