. 2020 Oct 9;6(41):eabc1173.
doi: 10.1126/sciadv.abc1173. Print 2020 Oct.

Cortical and striatal circuits together encode transitions in natural behavior

Affiliations

Cortical and striatal circuits together encode transitions in natural behavior

Joel Sjöbom et al. Sci Adv. .

Abstract

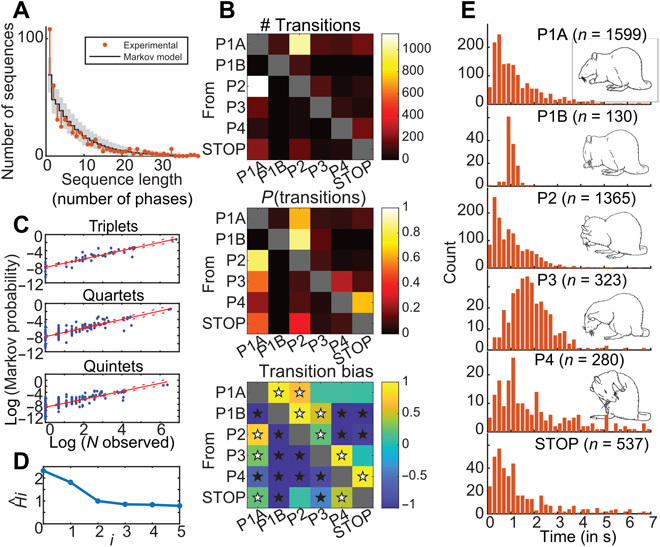
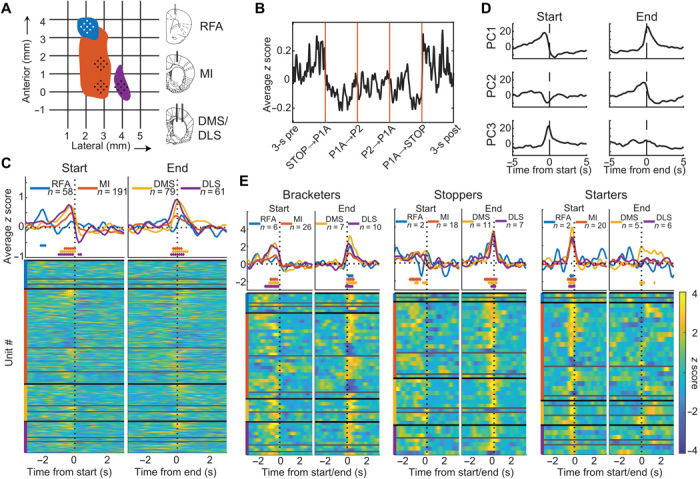
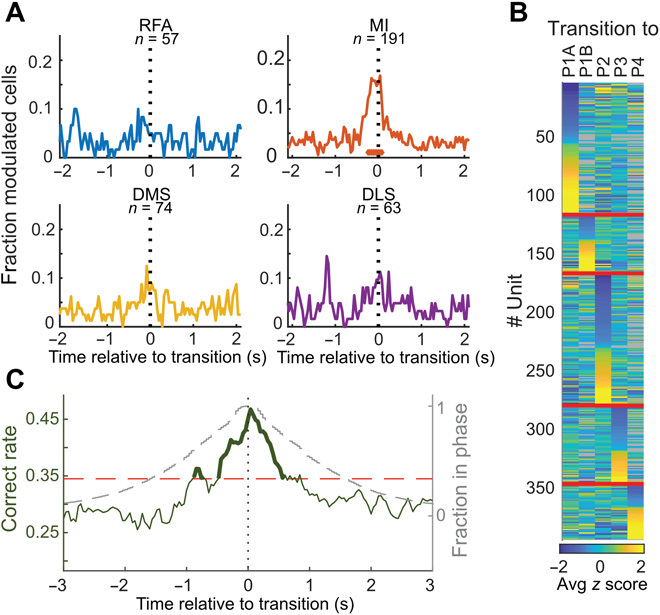
In natural behavior, we fluidly change from one type of activity to another in a sequence of motor actions. Corticostriatal circuits are thought to have a particularly important role in the construction of action sequences, but neuronal coding of a sequential behavior consisting of different motor programs has not been investigated at the circuit level in corticostriatal networks, making the exact nature of this involvement elusive. Here, we show, by analyzing spontaneous self-grooming in rats, that neuronal modulation in motor cortex and dorsal striatum is strongly related to transitions between behaviors. Our data suggest that longer action sequences in rodent grooming behavior emerge from stepwise control of individual behavioral transitions, where future actions are encoded differently depending on current motor state. This state-dependent motor coding was found to differentiate between rare behavioral transitions and as opposed to more habitual sequencing of actions.


Figures

Fig. 1
Fig. 1. The organization of the grooming behavior.
(A) Histogram of the number of phases making up all the observed grooming sequences (shown for sequences that have less than 40 phases, only 1.3% were longer). Markov model of predicted sequence length distribution overlaid with 95% confidence interval (CI). (B) Phase transitions. (Top) Total number observed of each type; range, [0 to 1144]. (Middle) Conditioned transition probability [0 to 1] (probability of going to a given column given the current state, indicated by row). (Bottom) Transition bias (transition pairs where the conditioned probability significantly deviates from the expected number on the basis of the observed frequency of the constituent parts; white/black stars denote statistical over-/underrepresentation, outside a bootstrapped 95% CI). (C) Calculated Markov probabilities for higher-order transition sequences containing specific combinations of phases (containing 3, 4, and 5 phases, respectively) plotted against the corresponding observed numbers within all the grooming sequences (correlation is highly significant in all cases; P < 0.0001; Spearman rank correlation, with rho = 0.92, 0.80, and 0.77, respectively). (D) Average conditional uncertainty in terms of Shannon information as a function of model order. Note the drop in conditional uncertainty when the previous state is known compared to when it is not (i = 2; first order Markov), whereas the uncertainty drops only moderately when the state two steps back is included in the model (i = 3). (E) Histograms of phase durations for the five phases and the duration of pauses between grooming bouts {STOP; behavior illustrated by inserted schematics [adapted from Aldridge and Berridge, 1998 (21)]}. Two-sample Kolmogorov-Smirnov test showed a statistical difference between all pairs of distributions (P < 0.001 after Bonferroni correction). Total number of each phase indicated by “n,” corresponding to (means ± SD) across recordings P1A, 42.7 ± 3.4%; P1B, 3.8 ± 1.3%; P2, 36.3 ± 4.6%; P3, 9.1 ± 2.6%; and P4, 8.1 ± 5.6%.
Fig. 2
Fig. 2. Modulation of neuronal activity in relation to the onset and end of a grooming sequence.
(A) Recording sites are shown for the right hemisphere. Colored areas in horizontal plane indicate the forelimb representation in primary motor cortex (MI, orange), RFAs (blue), sensorimotor striatum (DLS, purple), and associative striatum (DMS) corresponds to the posterior medial group of electrodes (where DMS is located ventral to the posterior part of MI). (B) Average of z-scored firing rates of recorded units during a specific grooming sequence. The x axis is time warped to align transitions. (C) Top: Average changes in firing rate show a net increase at behavioral transitions into and out of grooming. Bottom: Perievent time histograms (PETHs) for all recorded cells, showing the average standardized rate for each cell, sorted by structure (colored vertical lines), putative cell type (PCs, INs, and unclassified, from top to bottom within each structure), and average z score during significant time bins. The range of Z is indicated by the color bar in (E). (D) Cell firing dynamics represented in the subspace spanned by the first three principal components [of the PETHs shown in (C)], demonstrating symmetry between transitions into and out of grooming. (E) Left: Cells that display significant post-end modulation (bracketers) also show pre-onset modulation. Middle: Cells that show significant pre-end modulation (Stoppers) show minimal bracketing modulation. Right: Cells that show significant pre-onset modulation without significant end modulation (Starters). Note the close resemblance in firing rate modulations between (D) and (E) and that striatum displays a predominant excitation, whereas MI modulation is more balanced, resulting in lower average firing rates. Start, first contact between forepaw and snout; end, first instance of inactivity. Diamonds in (C) and (E) denote individual time bins (125 ms) where the distribution of z-scored firing rates differs significantly from a standard normal distribution (P < 0.001; z test).
Fig. 3
Fig. 3. Modulation of neuronal activity in transitions between grooming phases.
(A) Only MI showed significant modulation in association with transition events, in general (n = same number of PETHs, as in Fig. 2C). (B) Standardized firing rate modulations of all cells grouped according to preference for a specific upcoming grooming phase (transitions too rarely observed to be included are denoted in gray; means from 200 ms immediately before transition). Note that a single phase is generally preferred. (C) Fraction correct phase predictions for the coming phase obtained from cortical and striatal ensemble activity plotted as a function of time (dark green). Note that most information about which phase is being executed after the transition point (t = 0) is available in a relatively narrow time window around t = 0 (the much broader time interval enclosed by the gray dashed line indicates the fraction of events where no additional phase switches were observed before/after phase transition, i.e., the animal remains in the same phase pair that make up the transition at t = 0). Horizontal red dashed line marks chance level + 2.3 SD, corresponding to P = 0.01.
Fig. 4
Fig. 4. State-dependent motor commands.
(A) Rate changes observed in an example MI principal cell in conjunction with specific phase transitions (t = 0 in each panel). Vertical lines mark the time points of single spikes, and colors of horizontal lines within panels denote the duration of preceding and succeeding phases. The cell displays a complex modulation pattern, showing specific firing patterns associated with present, as well as upcoming phases. Note, however, that transitions into the same phase are, in some cases, associated with diverse transition activity before transition (e.g., P1A to P2 versus P1B to P2; indicative of state-dependent motor coding). (B) Transition probability coding at population level. Colored lines show the P value for a linear model between the z scored firing rates and probability of transition (fitlm in MATLAB) for the respective groups. One linear model was fitted for each time bin and each group (500-ms window and 100-ms steps; see Materials and Methods). The plotted P values are presented without correction for multiple comparisons. (C) Transition probability coding for single cells. The estimated slope for each cell was compared to a shuffled CI. Cells that had a slope outside the shuffled 95% CI were considered significant (1000 shuffles of transition types). (Top) Total number of significant cells in cortex (RFA and MI) and (bottom) striatum (DMS and DLS). Light shaded area: Decreased firing rate during relatively more common transitions. Dark shaded area (not including the light area): Increased firing rate during relatively more common transitions. Dashed horizontal lines denote the number of significant cells required for a binomial test with chance level at 5% to reach alpha of 0.001 for the corresponding total n (without correction for multiple comparisons; fitlm in MATLAB with 500-ms window and 100-ms steps). (D) Same as for (C) but grouped by cell type and recording location.

Similar articles

Cited by

References

    1. Mink J. W., The basal ganglia: Focused selection and inhibition of competing motor programs. Prog. Neurobiol. 50, 381–425 (1996). - PubMed
    1. Fujii N., Graybiel A. M., Representation of action sequence boundaries by macaque prefrontal cortical neurons. Science 301, 1246–1249 (2003). - PubMed
    1. Jin X., Costa R. M., Start/stop signals emerge in nigrostriatal circuits during sequence learning. Nature 466, 457–462 (2010). - PMC - PubMed
    1. Tanji J., Shima K., Role for supplementary motor area cells in planning several movements ahead. Nature 371, 413–416 (1994). - PubMed
    1. Barnes T. D., Kubota Y., Hu D., Jin D. Z., Graybiel A. M., Activity of striatal neurons reflects dynamic encoding and recoding of procedural memories. Nature 437, 1158–1161 (2005). - PubMed

Publication types

LinkOut - more resources