. 2020 Oct 9;6(41):eaat5979.
doi: 10.1126/sciadv.aat5979. Print 2020 Oct.

The circadian dynamics of the hippocampal transcriptome and proteome is altered in experimental temporal lobe epilepsy

Affiliations

The circadian dynamics of the hippocampal transcriptome and proteome is altered in experimental temporal lobe epilepsy

K J Debski et al. Sci Adv. .

Abstract

Gene and protein expressions display circadian oscillations, which can be disrupted in diseases in most body organs. Whether these oscillations occur in the healthy hippocampus and whether they are altered in epilepsy are not known. We identified more than 1200 daily oscillating transcripts in the hippocampus of control mice and 1600 in experimental epilepsy, with only one-fourth oscillating in both conditions. Comparison of gene oscillations in control and epilepsy predicted time-dependent alterations in energy metabolism, which were verified experimentally. Although aerobic glycolysis remained constant from morning to afternoon in controls, it increased in epilepsy. In contrast, oxidative phosphorylation increased in control and decreased in epilepsy. Thus, the control hippocampus shows circadian molecular remapping, which is altered in epilepsy. We suggest that the hippocampus operates in a different functioning mode in epilepsy. These alterations need to be considered when studying epilepsy mechanisms, designing drug treatments, and timing their delivery.


Figures

Fig. 1
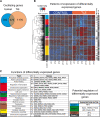
Fig. 1. Circadian regulation of genes and proteins in the hippocampus and their reprogramming in epilepsy.
(A) Transcripts oscillating in circadian rhythm. In control mice [n = 4 per zeitgeber time (ZT)], 1256 transcripts are oscillating. In TLE (n = 4 per ZT), more transcripts are oscillating (1650). Only 474 are common to both conditions, showing a remodeling of the landscape of oscillating genes in TLE. (B) Heatmap of 486 mRNAs showing circadian differential expression. Sixty-seven mRNAs were differentially expressed in at least one time point only in control animals, 384 mRNAs were differentially expressed only in TLE, and 35 mRNAs were differentially expressed in both groups. Each column per time window represents an individual animal, and each row represents an individual mRNA. Colors on the heatmap represent z score: higher, red; lower, blue. The hour of tissue collection is indicated below (ZT). The dendrogram obtained from hierarchical clustering is shown on the left side of the heatmap. Genes are ordered by clustering complete linkage method together with Pearson correlation distance measure. Colors in the bar on the left side of the heatmap represent clusters obtained by cutting dendrogram at selected level heights to obtain nine groups. Black lines in the bar on the right side of the heatmap mark genes showing differences in expression between control or TLE animals based on one-way ANOVA (analysis of variance) [cut-off false discovery rate (FDR) < 0.05]. (C) Left: Biological functions for each gene cluster [defined on the heatmap from (A)] according to Gene Ontology vocabulary using DAVID. Only terms, which are represented by more than 5% of genes in a given cluster, are presented in the table. (Right bottom) Transcription factors with binding sites overrepresented in different gene clusters defined on the heatmap from (B).
Fig. 2
Fig. 2. Comparison of oscillatory transcripts across brain regions.
List of genes showing a circadian regulation in control mice, in the hippocampus (hippocampus), SCN, cerebellum (Cer), brainstem (Bstm), and hypothalamus (Hyp). If most core clock genes display circadian regulation in most structures, then numerous genes oscillate specifically in the hippocampus.
Fig. 3
Fig. 3. Phase change and general increase in oscillation amplitude in TLE, as compared to controls.
Oscillation patterns (A) and amplitudes (B) of core clock genes.
Fig. 4
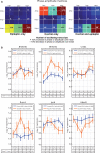
Fig. 4. Different oscillatory patterns of gene transcripts in control mice and their alterations in TLE.
(A) Phase-amplitude matrices. Most of the transcripts show high amplitude oscillations in TLE, while they are distributed in controls between low and high amplitude. Most of high-amplitude oscillatory transcripts are phase advanced as compared to the rest of the oscillatory transcripts, a property more pronounced in TLE. The number of oscillating transcripts is labeled in each box. Boxes are defined as phase delayed “Lag−,” phase advanced “Lag+,” or no phase change in the columns. Rows indicate the amplitude. Advanced or delayed amplitude or phase is taken as a minimum of 10% change over the total mean for amplitude and phase, respectively. The number of oscillating transcripts is color coded. Blue indicates the lowest values, and dark red indicates the highest values per condition (control alone, TLE alone, and both). (B) Oscillatory patterns of genes that may contribute to the reprogramming of the circadian hippocampal remapping in TLE. Creb1 oscillates in both conditions. Key controllers of circadian rhythms, Bhlhe40 and Bhlhe41, show increased oscillation amplitudes in TLE, which may contribute to the large recruitment of oscillating genes in TLE. Runx1, a DNA binding regulator, and Hdac8, a chromatin remodeler, gain statistically significant oscillation in TLE. JunD (which interacts with both the AP-1 transcription factor complex and Creb1) shows a 180° phase shift in TLE as compared to control.
Fig. 5
Fig. 5. Alteration of circadian regulation of energy metabolism in TLE.
(A) Differences between control and TLE animals in selected gene set activity (cut-off P value of <0.05). Light green and blue emphasize gene sets involved in glucose aerobic and oxidative metabolism, respectively. (B) Metabolic activity induced by electrical stimulation (dashed rectangle) using NAD(P)H (reduced form of nicotinamide adenine dinucleotide phosphate) imaging (a and b), glucose (c and d), and lactate (e and f) sensing. (a) Averaged NAD(P)H fluorescence in TLE (yellow trace) and control (dark gray trace) slices at ZT3. The mean amplitude of the NAD(P)H transient overshoot was significantly smaller in TLE than in control (dashed arrows), suggesting reduced activity of cytosolic glycolysis in TLE. (b) There was no difference in NAD(P)H overshoot in slices prepared at ZT8 in TLE (red trace) and control (gray trace) mice. However, dip amplitudes (gray arrow heads) were significantly smaller in TLE, indicating a reduced activity of oxidative phosphorylation. Glucose consumption (c) and lactate release (e) were lower in TLE (red traces) at ZT3. At ZT8, both parameters were increased in TLE, indicating enhanced aerobic glycolysis activity (d and f, red traces). In control, glucose consumption (d, gray trace) increased with time while lactate release profile (f versus e, gray traces) had lower amplitude as compared to ZT3 and displayed a short-lasting lactate decrease at the beginning of the stimulation (f, gray arrow head).
Fig. 6
Fig. 6. Circadian regulation of seizures and drug targets in TLE.
(A) Top: Circadian regulation of seizure incidence during the night and day cycle. The highest seizure probability is found around ZT8. Bottom: Two days after shifting the light/dark cycle by 8 hours in the animal facility, the temporal pattern of seizure incidence shifted accordingly. (B and C) Alterations of the temporal expression of genes encoding for NMDA (N-methyl-d-aspartate) and AMPA receptors subunits, respectively.

Comment in

  • Ticktock-What Is the Seizure Driving Clock?
    Eid T. Eid T. Epilepsy Curr. 2021 Jan 29;21(2):122-123. doi: 10.1177/1535759721989672. eCollection 2021 Mar-Apr. Epilepsy Curr. 2021. PMID: 34025290 Free PMC article. No abstract available.

References

    1. Bass J., Lazar M. A., Circadian time signatures of fitness and disease. Science 354, 994–999 (2016). - PubMed
    1. Masri S., Sassone-Corsi P., The circadian clock: A framework linking metabolism, epigenetics and neuronal function. Nat. Rev. Neurosci. 14, 69–75 (2013). - PMC - PubMed
    1. Eckel-Mahan K., Sassone-Corsi P., Metabolism and the circadian clock converge. Physiol. Rev. 93, 107–135 (2013). - PMC - PubMed
    1. Zhang R., Lahens N. F., Ballance H. I., Hughes M. E., Hogenesch J. B., A circadian gene expression atlas in mammals: Implications for biology and medicine. Proc. Natl. Acad. Sci. U.S.A. 111, 16219–16224 (2014). - PMC - PubMed
    1. Brüning F., Noya S. B., Bange T., Koutsouli S., Rudolph J. D., Tyagarajan S. K., Cox J., Mann M., Brown S. A., Robles M. S., Sleep-wake cycles drive daily dynamics of synaptic phosphorylation. Science 366, eaav3617 (2019). - PubMed

Publication types