Comparative Study
. 2020 Nov 24;86(24):e01787-20.
doi: 10.1128/AEM.01787-20. Print 2020 Nov 24.

Genome-Wide Identification of Host-Segregating Single-Nucleotide Polymorphisms for Source Attribution of Clinical Campylobacter coli Isolates

Affiliations
Comparative Study

Genome-Wide Identification of Host-Segregating Single-Nucleotide Polymorphisms for Source Attribution of Clinical Campylobacter coli Isolates

Quentin Jehanne et al. Appl Environ Microbiol. .

Abstract

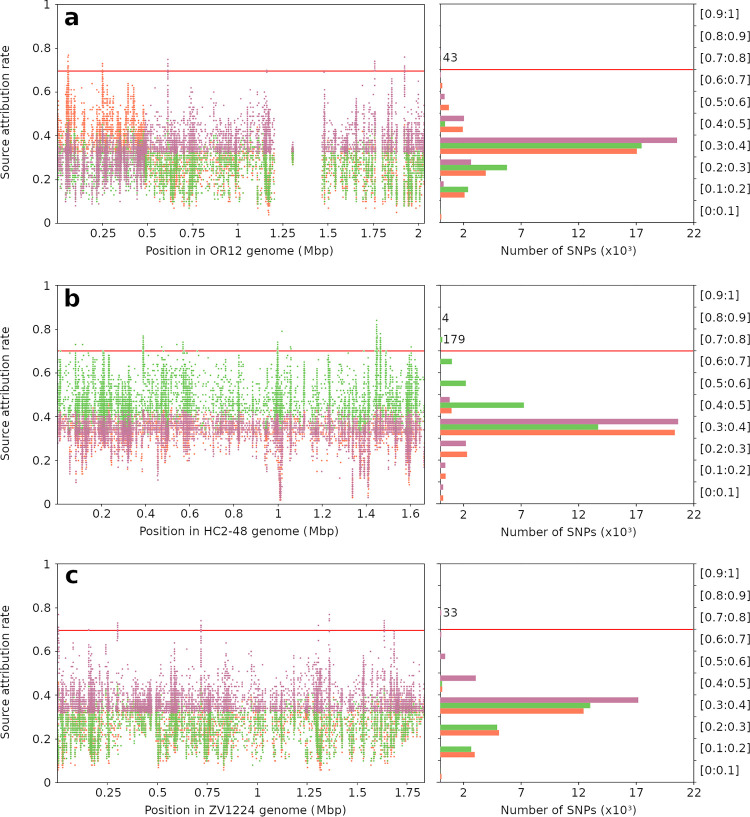
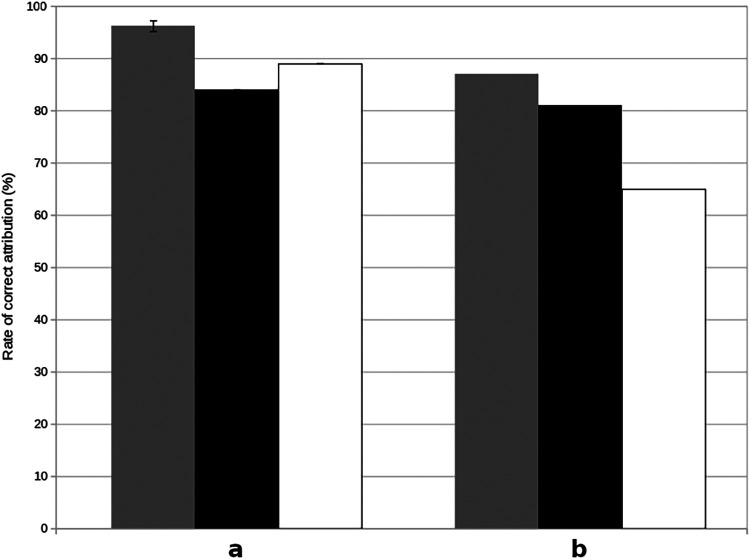
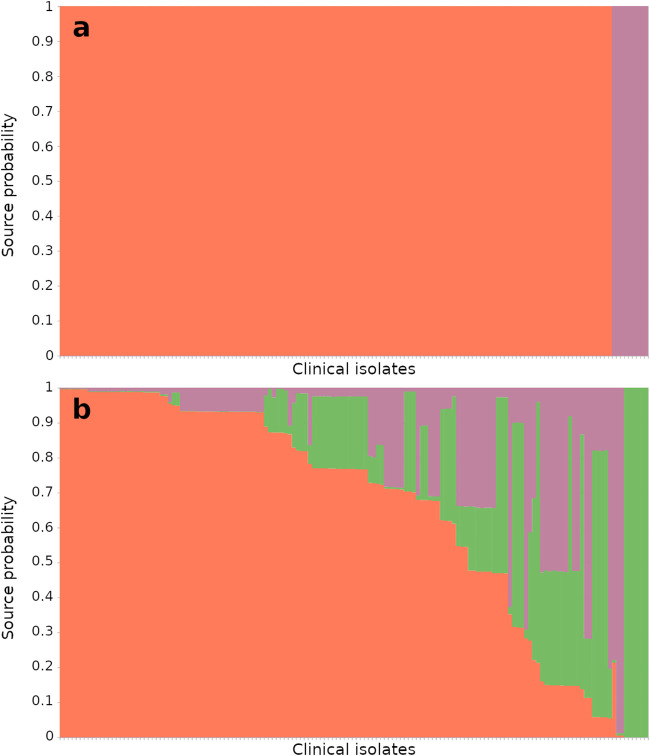
Campylobacter is among the most common causes of gastroenteritis worldwide. Campylobacter jejuni and Campylobacter coli are the most common species causing human disease. DNA sequence-based methods for strain characterization have focused largely on C. jejuni, responsible for 80 to 90% of infections, meaning that C. coli epidemiology has lagged behind. Here, we have analyzed the genome of 450 C. coli isolates to determine genetic markers that can discriminate isolates sampled from 3 major reservoir hosts (chickens, cattle, and pigs). These markers then were applied to identify the source of infection of 147 C. coli strains from French clinical cases. Using STRUCTURE software, 259 potential host-segregating markers were revealed by probabilistic characterization of single-nucleotide polymorphism (SNP) frequency variation in strain collections from three different hosts. These SNPs were found in 41 genes or intergenic regions, mostly coding for proteins involved in motility and membrane functions. Source attribution of clinical isolates based on the differential presence of these markers confirmed chickens as the most common source of C. coli infection in France.IMPORTANCE Genome-wide and source attribution studies based on Campylobacter species have shown their importance for the understanding of foodborne infections. Although the use of multilocus sequence typing based on 7 genes from C. jejuni is a powerful method to structure populations, when applied to C. coli, results have not clearly demonstrated its robustness. Therefore, we aim to provide more accurate data based on the identification of single-nucleotide polymorphisms. Results from this study reveal an important number of host-segregating SNPs, found in proteins involved in motility, membrane functions, or DNA repair systems. These findings offer new, interesting opportunities for further study of C. coli adaptation to its environment. Additionally, the results demonstrate that poultry is potentially the main reservoir of C. coli in France.

Keywords: Campylobacter coli; SNP; genomics; genotyping; source attribution.


Figures

FIG 1
FIG 1
Phylogenic tree based on MLST analysis. The minimum spanning tree was generated using GrapeTree from the sequence types of all 896 C. coli isolates, based on 7 MLST genes (aspA, glnA, gltA, glyA, pgm, tkt, and uncA) extracted using the PubMLST platform. Orange represents isolates isolated from chickens, green from cattle, and magenta from pigs. Red is for clinical isolates. Circle sizes are proportional to the number of isolates, and the scale bar represents a genetic distance of 1.
FIG 2
FIG 2
Phylogenic tree built from concatenated selected SNPs. The tree was designed using maximum-likelihood phylogeny between 896 isolate sequences built from the concatenation of all genotypes of the selected SNPs (n = 259). Orange nodes are the chicken population isolates, green nodes are cattle isolates, pink nodes are pig isolates, and red nodes are clinical isolates. The orange circle shows an estimation of the chicken cluster, the green circle shows the cattle cluster, and the pink circle shows the pig cluster. The scale bar represents a genetic distance of 0.24. Clinical isolates are located mostly within the chicken cluster, which is consistent with the probabilistic attribution model.
FIG 3
FIG 3
Host-segregating rate of all variants obtained from the alignment of 450 marker determination isolates against 3 references. Source attribution rates (y axes) were obtained by testing 26,131, 24,395, and 20,827 SNPs from OR12 (a), HC2-48 (b), and ZV1224 (c) references, respectively, and are shown here according to their genome position (left, x axis) and variant proportions (right, x axis). STRUCTURE software was run 3 times for each SNP (average attribution rates are shown here), using 390 randomly selected C. coli isolates as the training data set and 60 randomly selected isolates as the test data set. Orange represents attribution rates and the number of SNPs for chicken source, green for cattle source, and magenta for pig source. A total of 259 SNPs showed attribution rates greater than 70% (red line) for one or more sources and were carried forward for further analyses: 43, 183, and 33 SNPs from chicken, cattle, and pig references, respectively. Scores fluctuated between 30% and 40%, and the highest attribution rates for each host reservoir were found in the corresponding source reference. However, the OR12 reference showed two distinct regions of the genome, one part containing variants discriminating the chicken source and another part the pig source. Two low-variability regions (blanks), where no SNPs from the variant calling step were selected, are also visible.
FIG 4
FIG 4
Correct reattribution proportions of 299 validation isolates using determined SNPs and MLST genes. (a and b) Source attribution strength of selected SNPs (a) and MLST genes (b) estimated using STRUCTURE software. A total of 299 isolates were tested (from the validation data set) using marker determination isolates for training (n = 450). Source attributions were performed 10 times using all selected SNPs (n = 259) and MLST genes (n = 7). Gray bars represent the rate of correct source attribution for chicken population isolates, black bars for cattle isolates, and white bars for pig isolates. An isolate was considered correctly source reattributed with a STRUCTURE score greater than 70%.
FIG 5
FIG 5
Population proportions of clinical isolates from source attribution. (a and b) Source attribution of the clinical data set using selected SNPs (n = 259) (a) and MLST genes (n = 7) (b). Clinical isolates (n = 147) are represented on the x axis and their attribution probabilities on the y axis in orange for chicken source, green for cattle source, and pink for pig source. The poultry reservoir was estimated as the main source of C. coli contamination in France, with 138 isolates (94%) attributed using host-segregating SNPs and 89 isolates (61%) using MLST (isolates selected with source probabilities of greater than 70%).

References

    1. Blaser MJ. 1997. Epidemiologic and clinical features of Campylobacter jejuni infections. J Infect Dis 176(Suppl 2):S103–S105. doi:10.1086/513780. - DOI - PubMed
    1. Scallan E, Griffin PM, Angulo FJ, Tauxe RV, Hoekstra RM. 2011. Foodborne illness acquired in the United States–unspecified agents. Emerg Infect Dis 17:16–22. doi:10.3201/eid1701.p21101. - DOI - PMC - PubMed
    1. European Food Safety Authority and European Centre for Disease Prevention and Control. 2018. The European Union summary report on trends and sources of zoonoses, zoonotic agents and food-borne outbreaks in 2017. EFSA J 16:e05500. doi:10.2903/j.efsa.2018.5500. - DOI - PMC - PubMed
    1. Van Cauteren D, Le Strat Y, Sommen C, Bruyand M, Tourdjman M, Da Silva NJ, Couturier E, Fournet N, de Valk H, Desenclos J-C. 2017. Estimated annual numbers of foodborne pathogen-associated illnesses, hospitalizations, and deaths, France, 2008–2013. Emerg Infect Dis 23:1486–1492. doi:10.3201/eid2309.170081. - DOI - PMC - PubMed
    1. Horrocks SM, Anderson RC, Nisbet DJ, Ricke SC. 2009. Incidence and ecology of Campylobacter jejuni and coli in animals. Anaerobe 15:18–25. doi:10.1016/j.anaerobe.2008.09.001. - DOI - PubMed

Publication types