. 2021 Jun;70(6):1023-1036.
doi: 10.1136/gutjnl-2020-321731. Epub 2020 Oct 9.

Deconvolution of monocyte responses in inflammatory bowel disease reveals an IL-1 cytokine network that regulates IL-23 in genetic and acquired IL-10 resistance

Affiliations

Deconvolution of monocyte responses in inflammatory bowel disease reveals an IL-1 cytokine network that regulates IL-23 in genetic and acquired IL-10 resistance

Dominik Aschenbrenner et al. Gut. 2021 Jun.

Abstract

Objective: Dysregulated immune responses are the cause of IBDs. Studies in mice and humans suggest a central role of interleukin (IL)-23-producing mononuclear phagocytes in disease pathogenesis. Mechanistic insights into the regulation of IL-23 are prerequisite for selective IL-23 targeting therapies as part of personalised medicine.

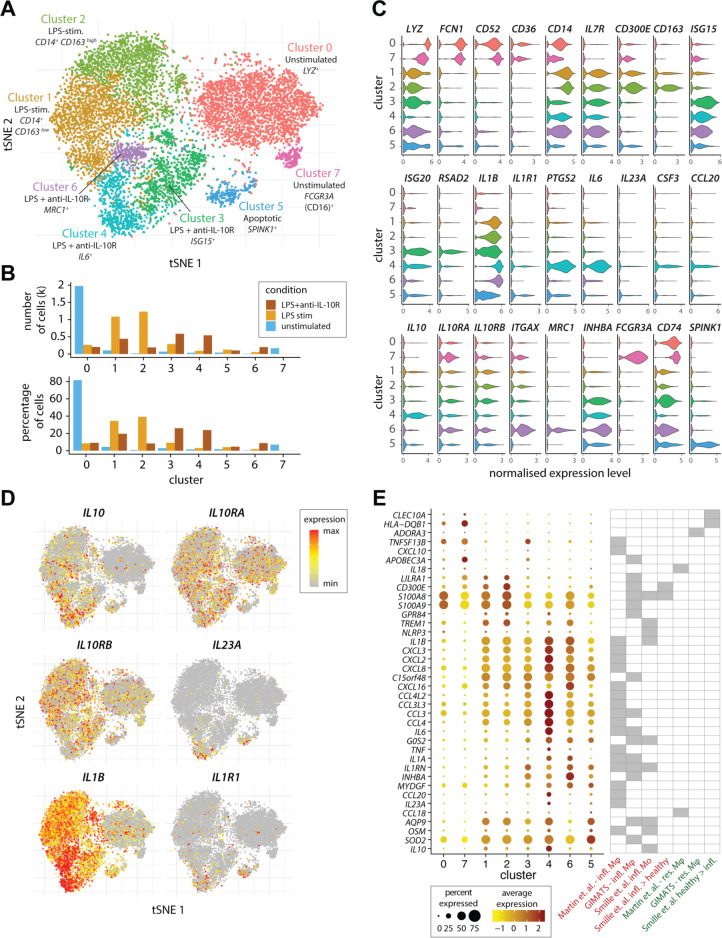
Design: We performed transcriptomic analysis to investigate IL-23 expression in human mononuclear phagocytes and peripheral blood mononuclear cells. We investigated the regulation of IL-23 expression and used single-cell RNA sequencing to derive a transcriptomic signature of hyperinflammatory monocytes. Using gene network correlation analysis, we deconvolved this signature into components associated with homeostasis and inflammation in patient biopsy samples.

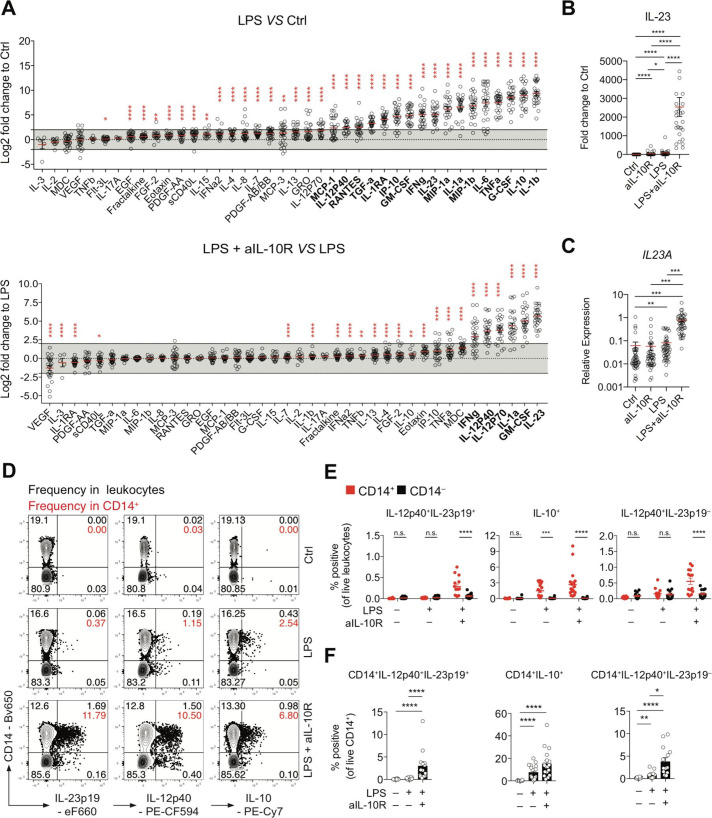
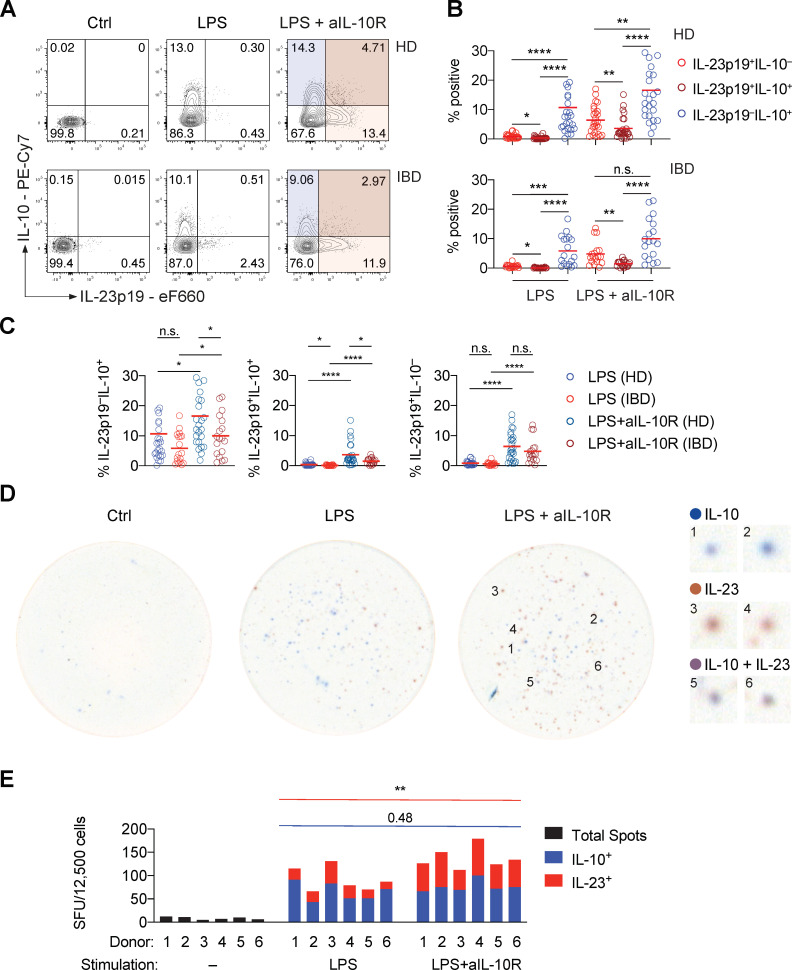
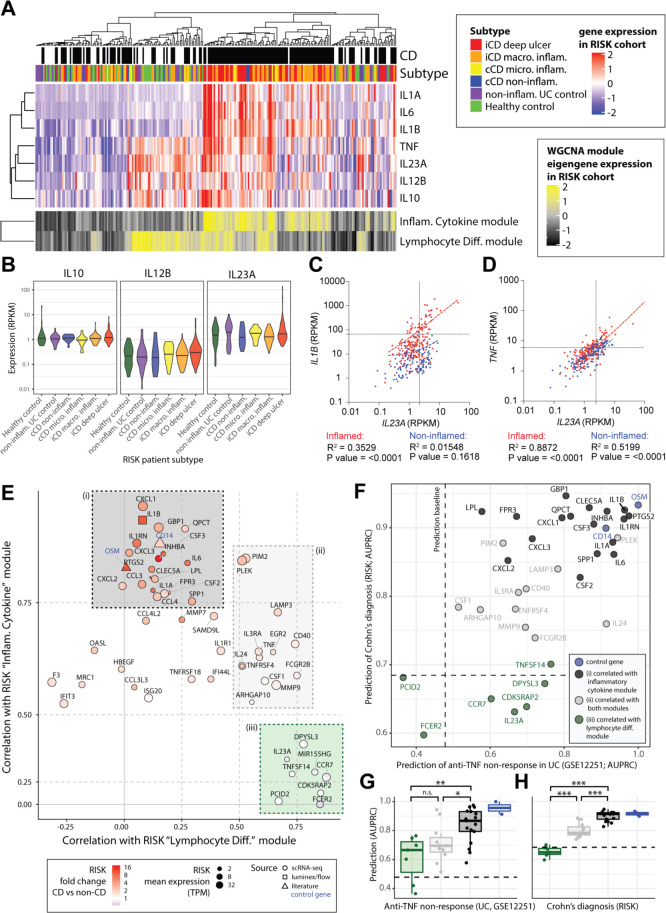
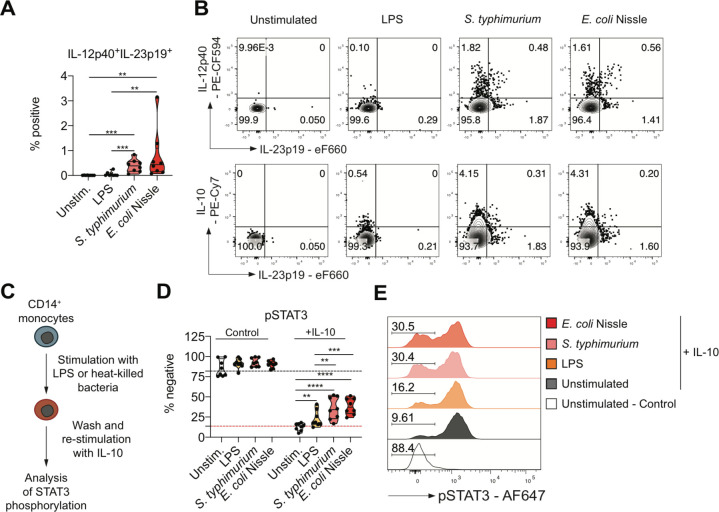
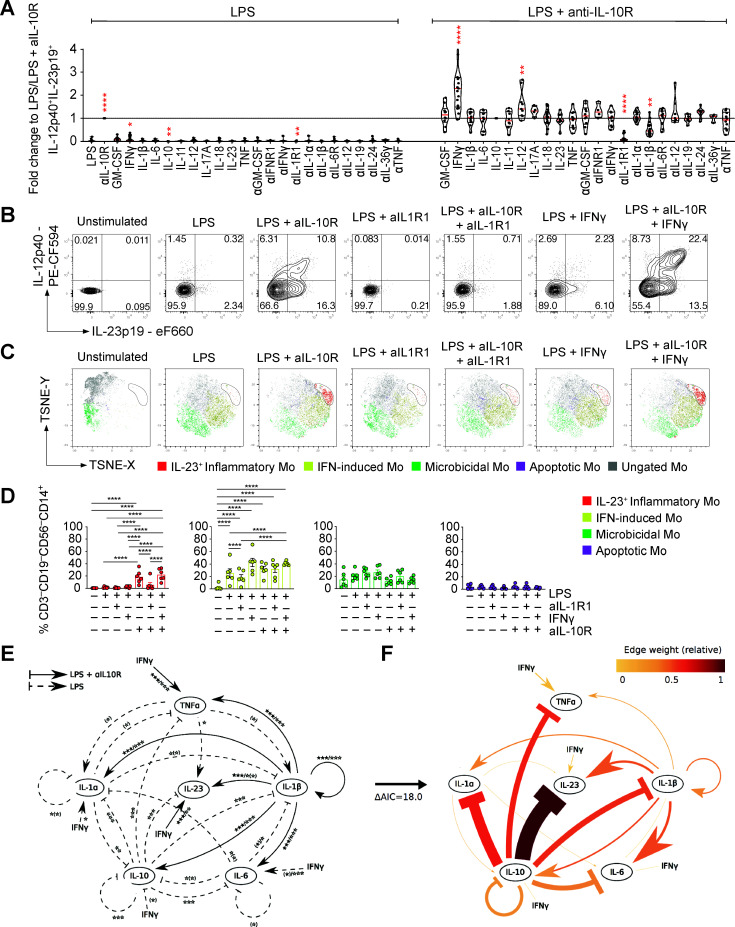
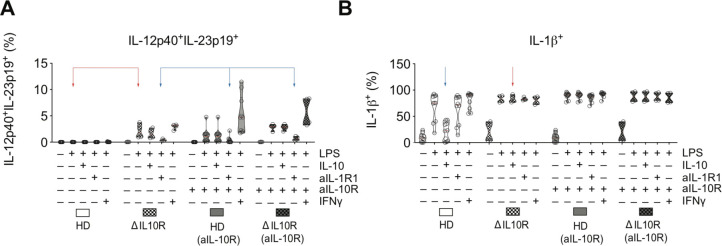
Results: We characterised monocyte subsets of healthy individuals and patients with IBD that express IL-23. We identified autosensing and paracrine sensing of IL-1α/IL-1β and IL-10 as key cytokines that control IL-23-producing monocytes. Whereas Mendelian genetic defects in IL-10 receptor signalling induced IL-23 secretion after lipopolysaccharide stimulation, whole bacteria exposure induced IL-23 production in controls via acquired IL-10 signalling resistance. We found a transcriptional signature of IL-23-producing inflammatory monocytes that predicted both disease and resistance to antitumour necrosis factor (TNF) therapy and differentiated that from an IL-23-associated lymphocyte differentiation signature that was present in homeostasis and in disease.

Conclusion: Our work identifies IL-10 and IL-1 as critical regulators of monocyte IL-23 production. We differentiate homeostatic IL-23 production from hyperinflammation-associated IL-23 production in patients with severe ulcerating active Crohn's disease and anti-TNF treatment non-responsiveness. Altogether, we identify subgroups of patients with IBD that might benefit from IL-23p19 and/or IL-1α/IL-1β-targeting therapies upstream of IL-23.

Keywords: inflammatory bowel disease; interleukins; mucosal immunology.


Conflict of interest statement

Competing interests: BS, SH, KC and JS are current or previous employees of Eli Lilly. HU received research support or consultancy fees from UCB Pharma, Eli Lilly, Boehringer Ingelheim, Pfizer, Celgene, OMass and AbVie. FP has received research support or consultancy fees from GSK, UCB Pharma, Medimmune, Janssen and Eli Lilly. SPLT has been adviser to, in receipt of educational or research grants from, or invited lecturer for AbbVie, Amgen, Asahi, Biogen, Boehringer Ingelheim, BMS, Cosmo, Elan, Enterome, Ferring, FPRT Bio, Genentech/Roche, Genzyme, Glenmark, GW Pharmaceuticals, Janssen, Johnson & Johnson, Eli Lilly, Merck, Novartis, Novo Nordisk, Ocera, Pfizer, Shire, Santarus, SigmoidPharma, Synthon, Takeda, Tillotts, Topivert, Trino Therapeutics with Wellcome Trust, UCB Pharma, Vertex, VHsquared, Vifor, Warner Chilcott and Zeria. SK has received consultancy fees from Janssen and Takeda.

Figures

Figure 1
Figure 1
IL-10 regulates IL23A transcription and IL-23 protein secretion in a subset of monocytes from patients with IBD. (A) Analysis of PBMC culture supernatants collected after 16 hours of stimulation with LPS±IL-10R blocking antibodies expressed as log2 fold change to unstimulated PBMC (Ctrl) or LPS-stimulated PBMC (n=28; mean±SEM; Wilcoxon test, BH-adjusted p values). (B) IL-23 protein concentrations in culture supernatants expressed as fold change to unstimulated PBMC (n=28; mean±SEM; Friedman test with FDR-adjusted p values). (C) RT-qPCR analysis of relative IL23A expression in PBMC following 16 hours of stimulation (n=45; mean±SEM; Kruskal-Wallis test, BH-adjusted p values). (D) Contour plot presentation of IL-23p19-producing, IL-12p40-producing and IL-10-producing live leukocytes and CD14 surface expression measured at 16 hours poststimulation in PBMC. (E) Frequencies of IL-12p40+IL-23p19+, IL-10+ and IL-12p40+IL-23p19 CD14+ and CD14 cells in total live leukocytes (n=18, mean±SEM, Mann-Whitney test). (F) Frequencies of IL-12p40+IL-23p19+, IL-10+ and IL-12p40+IL-23p19 of CD14+ cells (n=18, mean±SEM, Mann-Whitney test). BH, Benjamini-Hochberg; Ctrl, control; EGF, epidermal growth factor; FDR, false discovery rate; G-CSF, granulocyte-colony stimulating factor; IL, interleukin; LPS, lipopolysaccharide; MDC, macrophage-derived chemokine (CCL22); n.s., not significant; PBMC, peripheral blood mononuclear cells; RANTES, regulated upon activation - normal T cell expressed and presumably secreted (CCL5); RT-qPCR, real-time quantitative PCR; TNF, tumour necrosis factor. *pvalue 0.05, **pvalue<0.01, ***pvalue<0.001, ****pvalue<0.0001.
Figure 2
Figure 2
Single-cell RNA sequencing identifies subsets of inflammatory monocytes. (A) The tSNE plot shows the subpopulations of unstimulated, LPS-stimulated and combined LPS and anti-IL-10R-stimulated monocytes that were identified by a graph-based clustering approach following cross-condition alignment with Harmony (for details please see the online supplemetary materials and supplementary references61) (B) Bar plots show the number and frequency of cells in each of the identified clusters among three stimulation conditions in each of the identified clusters. (C) The violin plots show expression (x-axis) of genes characteristic of the identified monocyte clusters (y-axis). (D) Expression of IL10, IL10RA, IL10RB, IL23A, IL1B and IL1R1 across the single monocytes according to (A). (E) The dot plot shows the expression of genes associated with Mo and Mφ in single-cell studies of CD (Martin et al) and UC (Smille et al) in the identified clusters of single cells (A). The genes shown were previously identified as characteristic of inflammatory macrophages in CD (‘Martin et al infl. Mφ’) or in anti-TNF-resistant CD (‘GIMATS–infl. Mφ’), as characteristic of inflammatory monocytes (‘Smille et al infl. Mo’) or higher in monocytes from inflamed versus healthy tissue (‘Smille et al infl.>healthy’) in UC, as characteristic of resident intestinal Mφ in the context of CD (‘Martin et al.–res. Mφ’ and ‘GIMATS–res. Mφ’), or more highly expressed in healthy than diseased tissue in the context of UC (‘Smille et al healthy>infl.’). For further details, please see the Methods section. CD, Crohn’s disease; GIMATS, IgG plasma cells - inflammatory mononuclear phagocytes - activated T cells - stromal cells; IL, interleukin; LPS, lipopolysaccharide; Mφ, macrophages; Mo, monocyte; TNF, tumour necrosis factor; tSNE, t-distributed stochastic neighbour embedding.
Figure 3
Figure 3
The monocyte response to PRR stimulation is heterogeneous, revealing a paracrine mechanism of IL-10-depedent regulation of IL-23 production. (A) Representative contour plot presentation showing IL-23p19+ and IL-10+ frequencies in monocytes derived from a healthy donor and a patient with IBD at 16 hours poststimulation. (B) IL-23p19+IL-10, IL-23p19+IL-10+ and IL-23p19IL-10+ monocyte frequencies at 16 hours poststimulation (HD: n=26, IBD: n=18; mean±SEM; Friedman test with FDR-adjusted p values). (C) Monocyte cytokine frequencies according to (A) and (B), comparing patient subgroups and stimulation conditions (HD: n=26, IBD: n=18; mean±SEM, Mann-Whitney test). (D) Representative dual-colour ELISpot images showing non-stimulated, LPS-stimulated and combined LPS and anti-IL-10R-stimulated monocyte IL-10 secretion (blue), IL-12p40+IL-23p19+ secretion (red) and combined production of both cytokines (violet/brown). Numbered magnifications of distinct spots detected in the LPS+anti-IL-10R-stimulated condition are shown on the right. (E) Dual-colour ELISpot counts from three independent experiments (n=6, Mann-Whitney test). Ctrl, control; FDR, false discovery rate; IL, interleukin; n.s., not significant; LPS, lipopolysaccharide; SFU, spot forming units. *pvalue<0.05, **pvalue<0.01, ***pvalue<0.001, ****pvalue<0.0001.
Figure 4
Figure 4
An IL-10-regulated inflammatory monocyte gene signature informs IL-23 and IL-1 targeting therapeutic approaches in IBD. (A) Patients of the RISK cohort (diagnosis and subtype as shown in top panels) were clustered according to the expression of 22 modules of coexpressed genes (see online supplemental figure 7A). The upper heatmap shows expression of key cytokines across the cohort. The lower panel shows expression of the eigengenes of two of the identified modules of coexpressed genes. (B) The expression of IL10, IL12B and IL23A within the different patient strata of the RISK cohort. (C, D) Correlation of IL23A with IL1B (C) and IL23A with TNF (D) in the inflamed (red) and non-inflamed (blue) CD patient biopsies of the RISK cohort. (E) Correlation of genes specific to LPS and anti-IL-10R-stimulated monocytes with the ‘inflammatory cytokine’ and ‘lymphocyte differentiation’ gene modules in the RISK cohort data identifies three subsets (shaded (i) black, (II) grey and (III) green boxes). (F) Assessment of the ability of the identified monocyte genes to predict anti-TNF non-response (x-axis, GSE12251) and diagnosis of Crohn’s (y-axis, RISK cohort). The dashed lines indicate random classifier performance. (G, H) Comparison of the ability of the identified subsets of monocyte genes to predict TNF non-response (GSE12251) and diagnosis of CD in the RISK cohort (Wilcoxon tests, colours as shown in panels E, F). AUPRC, area under precision recall curve; CD, Crohn’s disease; IL, interleukin; LPS, lipopolysaccharide; n.s., not significant; RISK, Risk Stratification and Identification of Immunogenetic and Microbial Markers of Rapid Disease Progression in Children with Crohn’s Disease study; TNF, tumour necrosis factor; WGCNA, weighted gene correlation network analysis. *pvalue<0.05, **pvalue<0.01, ***pvalue<0.001, ****pvalue<0.0001.
Figure 5
Figure 5
Monocyte stimulation with whole bacteria causes IL-10 resistance and IL-23 secretion. (A) Frequencies of IL-12p40+IL-23p19+ in live CD14+ at 16 hours following stimulation (n=8; mean±SEM, Mann-Whitney test). (B) Dot plots showing IL-12p40, IL-23p19 and IL-10 in live CD14+ monocytes from a healthy donor. (C) Scheme for the assessment of monocyte IL-10 responsiveness. (D) Frequencies of phospho-STAT3 live monocytes without cytokine stimulation (control) and following 15 min IL-10 (50 ng/µL) stimulation (n=8; mean±SEM, Mann-Whitney test). (E) Representative histograms showing phosphorylation of STAT3 in non-treated (control) or IL-10-treated (+IL-10) live monocytes. Percentages of IL-10 stimulation-resistant monocytes are indicated. IL, interleukin; LPS, lipopolysaccharide. *pvalue<0.05, **pvalue<0.01, ***pvalue<0.001, ****pvalue<0.0001.
Figure 6
Figure 6
IL-1α and IL-1β signalling are essential for monocyte IL-23 production. PBMC from healthy donors (n>4) were stimulated for 16 hours with combinations of LPS and aIL-10R in the presence of indicated exogenous human recombinant cytokine (all 10 ng/mL) and/or cytokine/cytokine receptor blockade (all antibodies 10 µg/mL). (A) Frequencies of IL-12p40+IL-23p19+ live CD14+ monocytes (Wilcoxon test, 95% CI). (B) Representative dot plot showing intracellular IL-12p40 and IL-23p19 according to (A). (C) tSNE presentation of IL-23p19, CCL20, HLA-DR, IDO-1, CCL2, S100A8, RPS6 and SPINK-1 expression in live CD14+CD3CD19CD56-gated monocytes. Analyses of three healthy donors are shown as overlay. (D) Frequencies of monocyte clusters across stimulations based on cluster-specifying protein expression (n=6; one-way analysis of variance after BH correction). (E) The extensive model represents the effects of the addition or blockade of cytokines in a PBMC culture in the presence of LPS or LPS and anti-IL-10R. Differences of cytokine addition or blockade in LPS-stimulated samples (dashed arrows), in LPS and anti-IL-10R-stimulated samples (solid arrows) and in LPS and anti-IL-10R-stimulated and anti- IL-1β treated conditions (dotted arrows). Nominal effects with p>0.05 after false discovery rate correction (BH) are shown in parentheses. (F) A reduced complexity model was established by focusing on informative cytokine interactions. Edge weights are defined as the relative contribution to model fit and are dependent on the network configuration considered. The edges of the 20-edge model have been coloured based on their weight. BH, Benjamini-Hochberg; IFN, interferon; IL, interleukin; LPS, lipopolysaccharide; PBMC, peripheral blood mononuclear cells; TNF, tumour necrosis factor.
Figure 7
Figure 7
Monocyte IL-23 responses in patients with loss of function in IL-10R1 and IL-10R2. (A) Frequencies of IL-12p40+IL-23p19+ and IL-1β+ monocytes in PBMC from healthy donors and two patients with IL-10R variants (IL10RA (p.R117H) and IL10RB (p.Y167C)) following 16 hours of stimulation with combinations of LPS (200 ng/mL), IL-10 (10 ng/mL), anti-IL-10R (10 µg/mL), anti-IL-1R1(10 µg/mL) and IFN-γ (10 ng/mL). IFN, interferon; IL, interleukin; LPS, lipopolysaccharide; PBMC, peripheral blood mononuclear cells.

References

    1. Uhlig HH, Powrie F. Translating immunology into therapeutic concepts for inflammatory bowel disease. Annu Rev Immunol 2018;36:755–81. 10.1146/annurev-immunol-042617-053055 - DOI - PubMed
    1. Mirkov MU, Verstockt B, Cleynen I. Genetics of inflammatory bowel disease: beyond NOD2. Lancet Gastroenterol Hepatol 2017;2:224–34. 10.1016/S2468-1253(16)30111-X - DOI - PubMed
    1. Duerr RH, Taylor KD, Brant SR, et al. . A genome-wide association study identifies IL23R as an inflammatory bowel disease gene. Science 2006;314:1461–3. 10.1126/science.1135245 - DOI - PMC - PubMed
    1. Jostins L, Ripke S, Weersma RK, et al. . Host-Microbe interactions have shaped the genetic architecture of inflammatory bowel disease. Nature 2012;491:119–24. 10.1038/nature11582 - DOI - PMC - PubMed
    1. de Lange KM, Moutsianas L, Lee JC, et al. . Genome-Wide association study implicates immune activation of multiple integrin genes in inflammatory bowel disease. Nat Genet 2017;49:256–61. 10.1038/ng.3760 - DOI - PMC - PubMed

Publication types

MeSH terms