. 2020 Dec 11;295(50):17281-17297.
doi: 10.1074/jbc.RA120.015489. Epub 2020 Oct 9.

Leptin modulates pancreatic β-cell membrane potential through Src kinase-mediated phosphorylation of NMDA receptors

Affiliations

Leptin modulates pancreatic β-cell membrane potential through Src kinase-mediated phosphorylation of NMDA receptors

Veronica A Cochrane et al. J Biol Chem. .

Abstract

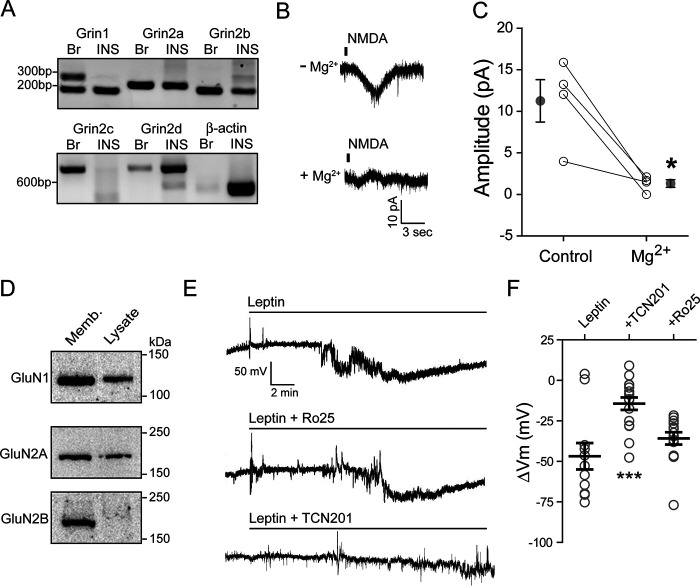
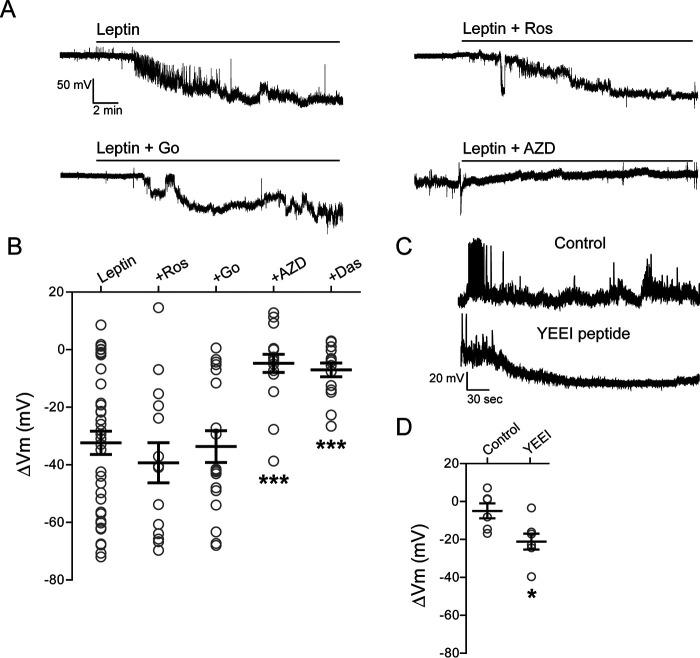
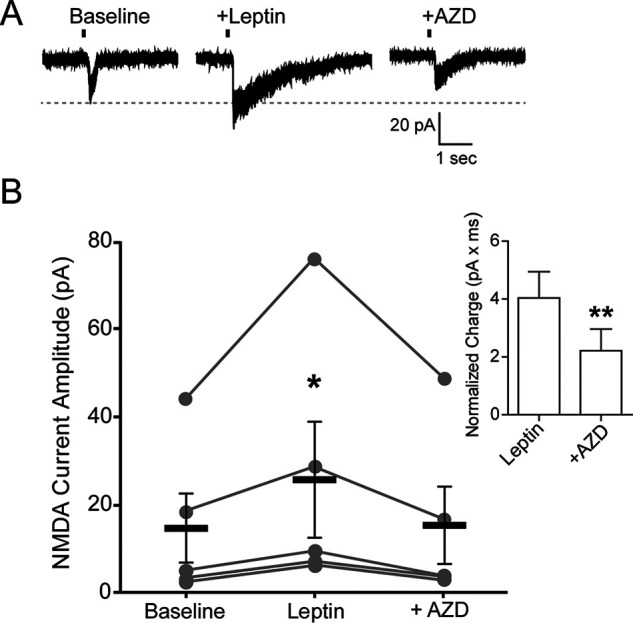
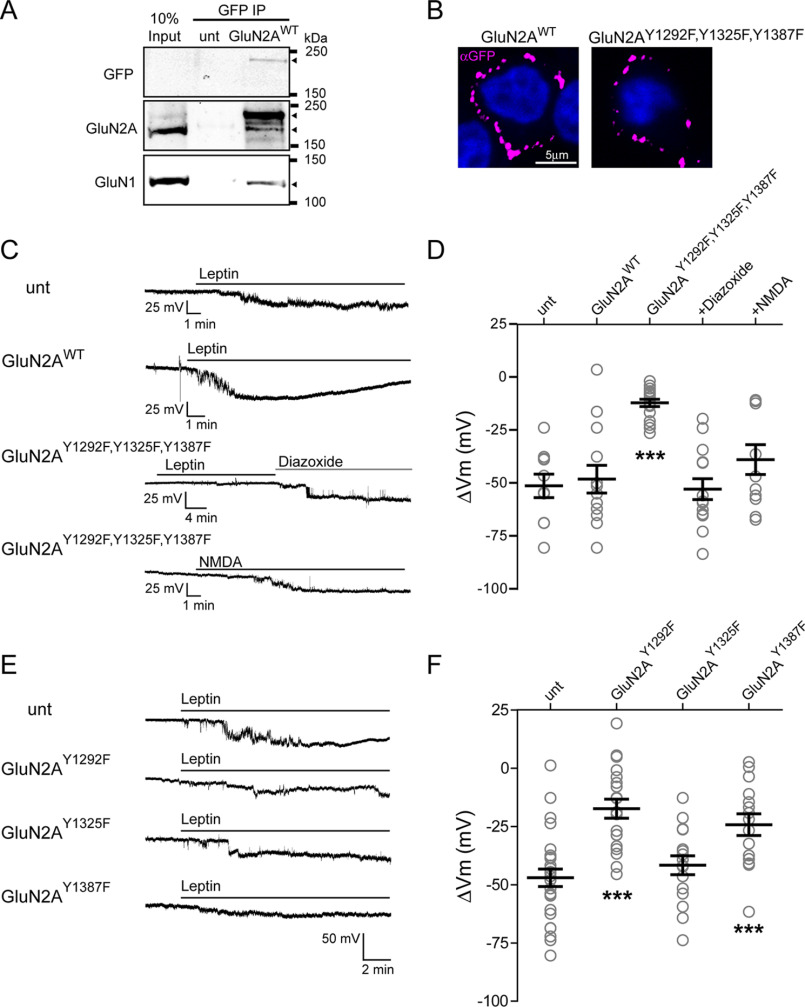
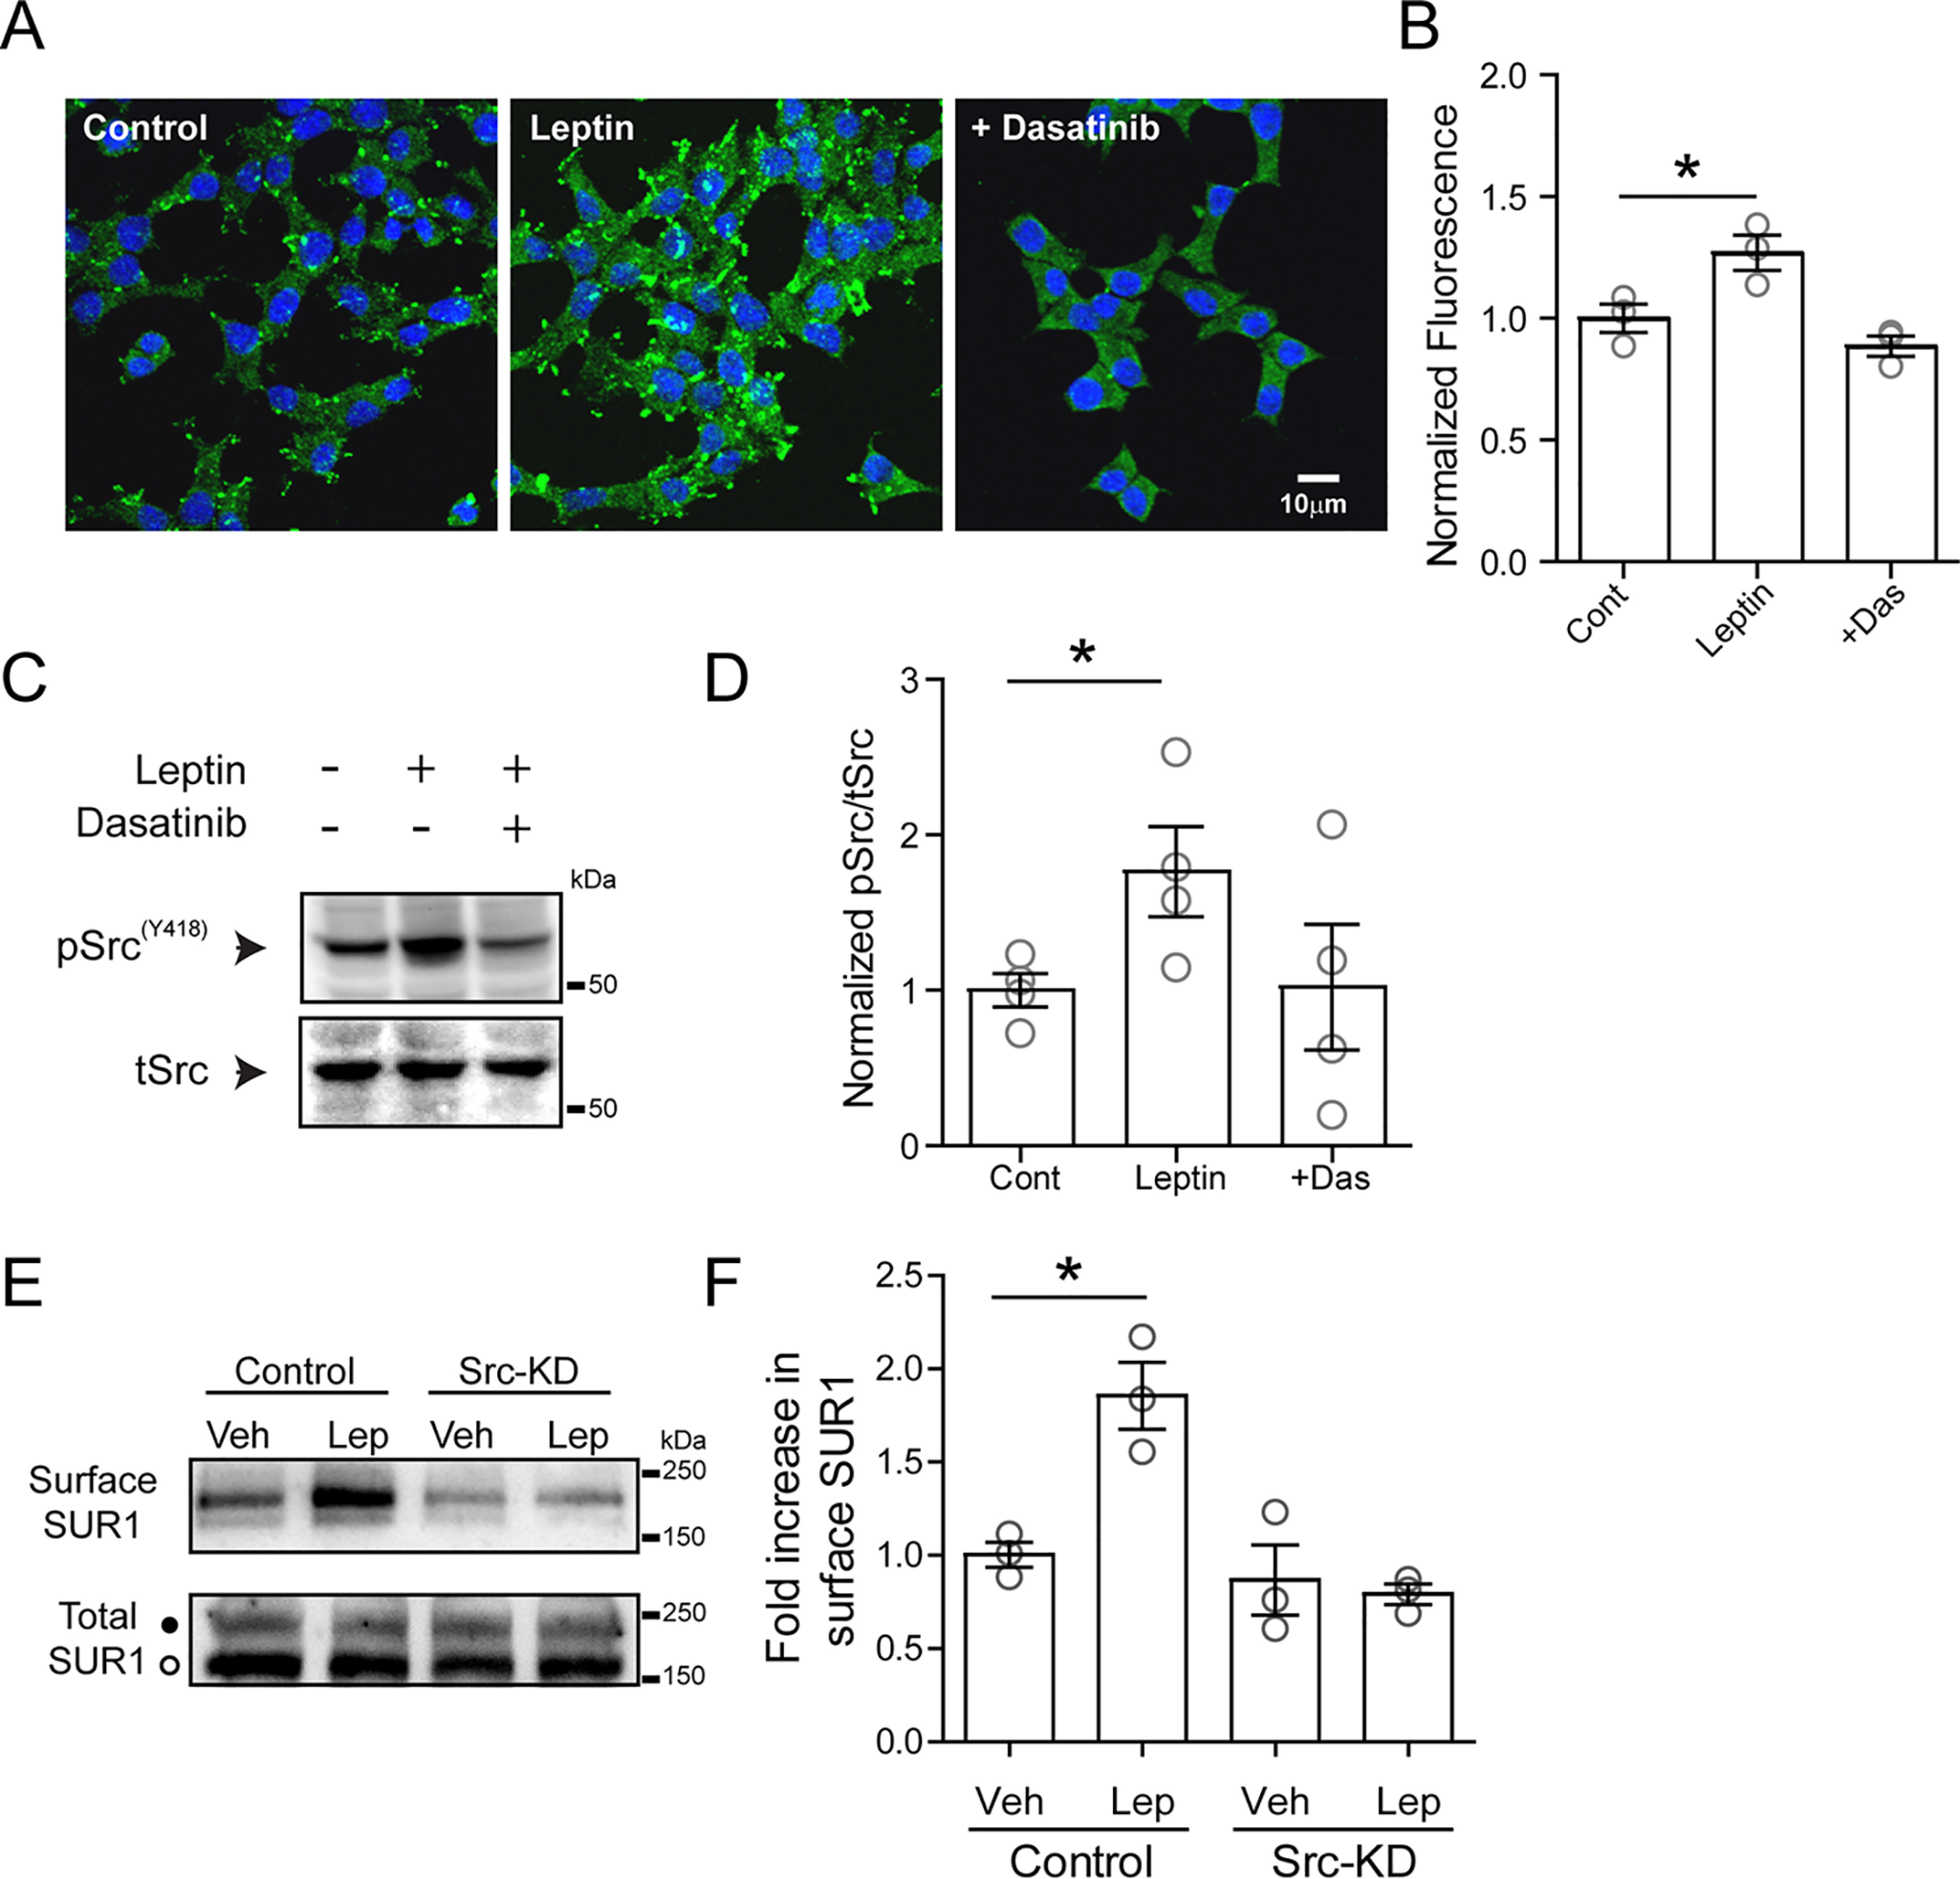
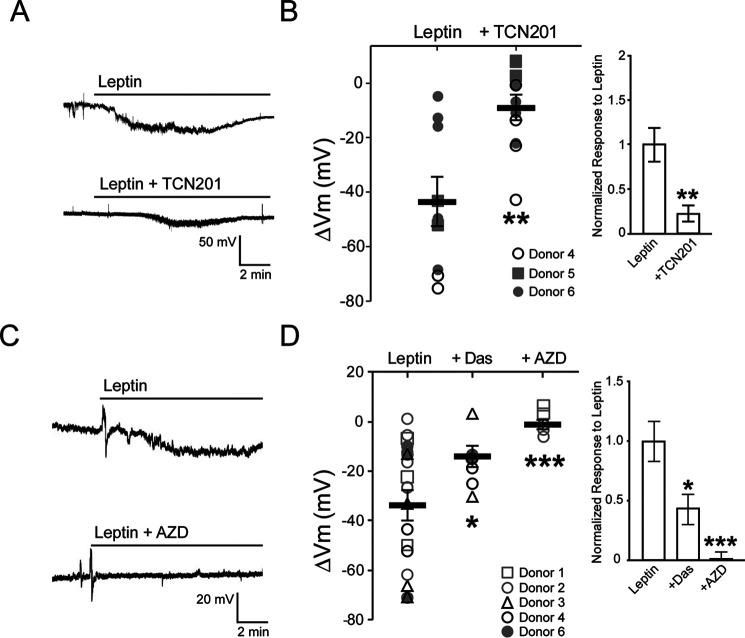
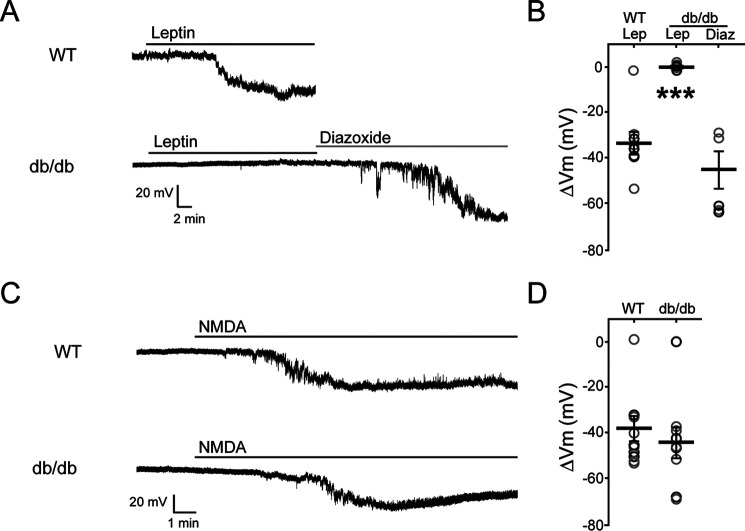
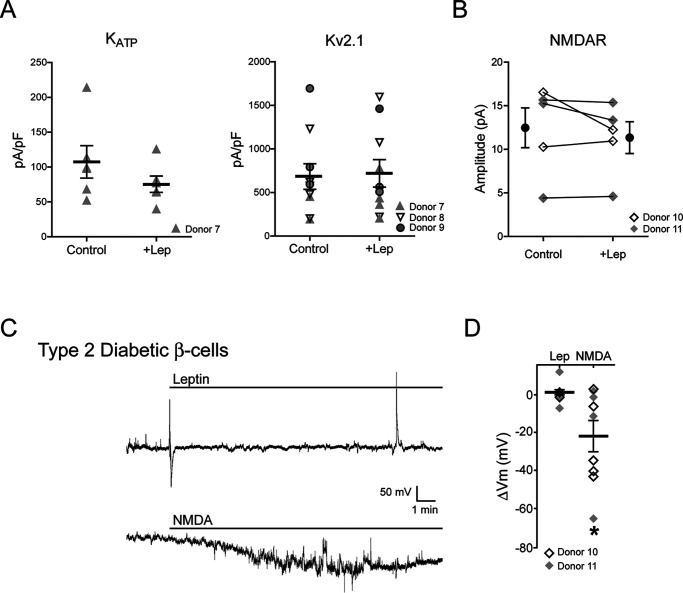
The adipocyte-derived hormone leptin increases trafficking of KATP and Kv2.1 channels to the pancreatic β-cell surface, resulting in membrane hyperpolarization and suppression of insulin secretion. We have previously shown that this effect of leptin is mediated by the NMDA subtype of glutamate receptors (NMDARs). It does so by potentiating NMDAR activity, thus enhancing Ca2+ influx and the ensuing downstream signaling events that drive channel trafficking to the cell surface. However, the molecular mechanism by which leptin potentiates NMDARs in β-cells remains unknown. Here, we report that leptin augments NMDAR function via Src kinase-mediated phosphorylation of the GluN2A subunit. Leptin-induced membrane hyperpolarization diminished upon pharmacological inhibition of GluN2A but not GluN2B, indicating involvement of GluN2A-containing NMDARs. GluN2A harbors tyrosine residues that, when phosphorylated by Src family kinases, potentiate NMDAR activity. We found that leptin increases phosphorylation of Tyr-418 in Src, an indicator of kinase activation. Pharmacological inhibition of Src or overexpression of a kinase-dead Src mutant prevented the effect of leptin, whereas a Src kinase activator peptide mimicked it. Using mutant GluN2A overexpression, we show that Tyr-1292 and Tyr-1387 but not Tyr-1325 are responsible for the effect of leptin. Importantly, β-cells from db/db mice, a type 2 diabetes mouse model lacking functional leptin receptors, or from obese diabetic human donors failed to respond to leptin but hyperpolarized in response to NMDA. Our study reveals a signaling pathway wherein leptin modulates NMDARs via Src to regulate β-cell excitability and suggests NMDARs as a potential target to overcome leptin resistance.

Keywords: GluN2A; KATP channel; Src; Src kinase; beta cell (B-cell); glutamate receptor; phosphorylation; type 2 diabetes; β-cells.


Conflict of interest statement

Conflict of interest—The authors declare that they have no conflicts of interest with the contents of this article.

Figures

Figure 1.
Figure 1.
Leptin induces membrane hyperpolarization through GluN2A-containing NMDARs. A, RT-PCR detection of mRNA for NMDAR subunits, GluN1 (Grin1), GluN2A (Grin2a), GluN2B (Grin2b), GluN2C (Grin2c), and GluN2D (Grin2d), in rat brain (Br) and INS-1 832/13 cells (INS). β-Actin was included as a control. B, representative traces of NMDAR currents in the absence (top) or presence (bottom) of 100 μm Mg2+. C, sensitivity of NMDA currents (elicited by puff application of 1 mm NMDA) to Mg2+ block. Averaged current amplitudes before (control) and after 100 μm Mg2+ for each cell are connected by a straight line. Mean ± S.E. values for each group are shown next to individual data points. *, p < 0.05 by paired t test. D, Western blots showing protein expression of GluN1, GluN2A, and GluN2B from INS-1 832/13 cell membrane fraction (Memb; 30 µg) and total cell lysate (Lysate; 30 µg). E, individual cell-attached membrane recordings from INS-1 832/13 cells treated with leptin (10 nm) alone (top), with leptin plus the GluN2B inhibitor Ro 25-6981 (middle; Ro25, 1 μm), or with leptin plus the GluN2A inhibitor TCN201 (bottom; 50 μm). F, group data showing the degree of membrane hyperpolarization in mV for leptin alone (n = 11 cells) or leptin co-applied with Ro 25-6981 (n = 14 cells) or TCN201 (n = 16 cells). Here and in subsequent figures, individual cells are represented by symbols and means are indicated by a black line. Error bars, S.E. ***, p < 0.0005 by unpaired t test as compared with leptin.
Figure 2.
Figure 2.
Leptin regulates NMDAR activity via Src family kinases. A, representative cell-attached current-clamp recordings from INS-1 832/13 cells treated with leptin (10 nm) alone (top left) or leptin with the PKC inhibitor Go 6983 (bottom left; Go, 10 μm), the CDK5 inhibitor roscovitine (top right; Ros, 10 μm), or the SFK inhibitor AZD (bottom right; 10 μm). Inhibitors were applied for 10 min prior to the application of leptin and remained in the solution throughout the recording. B, group data showing extent of membrane hyperpolarization for leptin alone (n = 40 cells), and leptin co-applied with roscovitine (Ros, n = 14), Go 6983 (n = 18), AZD (n = 17), or dasatinib (Das, 25 μm; n = 15). ***, p < 0.0005 by unpaired t test as compared with leptin. C, representative whole-cell current-clamp recordings of INS-1 832/13 cells without (top trace) or with (bottom trace) the Src kinase–activating peptide YEEI (1 μm) in the pipette solution. D, group data showing the degree of hyperpolarization for control (n = 6) and YEEI peptide (n = 7). *, p < 0.05, unpaired t test as compared with control.
Figure 3.
Figure 3.
Leptin potentiation of NMDAR currents is prevented by inhibition of Src kinases. A, example of whole-cell currents from a single INS-1 832/13 cell induced by puff application of NMDA (1 mm; vertical line indicates time of puff) during baseline, 5 min after leptin, and following wash-in of AZD (10 μm AZD0350) in the presence of leptin for 5 min. B, within-cell group data showing amplitude of NMDAR currents for each condition (n = 5 cells). Means for each condition are depicted as thick black lines ± S.E. (error bars). Statistical analysis was conducted using Friedman's test (p = 0.0239) followed by a post hoc Dunn's multiple-comparison test with significance set to p < 0.05 (*), as compared with baseline. Inset, comparison of total charge (pA × ms) observed for each NMDA puff between leptin and leptin + AZD treatments normalized to baseline. **, p < 0.005, paired Student's t test as compared with leptin.
Figure 4.
Figure 4.
Leptin-induced membrane hyperpolarization requires phosphorylation of GluN2A Tyr-1292 and Tyr-1387 but not Tyr-1325. A, immunoprecipitation of GFP-GluN2A with anti-GFP followed by immunoblotting using anti-GFP, anti-GluN2A, or anti-GluN1 antibodies showing association of endogenous GluN2A and GluN1 with transfected GFP-GluN2A. Arrowheads next to the blots indicate protein bands corresponding to GFP-GluN2AWT (top blot), GFP-GluN2AWT (top arrowhead) and endogenous GluN2A (bottom arrowhead, middle blot), and GluN1 (bottom blot). B, surface staining using anti-GFP antibody showing plasma membrane expression of GFP-GluN2AWT and GFP-GluN2AY1292F,Y1325F,Y1387F. C, representative INS-1 832/13 cell-attached current-clamp recordings from an untransfected cell (unt) or a cell transfected with GluN2AWT treated with leptin (10 nm) or cells transfected with GluN2AY1292F,Y1325F,Y1387F and treated with leptin followed by the KATP channel activator diazoxide (200 μm) or with NMDA (50 μm). All GluN2A constructs in this and subsequent panels contain an N-terminal GFP tag. D, group data showing the degree of hyperpolarization induced by leptin in untransfected cells (n = 10), cells transfected with GluN2AWT (n = 13), and cells transfected with GluN2AY1292F,Y1325F,Y1387F (n = 18) with subsequent exposure to diazoxide (200 μm; n = 14) or treated with NMDA alone (50 μm; n = 11). E, representative cell-attached recordings from an untransfected cell and three different GluN2A phosphorylation mutants (Y1292F, Y1325F, or Y1387F) treated with 10 nm leptin. F, group data showing the amount of hyperpolarization induced by leptin for an untransfected cell (n = 26) and for single GluN2A phosphorylation mutants (GluN2AY1292F, n = 19; GluN2AY1325F, n = 16; GluN2AY1387F, n = 15). ***, p < 0.0005 by unpaired t test as compared with untransfected cells. Error bars, S.E.
Figure 5.
Figure 5.
Leptin induces activation of Src kinase. A, immunofluorescence images of cultured INS-1 831/13 cells stained with 4′,6-diamidino-2-phenylindole (blue) and phosphorylated SrcY418 (green) for conditions indicated. Cells were treated with vehicle (control), leptin (10 nm, 10 min), or leptin with dasatinib (25 μm, pretreated for 30 min before leptin was applied). B, group data for phosphorylated SrcY418 fluorescence for each condition normalized to the control (n = 100 cells/condition for each experiment, and the experiment was repeated three times). *, p < 0.05, unpaired Student's t test. C, representative Western blotting of phosphorylated SrcY418 from cell lysates prepared from INS-1 832/13 cells treated with vehicle, leptin, or leptin co-applied with dasatinib. D, group data from four independent experiments as indicated in C. *, p < 0.05, unpaired Student's t test. E, top, Western blotting showing surface SUR1 in response to vehicle or leptin using control cells and cells transfected with an Src kinase–dead mutant (Src-KD). Bottom, total SUR1 showing both the complex glycosylated form (top band, solid circle) that can traffic to the cell surface and the core-glycosylated form (bottom band, open circle) that is in the endoplasmic reticulum/early Golgi. F, quantitation of three independent surface SUR1 experiments. Data were analyzed by one-way analysis of variance (p = 0.0019, F = 12.95) followed by a post hoc Dunnett's multiple-comparison test with significance set to p < 0.05 (*). Error bars, S.E.
Figure 6.
Figure 6.
Leptin signaling through GluN2A-containing NMDARs in human β-cells is mediated by Src family kinases. A, individual cell-attached membrane potential recordings from human β-cells isolated from nondiabetic islets treated with leptin (10 nm) alone (top) or leptin together with TCN-201 (bottom; 50 μm). B, summary data from three nondiabetic donors showing the amount of hyperpolarization induced by leptin alone (n = 2–5 cells/donor) or when leptin was co-applied with TCN-201 (n = 3–4 cells/donor). Inset, normalized responses to leptin across donors in the absence or presence of TCN-201. C, representative traces of cell-attached current-clamp recordings from human β-cells isolated from nondiabetic islets treated with leptin in the absence or presence of AZD (10 μm). D, summary data from five nondiabetic donors showing the extent of membrane hyperpolarization in response to leptin alone (n = 19 cells; 3–6 cells/donor) or when leptin was co-applied with dasatinib (Das; 25 μm; n = 7 cells; 2–3 cells/donor) or AZD (n = 6 cells; 3 cells/donor). Inset, normalized responses to leptin across donors in the absence or presence of dasatinib or AZD. *, p < 0.05; ***, p < 0.0005, Welch's t test compared with leptin alone group. Error bars, S.E.
Figure 7.
Figure 7.
Direct NMDAR activation causes membrane hyperpolarization in mice deficient in leptin receptor signaling. A, representative cell-attached membrane potential recordings from β-cells isolated from C57BL/6J (WT) mice treated with leptin (top trace) or β-cells isolated from db/db mice treated with leptin (10 nm) followed by diazoxide (250 μm; bottom trace). B, group data showing the degree of membrane hyperpolarization in mV for β-cells isolated from C57BL/6J (WT, n = 9) or db/db (n = 7) mice for the indicated conditions. Gray and black circles indicate different animals. ***, p < 0.0001, unpaired Student's t test compared with WT leptin–treated group. C, as described for A except β-cells were treated with NMDA (50 μm). D, group data showing the degree of membrane hyperpolarization in mV for β-cells isolated from C57BL/6J (n = 9) or db/db (n = 9) mice following NMDA treatment. Error bars, S.E.
Figure 8.
Figure 8.
β-Cells from obese type 2 diabetic human donors failed to respond to leptin but retained response to NMDA. A, current density of KATP channels (left) and Kv2.1 channels (right) in β-cells from human diabetic donors treated with vehicle or 10 nm leptin (30 min). Different symbols are used to denote different donors. There is no statistically significant difference between leptin-treated and control groups. B, whole-cell NMDA currents in β-cells from diabetic donors before leptin application (control) or after 5-min incubation in 10 nm leptin (leptin). The mean (filled circles) and individual cell currents (before and after leptin treatment connected by a solid line) are shown. The open and filled gray diamonds represent different donors. C, representative cell-attached current-clamp recordings from human diabetic β-cells treated with 10 nm leptin (top) or 50 μm NMDA (bottom). Note the spike in the top trace near the end of the recording is a solution suction artifact. D, group data showing membrane potential response to leptin or NMDA in β-cells isolated from human diabetic donors. *, p < 0.05, unpaired Student's t test compared with the leptin-treated group. Error bars, S.E.

References

    1. Emilsson, V., Liu, Y. L., Cawthorne, M. A., Morton, N. M., and Davenport, M. (1997) Expression of the functional leptin receptor mRNA in pancreatic islets and direct inhibitory action of leptin on insulin secretion. Diabetes 46, 313–316 10.2337/diab.46.2.313 - DOI - PubMed
    1. Fehmann, H. C., Peiser, C., Bode, H. P., Stamm, M., Staats, P., Hedetoft, C., Lang, R. E., and Göke, B. (1997) Leptin: a potent inhibitor of insulin secretion. Peptides 18, 1267–1273 10.1016/S0196-9781(97)00135-6 - DOI - PubMed
    1. Kieffer, T. J., Heller, R. S., Leech, C. A., Holz, G. G., and Habener, J. F. (1997) Leptin suppression of insulin secretion by the activation of ATP-sensitive K+ channels in pancreatic beta-cells. Diabetes 46, 1087–1093 10.2337/diabetes.46.6.1087 - DOI - PMC - PubMed
    1. Kulkarni, R. N., Wang, Z. L., Wang, R. M., Hurley, J. D., Smith, D. M., Ghatei, M. A., Withers, D. J., Gardiner, J. V., Bailey, C. J., and Bloom, S. R. (1997) Leptin rapidly suppresses insulin release from insulinoma cells, rat and human islets and, in vivo, in mice. J. Clin. Invest. 100, 2729–2736 10.1172/JCI119818 - DOI - PMC - PubMed
    1. Ookuma, M., Ookuma, K., and York, D. A. (1998) Effects of leptin on insulin secretion from isolated rat pancreatic islets. Diabetes 47, 219–223 10.2337/diabetes.47.2.219 - DOI - PubMed

Publication types

MeSH terms