. 2020 Oct 9;11(1):5106.
doi: 10.1038/s41467-020-18827-5.

A network model of Italy shows that intermittent regional strategies can alleviate the COVID-19 epidemic

Affiliations

A network model of Italy shows that intermittent regional strategies can alleviate the COVID-19 epidemic

Fabio Della Rossa et al. Nat Commun. .

Abstract

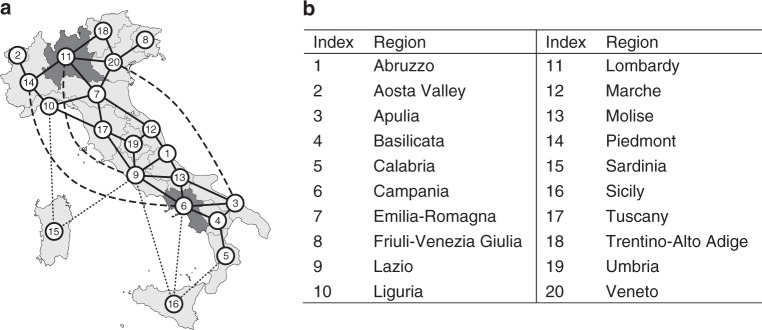
The COVID-19 epidemic hit Italy particularly hard, yielding the implementation of strict national lockdown rules. Previous modelling studies at the national level overlooked the fact that Italy is divided into administrative regions which can independently oversee their own share of the Italian National Health Service. Here, we show that heterogeneity between regions is essential to understand the spread of the epidemic and to design effective strategies to control the disease. We model Italy as a network of regions and parameterize the model of each region on real data spanning over two months from the initial outbreak. We confirm the effectiveness at the regional level of the national lockdown strategy and propose coordinated regional interventions to prevent future national lockdowns, while avoiding saturation of the regional health systems and mitigating impact on costs. Our study and methodology can be easily extended to other levels of granularity to support policy- and decision-makers.


Conflict of interest statement

The authors declare no competing interests.

Figures

Fig. 1
Fig. 1. Schematic diagram of the network-model structure and representative regional parameters.
a Representative graph of the network-model structure used in the paper. Only a subset of all links is shown for the sake of clarity (the complete graphs are depicted in Supplementary Fig. 8). Solid lines represent proximity links, dashed lines long-distance transportation routes (planes and trains), dotted lines show major ferry routes between insular regions and the Italian mainland. b Table of the Italian region names and their labels in the graph.
Fig. 2
Fig. 2. Only one region relaxes its lockdown.
Double scale plots of the a regional and b national dynamics in the case where only one region (Lombardy in Northern Italy) relaxes its containment measures at time 0, while inter-regional fluxes are set to the level they reached during the lockdown. (Regional dynamics when the fluxes between regions are set to their prelockdown level are shown in Supplementary Fig. 1 showing even more dramatic scenarios.) The scale on the left vertical axis (in red) applies to the fraction of hospitalized requiring ICU (red solid line) and the ICU beds capacity threshold (TiH/Ni, dashed red line). The scale on the right vertical axis (in black) applies to the infected (blue), quarantined (magenta), recovered (green) and deceased (black). The time scale, on the horizontal axis, is given in days. Panels of regions adopting a lockdown are shaded in red while those of regions relaxing social containment measures are shaded in green. Results are averaged over 10,000 simulations with parameters sampled using a Latin Hypercube technique (see Methods) around their nominal values set as those estimated in the last time window for each region as reported in Supplementary Table 4. Shaded bands correspond to twice the standard deviation. The regions identified with a red label are those where the total hospital capacity is saturated.
Fig. 3
Fig. 3. Intermittent regional measures.
a Each of the 20 panels shows the evolution in a different region of the fraction in the population of infected (blue), quarantined (magenta) and hospitalized requiring ICUs (red) averaged over 10,000 simulations with parameters sampled using a Latin Hypercube technique (see Methods) around their nominal values set as those estimated in the last time window for each region as reported in Supplementary Table 4. Shaded bands correspond to twice the standard deviation. Dashed red lines represent the fraction of the population that can be treated in ICU (TiH/Ni). Regions adopt lockdown measures in the time windows shaded in red while relax them in those shaded in green. During a regional lockdown, fluxes in/out of the region are set to their minimum level. b National evolution of the fraction in the population of infected (blue), quarantined (magenta) and hospitalized requiring ICUs (red) obtained by summing those in each of the 20 regions adopting intermittent regional measures. c National evolution of the fraction in the population of infected (blue), quarantined (magenta) and hospitalized requiring ICUs (red) when an intermittent national lockdown is enforced with all regions shutting down when the total number of occupied ICU beds at the national level exceed 20%, reopening when it goes back below 10%. Regional dynamics corresponding to this scenario are shown in Supplementary Fig. 4. All plots are shown with a double scale. The scale on the left vertical axis (in red) applies to the hospitalized requiring ICU and the ICU beds capacity threshold, while the right vertical axis (in black) applies to the infected and quarantined. The time scale, on the horizontal axis, is given in days.
Fig. 4
Fig. 4. Intermittent regional measures with increased COVID-19 testing capacity.
a Each of the 20 panels shows in a double scale plot the evolution in the region named above the panel of the fraction in the population of infected (blue), quarantined (magenta) and hospitalized requiring ICUs (red) averaged over 10,000 simulations with parameters sampled using a Latin Hypercube technique (see Methods) around their nominal values set as those estimated in the last time window for each region as reported in Supplementary Table 4. Shaded bands correspond to twice the standard deviation. Dashed red lines represent the fraction of the population that can be treated in ICU (TiH/Ni). Regions adopt lockdown measures in the time windows shaded in red while relax them in those shaded in green. During a regional lockdown, fluxes in/out of the region are set to their minimum level. Regional COVID-19 testing capacities are assumed to be increased by a factor 2.5 (see Methods) with respect to their current values. b National evolution of the fraction of infected (blue), quarantined (magenta) and hospitalized requiring ICUs (red) obtained by summing those in each of the 20 regions adopting intermittent regional measures. All plots are shown with a double scale. The scale on the left vertical axis (in red) applies to the hospitalized requiring ICU and the ICU beds capacity threshold, while the right vertical axis (in black) applies to the infected and quarantined subjects.
Fig. 5
Fig. 5. Regional compartmental model structure adopted in our study.
Schematic structure of model described by Eqs. (1)–(6). Compartments describe the dynamics of susceptible (Si), infected (Ii), quarantined (Qi), hospitalized (Hi), recovered (Ri) and deceased (Di). The number of hospitalized requiring ICU is estimated as 10% of the total. The model structure was suggested from data analysis with links between compartments being added or removed according to how the data were matched by the model (see Supplementary Notes for further details).

References

    1. Calafiore, G. C., Novara, C. & Possieri, C. A modified SIR model for the COVID-19 contagion in Italy. Preprint at https://arxiv.org/abs/2003.14391 (2020). - PMC - PubMed
    1. Giordano, G. et al. Modelling the COVID-19 epidemic and implementation of population-wide interventions in Italy. Nat. Med.26, 1–6 (2020). - PMC - PubMed
    1. Hethcote HW. The mathematics of infectious diseases. SIAM Rev. 2000;42:599–653. doi: 10.1137/S0036144500371907. - DOI
    1. Mummert A, Otunuga OM. Parameter identification for a stochastic SEIRS epidemic model: case study influenza. J. Math. Biol. 2019;79:705–729. doi: 10.1007/s00285-019-01374-z. - DOI - PMC - PubMed
    1. Peng, L., Yang, W., Zhang, D., Zhuge, C. & Hong, L. Epidemic analysis of COVID-19 in China by dynamical modeling. Preprint at https://arxiv.org/abs/2002.06563 (2020).

Publication types

MeSH terms