. 2020 Oct 9;11(1):5110.
doi: 10.1038/s41467-020-18877-9.

Accommodating individual travel history and unsampled diversity in Bayesian phylogeographic inference of SARS-CoV-2

Affiliations

Accommodating individual travel history and unsampled diversity in Bayesian phylogeographic inference of SARS-CoV-2

Philippe Lemey et al. Nat Commun. .

Abstract

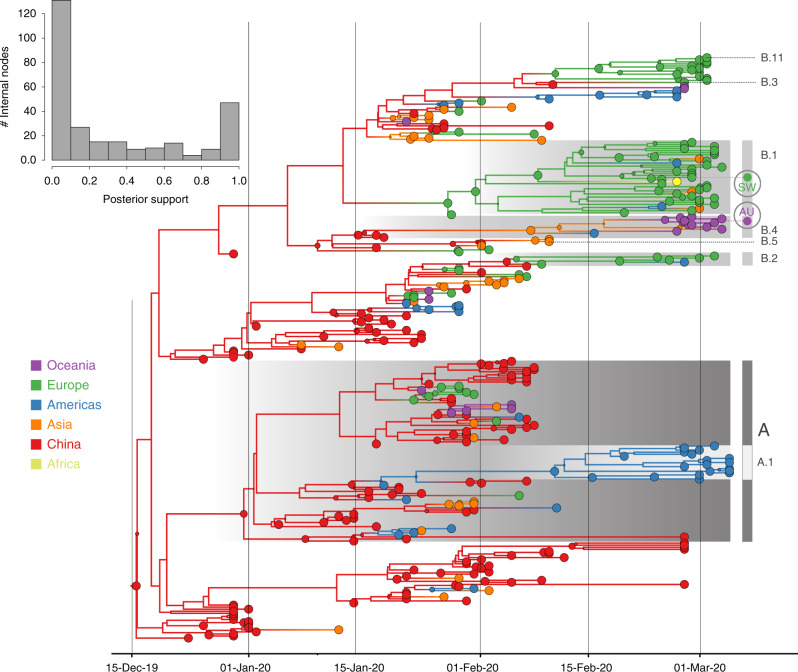
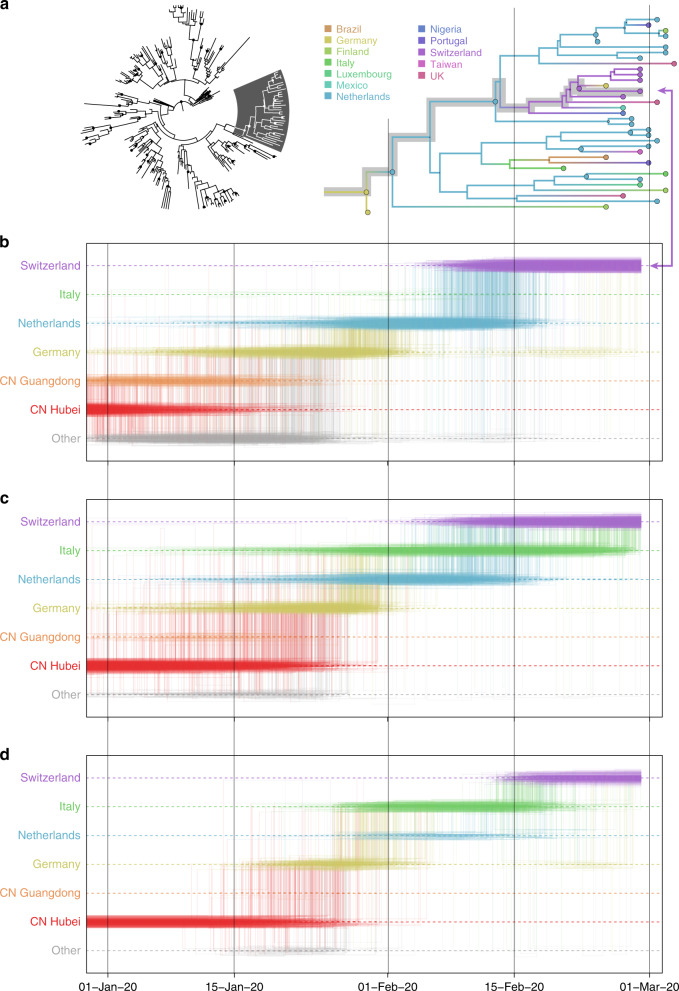
Spatiotemporal bias in genome sampling can severely confound discrete trait phylogeographic inference. This has impeded our ability to accurately track the spread of SARS-CoV-2, the virus responsible for the COVID-19 pandemic, despite the availability of unprecedented numbers of SARS-CoV-2 genomes. Here, we present an approach to integrate individual travel history data in Bayesian phylogeographic inference and apply it to the early spread of SARS-CoV-2. We demonstrate that including travel history data yields i) more realistic hypotheses of virus spread and ii) higher posterior predictive accuracy compared to including only sampling location. We further explore methods to ameliorate the impact of sampling bias by augmenting the phylogeographic analysis with lineages from undersampled locations. Our reconstructions reinforce specific transmission hypotheses suggested by the inclusion of travel history data, but also suggest alternative routes of virus migration that are plausible within the epidemiological context but are not apparent with current sampling efforts.


Conflict of interest statement

The authors declare no competing interests.

Figures

Fig. 1
Fig. 1. Bayesian phylogeographic reconstruction for the full data set incorporating travel history data.
Although the phylogeographic analysis was performed using 44 location states, nodes and branches are shaded according to an aggregated color scheme for clarity. Lineage classifications are highlighted for specific clusters: lineage A is embedded in lineage B. For lineage B, only specific sub-lineages are indicated. The taxa from Switzerland (SW) and Australia (AU) further investigated using trajectory plots are indicated at the tips of the trees. The inset represents a histogram of the internal node posterior support values.
Fig. 2
Fig. 2. Phylogeographic reconstruction and spatiotemporal ancestry of a virus collected in Switzerland (EPI_ISL_413021).
a Phylogenetic cluster with the Swiss virus shaded in gray in the MCC tree, and the same B.1 cluster with branches colored according to posterior modal location states inferred by an analysis using sampling location only. The tip for the Swiss virus corresponding to the trajectory in b is indicated with an arrow. Markov jump trajectory plot depicting the ancestral transition history between locations from Hubei up the sampling location for the Swiss genome, using b sampling location only, c travel origin location, and d sampling location and travel history. The trajectories are summarized from a posterior tree distribution with Markov jump history annotation. A horizontal line in a trajectory represents the time during which a particular location state is maintained in the spatiotemporal ancestry of the virus. An example of such an ancestry is highlighted in gray in the MCC tree cluster. A vertical line represents a Markov jump between two locations in the trajectory. The most prominent locations in the posterior trajectories are ordered along the Y-axis together with “other”, which represents all remaining locations. The relative density of lines reflects the posterior uncertainty in location state and transition time between states.
Fig. 3
Fig. 3. Markov jump trajectory plot depicting the ancestral transition history between locations from Hubei up the sampling location for an Australian genome (EPI_ISL_412975) in lineage B.4.
The reconstructions use a sampling location only, b travel origin location, and c sampling location and travel history. The trajectories are summarized from a posterior tree distribution with Markov jump history annotation in the same way as in Fig. 2.
Fig. 4
Fig. 4. Markov jump trajectory plot as in Fig. 3 for a Swiss genome (EPI_ISL_413021) in lineage B1, and B1 subtree for the Bayesian phylogeographic analysis incorporating travel data and unsampled diversity.
Dotted lines represent branches associated with unsampled taxa assigned to Italy and Hubei, China. The tip for the Swiss genome corresponding to the trajectory is indicated with an arrow. The basal German virus is labeled. The value at the root and the common ancestor of the Italian clade represents the posterior location state probability.
Fig. 5
Fig. 5. Markov jump trajectory plot as in fig. 3 for the Australian genome (EPI_ISL_412975) in lineage B.4 and B4 subtree for the Bayesian phylogeographic analysis incorporating travel data and unsampled diversity.
Dotted branches in the phylogeny are associated with unsampled taxa assigned to Iran and Hubei, China. The tip for the Australian genome corresponding to the trajectory is indicated with an arrow. The vertical dotted line represents the first report of COVID-19 in Iran.
Fig. 6
Fig. 6. Sankey plots summarizing Markov jump estimates for the analyses of the 282 genome data set.
The reconstructions use a sampling location only, b sampling location and travel history, and c sampling location and travel history with unsampled diversity, and d for the analysis of the 500 genome data set using sampling location and travel history. The plots show the relative number of transitions between origin (top) and destination (bottom) locations. We note that locations may both be origin locations (in the top row) and destination locations (in the bottom row), and there is no temporal order for the transitions involved. For summaries that show all transitions to and from a location connected to that particular location, we refer to the circular migration plots in Supplementary Fig. S7.
Fig. 7
Fig. 7. Incorporating travel history data in phylogeographic reconstruction.
a The concept of introducing ancestral nodes associated with locations from which travelers returned. The ancestral nodes are indicated by arrows for five cases relating them to the genomes sampled from the travelers. The ancestral nodes are introduced at different times in the ancestral path of each sampled genome. bd The results from analyses using sampling location and travel history, sampling location only, and travel origin location, respectively. The branch color reflects the modal state estimate at the child node. There is some topological variability, but only involving nodes that are poorly supported.

Update of

References

    1. Quick J, et al. Real-time, portable genome sequencing for Ebola surveillance. Nature. 2016;530:228–232. doi: 10.1038/nature16996. - DOI - PMC - PubMed
    1. Lu J, et al. Genomic epidemiology of SARS-CoV-2 in Guangdong Province, China. Cell. 2020;181:997–1003. doi: 10.1016/j.cell.2020.04.023. - DOI - PMC - PubMed
    1. Deng, X. et al. Genomic surveillance reveals multiple introductions of SARS-CoV-2 into Northern California. Science369, 582–587 (2020). - PMC - PubMed
    1. Bedford, T. et al. Cryptic transmission of SARS-CoV-2 in Washington State. Science eabc0523 (2020). - PMC - PubMed
    1. Fauver et al. Coast-to-Coast Spread of SARS-CoV-2 during the Early Epidemic in the United States. Cell181, 990–996 (2020). - PMC - PubMed

Publication types