Comment
. 2020 Oct 9;7(1):334.
doi: 10.1038/s41597-020-00678-w.

Proteomic and transcriptomic profiling of aerial organ development in Arabidopsis

Affiliations
Comment

Proteomic and transcriptomic profiling of aerial organ development in Arabidopsis

Julia Mergner et al. Sci Data. .

Abstract

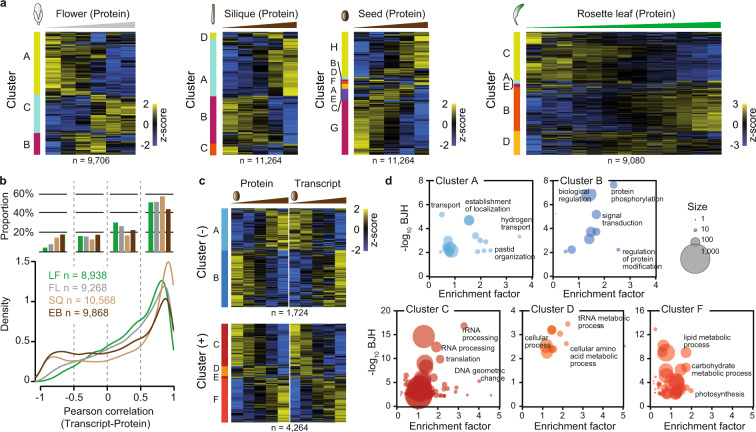
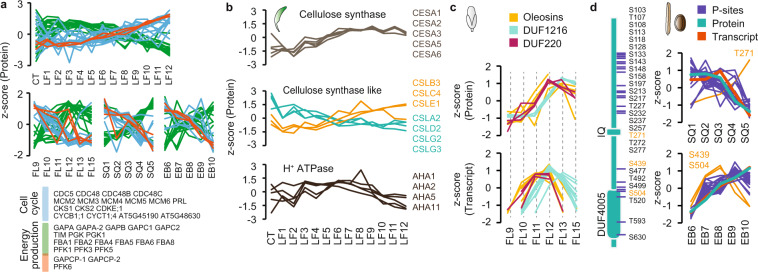
Plant growth and development are regulated by a tightly controlled interplay between cell division, cell expansion and cell differentiation during the entire plant life cycle from seed germination to maturity and seed propagation. To explore some of the underlying molecular mechanisms in more detail, we selected different aerial tissue types of the model plant Arabidopsis thaliana, namely rosette leaf, flower and silique/seed and performed proteomic, phosphoproteomic and transcriptomic analyses of sequential growth stages using tandem mass tag-based mass spectrometry and RNA sequencing. With this exploratory multi-omics dataset, development dynamics of photosynthetic tissues can be investigated from different angles. As expected, we found progressive global expression changes between growth stages for all three omics types and often but not always corresponding expression patterns for individual genes on transcript, protein and phosphorylation site level. The biggest difference between proteomic- and transcriptomic-based expression information could be observed for seed samples. Proteomic and transcriptomic data is available via ProteomeXchange and ArrayExpress with the respective identifiers PXD018814 and E-MTAB-7978.


Conflict of interest statement

M.W. and B.K. are founders and shareholders of OmicScouts GmbH and msAId GmbH. They have no operational role in the companies. M.F. is founder, shareholder and the CEO of msAId GmbH. The remaining authors declare no competing interests.

Figures

Fig. 1
Fig. 1
Sample description and experimental workflow. (a) Selected tissue growth stages and tandem mass tag (TMT) labelling scheme for rosette leaf, flower and silique/seed samples. Rosette leaf and seed/silique samples were labelled with TMT10plex and flower samples with TMT6plex reagents. Cotyledons (CT), leaf (LF), silique (SQ), seed (EB), flower (FL). (b) Schematic depiction of the proteomic and RNAseq workflows. Solid phase extraction (SPE), ion metal affinity chromatography (IMAC), hydrophilic strong anion exchange chromatography (hSAX), basic reversed phase chromatography (bRP).
Fig. 2
Fig. 2
Number of identifications across samples. (a) Overlap between Arabidopsis protein coding genes identified on transcript, protein and phosphoprotein level for rosette leaf (left panel), flower (middle panel) and the silique/seed (right panel). (b) Overlap between Arabidopsis protein coding genes identified in the different tissue datasets on transcript (left panel), protein (middle panel) and phosphoprotein level (right panel). (c) TPM intensity distribution of transcripts identified in this study. The number of transcripts also identified as proteins are highlighted in blue.
Fig. 3
Fig. 3
Expression profile correlation across developmental stages. (a) Pearson correlation between protein intensity values for the rosette leaf (left panel), the flower (middle panel) and the seed/silique (right panel) growth stages. (b) Pearson correlation between transcript intensity values for the rosette leaf (left panel), the flower (middle panel) and the seed/silique (right panel) growth stages. (c) Pearson correlation between protein intensity values of rosette leaf series one and two with biological replicates of cotyledons and rosette leaves 5, 6, 7, 10, 11 and 12. Batch effect differences between TMT experiments were adjusted with mCombat (see methods). (d) Principal component analysis of the proteins and transcripts identified in all samples of a tissue dataset on both transcript (squares) and protein level (circles) (LF n = 7,563; FL n = 9,138; SQ/EB n = 9,559). Proteome sample stage names are given in blue, transcriptome samples in grey.
Fig. 4
Fig. 4
GO enrichment and protein-transcript correlation. (a) Supervised hierarchical clustering of z-scored gene expression profiles at protein level for leaf, flower, silique and seed datasets. (b) Density profiles of Pearson correlation coefficients between transcript and protein abundance for individual genes (lower panel). Bar chart displaying the respective proportion of genes with positive (0.5 to 1), negative (−1 to −0.5) or no correlation (−0.5 to 0 and 0 to 0.5) (upper panel). Rosette leaf (LF), flower (FL), silique (SQ) and seed (EB). (c) Supervised hierarchical clustering of z-scored gene expression profiles at protein and transcript level for genes with positive (+; 0.5 to 1) or negative (-; -1 to −0.5) protein-transcript correlation. (d) Fisher’s exact test GO term enrichment for clusters from (c). Benjamini-Hochberg (BJH) threshold 0.01.
Fig. 5
Fig. 5
Multi-omics expression profile comparison. (a) Protein expression profiles for genes associated with cell cycle or energy production. (b) Protein expression profiles for cellulose synthase, cellulose synthase-like and H+ATPase proteins (rosette leaf dataset). (c) Protein and transcript expression profiles for Oleosin (n = 6) and domain of unknown function (DUF) 1216 (n = 10) and DUF226 (n = 5) protein families (flower dataset). (d) Schematic depiction of ISQ14 protein domains and localization of phosphorylation sites identified in the silique/seed dataset (left panel). Z-scored intensity profiles for IQD14 phosphorylation sites plotted together with IQD14 expression profiles on protein and transcript level (right panel).

Comment on

  • Mass-spectrometry-based draft of the Arabidopsis proteome.
    Mergner J, Frejno M, List M, Papacek M, Chen X, Chaudhary A, Samaras P, Richter S, Shikata H, Messerer M, Lang D, Altmann S, Cyprys P, Zolg DP, Mathieson T, Bantscheff M, Hazarika RR, Schmidt T, Dawid C, Dunkel A, Hofmann T, Sprunck S, Falter-Braun P, Johannes F, Mayer KFX, Jürgens G, Wilhelm M, Baumbach J, Grill E, Schneitz K, Schwechheimer C, Kuster B. Mergner J, et al. Nature. 2020 Mar;579(7799):409-414. doi: 10.1038/s41586-020-2094-2. Epub 2020 Mar 11. Nature. 2020. PMID: 32188942

References

    1. Boyes DC, et al. Growth stage-based phenotypic analysis of Arabidopsis: a model for high throughput functional genomics in plants. The Plant cell. 2001;13:1499–1510. doi: 10.1105/tpc.010011. - DOI - PMC - PubMed
    1. Mundermann L, Erasmus Y, Lane B, Coen E, Prusinkiewicz P. Quantitative modeling of Arabidopsis development. Plant physiology. 2005;139:960–968. doi: 10.1104/pp.105.060483. - DOI - PMC - PubMed
    1. Kramer, U. Planting molecular functions in an ecological context with Arabidopsis thaliana. Elife4, 10.7554/eLife.06100 (2015). - PMC - PubMed
    1. Mergner J, et al. Mass-spectrometry-based draft of the Arabidopsis proteome. Nature. 2020;579:409–414. doi: 10.1038/s41586-020-2094-2. - DOI - PubMed
    1. Schmid M, et al. A gene expression map of Arabidopsis thaliana development. Nature genetics. 2005;37:501–506. doi: 10.1038/ng1543. - DOI - PubMed