. 2020 Oct 9;11(1):5093.
doi: 10.1038/s41467-020-18915-6.

Integrative genomic analysis reveals mechanisms of immune evasion in P. falciparum malaria

Affiliations

Integrative genomic analysis reveals mechanisms of immune evasion in P. falciparum malaria

Mame Massar Dieng et al. Nat Commun. .

Abstract

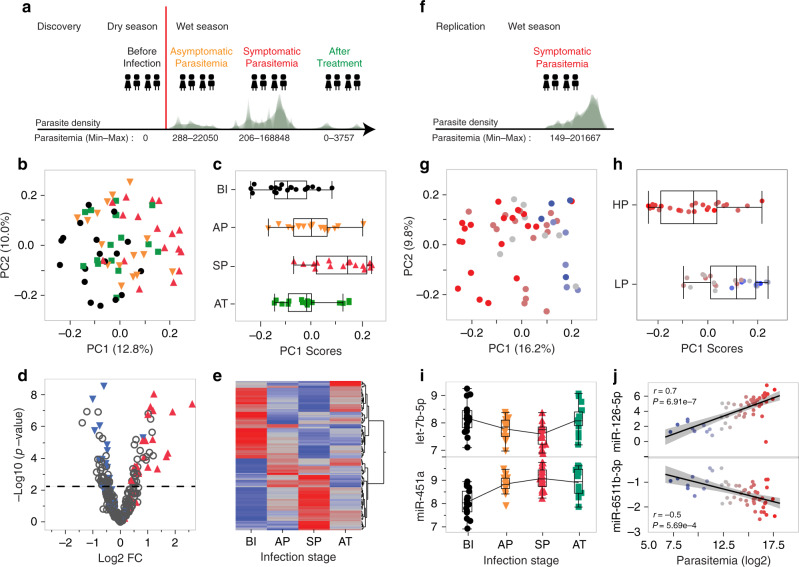
The mechanisms behind the ability of Plasmodium falciparum to evade host immune system are poorly understood and are a major roadblock in achieving malaria elimination. Here, we use integrative genomic profiling and a longitudinal pediatric cohort in Burkina Faso to demonstrate the role of post-transcriptional regulation in host immune response in malaria. We report a strong signature of miRNA expression differentiation associated with P. falciparum infection (127 out of 320 miRNAs, B-H FDR 5%) and parasitemia (72 miRNAs, B-H FDR 5%). Integrative miRNA-mRNA analysis implicates several infection-responsive miRNAs (e.g., miR-16-5p, miR-15a-5p and miR-181c-5p) promoting lymphocyte cell death. miRNA cis-eQTL analysis using whole-genome sequencing data identified 1,376 genetic variants associated with the expression of 34 miRNAs (B-H FDR 5%). We report a protective effect of rs114136945 minor allele on parasitemia mediated through miR-598-3p expression. These results highlight the impact of post-transcriptional regulation, immune cell death processes and host genetic regulatory control in malaria.


Conflict of interest statement

The authors declare no competing interests.

Figures

Fig. 1
Fig. 1. Study design and dynamics of global miRNAs expression profiling in malaria.
a Study design and infection stages profiled in the discovery phase: Before Infection (n = 19), Asymptomatic Parasitemia (n = 16), Symptomatic Parasitemia (n = 17), and After Treatment (n = 16). Parasite density plots and the range of parasitemia (minimum and maximum number of parasites per µl of blood) in each stage are shown. b PCA of the miRNA transcriptome in the discovery set (n = 68). c PC1 scores of the four stages of infection in the discovery set (n = 68): BI (n = 19), AP (n = 16), SP (n = 17), and AT (n = 16). d Volcano plot of differential miRNA expression between the SP (n = 17) and BI (n = 19) groups. The magnitude (log2 fold change; x axis) and statistical significance (−log10 P) of differential expression of individual miRNA derived from repeated measures analysis of covariance (see Methods). The horizontal line indicates the −log10 P corresponding to B-H FDR 5%. Seventy-two miRNAs either positively (labeled in red) or negatively (labeled in blue) correlated with parasitemia in the replication set (n = 53, multiple regression) are highlighted. e Hierarchical clustering of the standardized least square means of 127 differentially expressed miRNAs across the four stages of infection (repeated measures analysis of covariance, B–H FDR 5%.). f Parasite density plot and the range of parasitemia (minimum and maximum number of parasites per µl of blood) in the replication set (Symptomatic Parasitemia; n = 53) are shown. g PCA of the miRNA transcriptome in the replication set (n = 53). The color gradient (blue to gray to red) indicates levels of log2 parasitemia (from low to high). h PC1 scores for the high parasitemia (HP; n = 26) and low parasitemia (LP; n = 27) groups. High and low parasitemia is determined based on the log2 parasitemia median value of 14.8. i Expression values of let-7b-5p and miR-451a across the four stages of infection: BI (n = 19), AP (n = 16), SP (n = 17), and AT (n = 16). j Correlation between expression values of miR-126-5p and miR-6511b-3p, and log2 parasitemia (n = 53) adjusting for sex, age and white blood cell count (multiple regression). Pearson correlation coefficient (r) and P values for miR-126-5 (r = 0.7, B–H P = 6.91e-7) and miR-6511b-3p (r = −0.5, B–H P = 5.69e-4) are shown. The 95% confidence interval of the line of best fit is shown in shaded gray. The data presented within each condition (discovery set: BI, AP, SP, and AT; replication set) are from biologically independent samples. In the discovery set, the data is from repeated measurements as shown in Supplementary Data 1. The box plots in c, h, and i show the median, the 25th and 75th percentiles as box edges, and the 5th and 95th percentiles as bounds of whiskers.
Fig. 2
Fig. 2. Integrative analysis of miRNA-mRNA and functional annotation.
a Examples of negative correlations between miRNAs and their experimentally validated targets: miR-451a-ABCB1, miR-181c-5p-BCL2, and miR-128-3p-LGALS3 (n = 51, multiple regression adjusting for sex, age and white blood cell count). The corresponding Pearson correlation coefficients (r) and nominal P are shown. Each individual is colored by its parasite density (from the lowest (blue) to the highest (red). The 95% confidence intervals of the line of best fit are shaded in gray. b Molecular and cellular functions obtained from the enrichment analysis of 456 genes targeted by the 88 miRNAs differentially expressed between before infection (BI) symptomatic parasitemia (SP) groups and/or associated with parasitemia. The horizontal bars show the level of significance. P values are calculated and adjusted using a right-tailed Fisher’s exact test and Benjamini–Hochberg method. The vertical red line represents the P significance threshold (−log (0.05)). c Annotation of subcategories of the most significantly enriched molecular and cellular function: Cell Death and Survival. P values are calculated using a right-tailed Fisher’s exact test. d Temporal expression changes of miR-16-5p (upper panel) and BCL2 (lower panel) during the course of infection in the discovery set: BI (n = 19), AP (n = 16), SP (n = 17), and AT (n = 16). Pairwise comparisons were done using a two-tailed Student’s t test (*indicates P < 0.05). e Temporal changes of absolute lymphocyte counts during the course of infection in the discovery set: BI (n = 19), AP (n = 16), SP (n = 17), and AT (n = 16). Pairwise comparisons were done using a two-tailed Student’s t test (*P < 0.001). f Experimental validation of apoptotic role of miR-16-5p using cell proliferation assays of HEK and Hela cells transfected with miR-16-5p mimic (n = 6 independent experiments) or a mimic negative control (n = 6 independent experiments). Each data point shows cell viability of mimic-miR-16-5p treated cells relative to mimic-miR-control treated cells 48 h after transfection. Statistical significance was assessed using a paired two-tailed Wilcoxon rank test (P = 0.031 for both cell lines). The box plots in df show the median, the 25th and 75th percentiles as box edges, and the 5th and 95th percentiles as bounds of whiskers.
Fig. 3
Fig. 3. Genetic control of miRNA expression in malaria.
a Manhattan plot of all associations tested between 276 miRNAs and 129,310 cis-SNPs. Associations implicating miR-4326, miR-1304-3p, and miR-598-3p are shown in green and in bd, respectively. The associations shown are for SNPs spanning a 200-kb window centered on the miRNA in question. Peak SNPs are shown in green. The boxplots in bd show miRNA expression and associated SNP data with host genotype (0, reference allele homozygote individuals versus 1/2, heterozygotes and alternative allele homozygote individuals (miR-4326/SNP rs6062431, miR-1304-3p/SNP rs10741471, and miR-598-3p/SNP rs114136945, n = 46). B–H FDR P values (linear regression model in PLINK v1.9) for each association are shown. e Association between parasitemia and SNP rs114136945 (left graph, nominal P value = 0.002, two-tailed student’s t test), miR-598-3p expression in the BI (n = 19) and SP (n = 17) groups (middle graph, B–H P = 4.15e-4, repeated measure ANCOVA), and right, correlation between miR-598-3p expression and log2 parasitemia in the replication set (n = 53, Pearson correlation coefficient r = 0.72, and P = 6.9e-7, multiple regression adjusting for sex, age, and white blood cell count). Each individual is colored by its log2 parasitemia (from the lowest (blue) to the highest (red). The box plots in be show the median, the 25th and 75th percentiles as box edges, and the 5th and 95th percentiles as bounds of whiskers. f Mediation analysis to evaluate potential causal relationship between SNP rs114136945 and log2 parasitemia through modulation of miR-598-3p expression. The regression coefficients β, their 95% confidence intervals and P values for each test are shown: β1 (−3.7), [−6.3, −1.1], P = 0.012, β2 (−1.5), P = 1.29e-3, β3, (−3.1), [−4.5, −1.4], P = 0.002 and β4 (−0.6), [−2.8, −0.9], P = 0.466.

References

    1. WHO. World Malaria Report 2018. 210 (World Health Organization, Geneva, 2017).
    1. Laishram DD, et al. The complexities of malaria disease manifestations with a focus on asymptomatic malaria. Malar. J. 2012;11:29. doi: 10.1186/1475-2875-11-29. - DOI - PMC - PubMed
    1. Ashley EA, Pyae Phyo A, Woodrow CJ. Malaria. Lancet. 2018;391:1608–1621. doi: 10.1016/S0140-6736(18)30324-6. - DOI - PubMed
    1. Langhorne J, Ndungu FM, Sponaas AM, Marsh K. Immunity to malaria: more questions than answers. Nat. Immunol. 2008;9:725–732. doi: 10.1038/ni.f.205. - DOI - PubMed
    1. Jallow M, et al. Genome-wide and fine-resolution association analysis of malaria in West Africa. Nat. Genet. 2009;41:657–665. doi: 10.1038/ng.388. - DOI - PMC - PubMed

Publication types

MeSH terms