. 2020 Oct 9;3(1):565.
doi: 10.1038/s42003-020-01247-y.

Single-cell and spatial transcriptomics enables probabilistic inference of cell type topography

Affiliations

Single-cell and spatial transcriptomics enables probabilistic inference of cell type topography

Alma Andersson et al. Commun Biol. .

Abstract

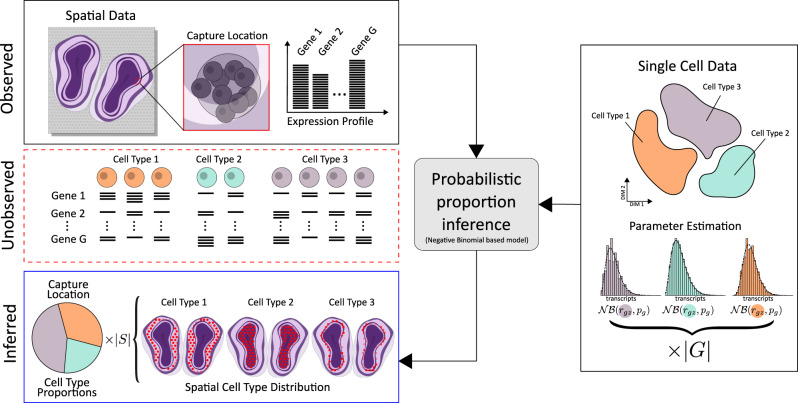
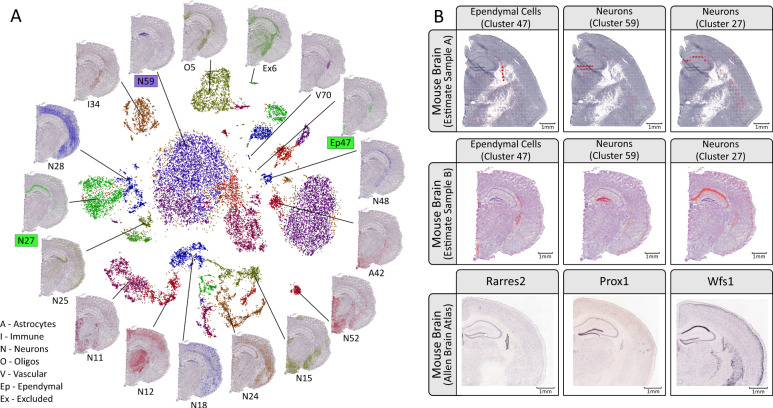
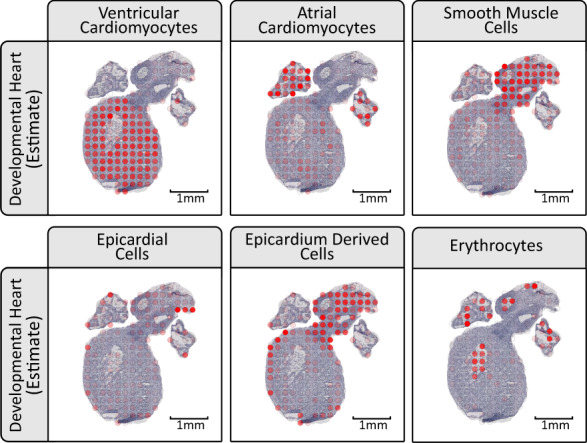
The field of spatial transcriptomics is rapidly expanding, and with it the repertoire of available technologies. However, several of the transcriptome-wide spatial assays do not operate on a single cell level, but rather produce data comprised of contributions from a - potentially heterogeneous - mixture of cells. Still, these techniques are attractive to use when examining complex tissue specimens with diverse cell populations, where complete expression profiles are required to properly capture their richness. Motivated by an interest to put gene expression into context and delineate the spatial arrangement of cell types within a tissue, we here present a model-based probabilistic method that uses single cell data to deconvolve the cell mixtures in spatial data. To illustrate the capacity of our method, we use data from different experimental platforms and spatially map cell types from the mouse brain and developmental heart, which arrange as expected.


Conflict of interest statement

The authors declare no competing interests.

Figures

Fig. 1
Fig. 1. The observed expression profile at each capture location is a mixture of transcripts produced by one or multiple cells, where both the number and their types are unknown.
To model the unobserved cell population at a capture location, type-specific parameters are estimated from annotated single-cell data and combined to best explain the observed data for all ∣G∣ genes. This probabilistic model, based on the negative binomial distribution, enables inference of cell type proportions at each capture location; a procedure completely free from dependence on marker genes or gene set enrichment. Doing this for all ∣S∣ capture locations, results in a map over the spatial cell type landscape of the whole tissue.
Fig. 2
Fig. 2. Mouse brain results overview.
a Visualization of the single-cell hippocampus data by using its gt-SNE embedding (inner region), with spatial proportion estimates of several clusters overlaid on the H&E-image (outer region) of sample mb-V1 (10× Visium array, 55 μm spots). The cluster labels are derived from the original single-cell data set (see “Methods”),. b Estimated proportions for 3 of the 56 clusters, here taken as cell types, defined in the mouse brain single-cell data set. Two different sections are used, mb-ST1 (ST array, 100 μm spots) and mb-V1, to illustrate the consistency between different array resolutions. Marker gene expression patterns obtained by ISH are found in the bottom row, taken from the Allen Brain Atlas. Rarres2 is a marker gene of ependymal cells, Prox1 for dentate granule neurons, and Wfs1 for pyramidal neurons (the latter two both being subtypes of neurons). Face color opacity is proportional to the cell type proportion estimates; scale bars show 1 mm in respective image.
Fig. 3
Fig. 3. Excerpts of the estimated cell type proportions for the developmental heart, all from section dh-B.
The cell types presented are ventricular cardiomyocytes, atrial cardiomyocytes, smooth muscle cells, epicardial cells, epicardium-derived cells, and erythrocytes. For complete results see Supplementary Figs. 7–14.

References

    1. Samuel G, et al. Slide-seq: a scalable technology for measuring genome-wide expression at high spatial resolution. Science. 2019;363:1463–1467. doi: 10.1126/science.aaw1219. - DOI - PMC - PubMed
    1. Vickovic S, et al. High-definition spatial transcriptomics for in situ tissue profiling. Nat. Methods. 2019;16:987–990. doi: 10.1038/s41592-019-0548-y. - DOI - PMC - PubMed
    1. Ståhl PL, et al. Visualization and analysis of gene expression in tissue sections by spatial transcriptomics. Science. 2016;353:78–82. doi: 10.1126/science.aaf2403. - DOI - PubMed
    1. Chen, B. et al Profiling Tumor Infiltrating Immune Cells with CIBERSORT. In: von Stechow L. (Eds) Cancer Systems Biology. Methods in Molecular Biology, vol 1711, 243–259 (2018). - PMC - PubMed
    1. Aran D, Hu Z, Butte AJ. xCell: digitally portraying the tissue cellular heterogeneity landscape. Genome Biol. 2017;18:220. doi: 10.1186/s13059-017-1349-1. - DOI - PMC - PubMed

Publication types