. 2020 Oct 9;10(1):16873.
doi: 10.1038/s41598-020-73942-z.

Blood RNA signatures predict recent tuberculosis exposure in mice, macaques and humans

Affiliations

Blood RNA signatures predict recent tuberculosis exposure in mice, macaques and humans

Russell C Ault et al. Sci Rep. .

Abstract

Tuberculosis (TB) is the leading cause of death due to a single infectious disease. Knowing when a person was infected with Mycobacterium tuberculosis (M.tb) is critical as recent infection is the strongest clinical risk factor for progression to TB disease in immunocompetent individuals. However, time since M.tb infection is challenging to determine in routine clinical practice. To define a biomarker for recent TB exposure, we determined whether gene expression patterns in blood RNA correlated with time since M.tb infection or exposure. First, we found RNA signatures that accurately discriminated early and late time periods after experimental infection in mice and cynomolgus macaques. Next, we found a 6-gene blood RNA signature that identified recently exposed individuals in two independent human cohorts, including adult household contacts of TB cases and adolescents who recently acquired M.tb infection. Our work supports the need for future longitudinal studies of recent TB contacts to determine whether biomarkers of recent infection can provide prognostic information of TB disease risk in individuals and help map recent transmission in communities.


Conflict of interest statement

R.C.A. is inventor on pending patents filed by Texas Biomedical Research Institute for using RNA expression to determine duration of mycobacterial infection, US provisional Patent No. 62/768,708, PCT Patent Application No. PCT/US19/61895. All other authors have no competing interests.

Figures

Figure 1
Figure 1
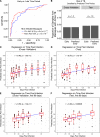
Blood genome-wide RNA expression discriminates early versus late M.tb infection time periods in C57BL/6 mice. Principle component analysis of genome-wide RNA expression measured via microarray in (A) all mice (n = 6 uninfected mice, n = 20 M.tb infected mice) stratified by infection status and (B) only M.tb infected mice stratified by time period post-infection. (C) ROC curve for out-of-bag performance of Random Forest Classifier predicting time period post-infection (1–2 months versus 3–5 months; P from Wilcoxon test, 95% confidence interval shown). (D) Random Forest Regression out-of-bag predictions of monthly time point post-infection. Fit curve calculated via the Loess method with 95% CI shown.
Figure 2
Figure 2
Blood RNA signature discriminates early versus late M.tb infection time periods in cynomolgus macaques. (A) ROC curves for Regularized Logistic Regression prediction of time period post-infection (20–56 days versus 90–180 days) from RNA expression in cynomolgus macaques on ninefold cross-validation in the training set (blue curve; n = 107 early time period samples, n = 103 late time period samples) and final model prediction on test set (red curve; n = 44 early time period, n = 40 late time period) (P from Wilcoxon test). (B) Comparison between early (20–56 days) (n = 107 train, n = 44 test) versus predicted early (n = 104 train, n = 50 test) time period samples in proportion of samples from macaques that develop active TB (P from Fischer’s Exact test). Regularized Linear Regression predictions of time point post-infection for (C) ninefold cross-validation in the training set (n = 210) and for (D) final model prediction on the test set (n = 84). (E–F) Predictions from models trained and evaluated only on samples from the first 90 days post-infection (n = 134 train, n = 55 test). Boxplots represent medians with interquartile ranges for the predictions at each time point (best fit line shown, P from Pearson test).
Figure 3
Figure 3
Blood RNA expression of 250 genes predicts time since active TB exposure in humans. (A) ROC curves for prediction of time since first known IGRA + (0 vs. 6 months) in South African adolescents who acquire M.tb infection for tenfold cross-validation in the training set (blue curve; n = 17 0 month samples, n = 21 6 month samples) and final model prediction on the test set (red curve; n = 10 0 month, n = 9 6 month) using Regularized Logistic Regression. (B) ROC curves for Regularized Logistic Regression prediction of time since active TB exposure (baseline vs. 6 months post-enrollment) in GC6-74 Gambia and Ethiopia test set (n = 37 baseline samples, n = 31 6 months samples) using expression of genes from published signatures that predict prospective risk of active TB. (C) ROC curves for Regularized Logistic Regression prediction of time since active TB exposure for tenfold cross-validation on the Gambia and Ethiopia training set (blue curve; n = 67 baseline, n = 48 6 months) and for final model prediction (contains 250 genes) on the Gambia and Ethiopia test set (red curve; n = 37 baseline, n = 31 6 months). (D) ROC curves for prediction of prospective risk of TB for tenfold cross-validation on the Gambia and Ethiopia training set (blue curve; n = 67 baseline, n = 48 6 months) and for final model prediction on the test set (red curve; n = 37 baseline, n = 31 6 months) using the 250-gene set that predicted time since active TB exposure. P values for all ROC curves are from Wilcoxon test, and 95% confidence intervals are shown.
Figure 4
Figure 4
Time since TB exposure in humans is associated with alteration in CD4 + T cell proportion and immune activation pathways. Changes in CD4 + T cell percentages (A,B) and NK cell percentages (C,D) in GC6-74 healthy household contacts cohort at baseline (n = 104 in A,C; n = 272 in B,D), 6 month (A,C; n = 79) and 18 month (B,D; n = 64) time points after active TB exposure were determined by cell-type deconvolution (P from linear mixed model). Boxplots represent medians with interquartile ranges. (E) Top immunity related enriched canonical pathways in the 250-gene RNA signature of time since exposure to active TB index case (6 months vs. baseline) by IPA (P from Fisher’s Exact test).
Figure 5
Figure 5
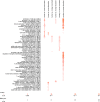
Enriched transcriptional modules are concordantly or discordantly regulated during recent M.tb exposure or infection between mice, macaques or humans by disco analysis. P from CERNO statistical test.
Figure 6
Figure 6
Application of reduced 6-gene signature of time since active TB exposure to adolescent M.tb infection acquisition cohort confirms its identification of recent infection in humans. (A) ROC curves for 6-gene score prediction of time since active TB exposure in the Gambia and Ethiopia training set (blue curve; n = 67 baseline samples, n = 48 6 months samples) and for the Gambia and Ethiopia test set (red curve; n = 37 baseline, n = 31 6 months). (B) ROC curves for discrimination between time of first known IGRA + and all pre-conversion time points (blue curve; n = 27 0 month, n = 24 pre-conversion) and between time of first known IGRA + and all other time points (green curve; n = 27 0 month, n = 24 pre-conversion and n = 31 6 or 12 months after known conversion) in South African adolescents who acquire M.tb infection using 3-gene score from genes detected in microarray data. (C) ROC curves for prediction of prospective risk of TB using highest 6-gene score observed per individual in the ACS cohort (n = 74 nonprogressors, n = 31 progressors), GC6-74 Gambia and Ethiopia test set (n = 49 nonprogressors, n = 11 progressors) and GC6-74 South Africa cohort (n = 141 nonprogressors, n = 39 progressors). (D) ROC curves for discrimination of early and late time periods post-infection in mice (blue curve; n = 8 early mice, n = 12 late mice) and macaques (green curve; n = 151 early samples, n = 143 late samples) using genes from the 6-gene signature that were detected in the respective microarrays. P values for all ROC curves are from Wilcoxon test, and 95% confidence intervals are shown.

References

    1. World Health Organization. Global Tuberculosis Report 2018. https://www.apps.who.int/medicinedocs/en/m/abstract/Js23553en/.
    1. World Health Organization. Global strategy and targets for tuberculosis prevention, care and control after 2015. https://www.who.int/tb/post2015_strategy/en/ (2014).
    1. Houben RMGJ, Dodd PJ. The global burden of latent tuberculosis infection: a re-estimation using mathematical modelling. PLOS Med. 2016;13:e1002152. doi: 10.1371/journal.pmed.1002152. - DOI - PMC - PubMed
    1. Vynnycky E, Fine PEM. Lifetime risks, incubation period, and serial interval of tuberculosis. Am. J. Epidemiol. 2000;152:247–263. doi: 10.1093/aje/152.3.247. - DOI - PubMed
    1. Keshavjee S, et al. Moving toward tuberculosis elimination. Critical issues for research in diagnostics and therapeutics for tuberculosis infection. Am. J. Respir. Crit. Care Med. 2018;199:564–571. doi: 10.1164/rccm.201806-1053PP. - DOI - PMC - PubMed

Publication types