Clinical Trial
. 2020 Oct 9;3(1):563.
doi: 10.1038/s42003-020-01288-3.

Multidimensional analyses reveal modulation of adaptive and innate immune subsets by tuberculosis vaccines

Collaborators, Affiliations
Clinical Trial

Multidimensional analyses reveal modulation of adaptive and innate immune subsets by tuberculosis vaccines

Virginie Rozot et al. Commun Biol. .

Abstract

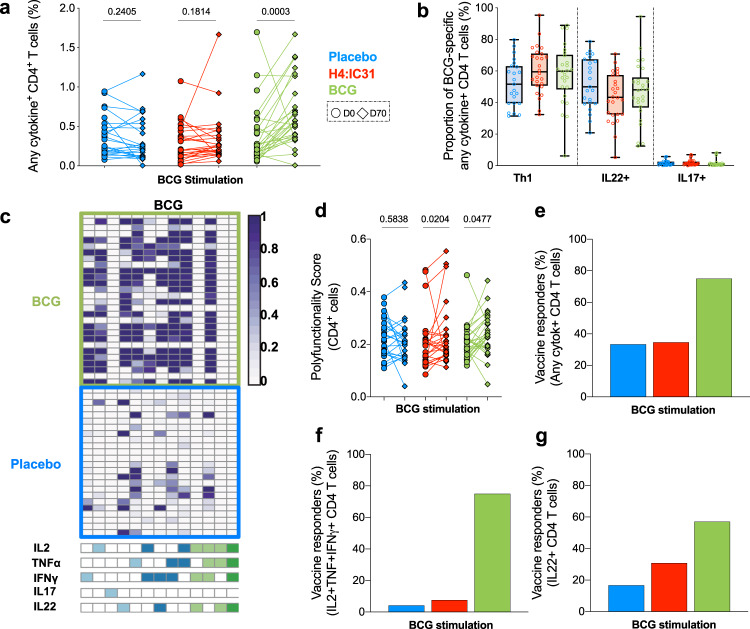
We characterize the breadth, function and phenotype of innate and adaptive cellular responses in a prevention of Mycobacterium tuberculosis infection trial. Responses are measured by whole blood intracellular cytokine staining at baseline and 70 days after vaccination with H4:IC31 (subunit vaccine containing Ag85B and TB10.4), Bacille Calmette-Guerin (BCG, a live attenuated vaccine) or placebo (n = ~30 per group). H4:IC31 vaccination induces Ag85B and TB10.4-specific CD4 T cells, and an unexpected NKTlike subset, that expresses IFN-γ, TNF and/or IL-2. BCG revaccination increases frequencies of CD4 T cell subsets that either express Th1 cytokines or IL-22, and modestly increases IFNγ-producing NK cells. In vitro BCG re-stimulation also triggers responses by donor-unrestricted T cells, which may contribute to host responses against mycobacteria. BCG, which demonstrated efficacy against sustained Mycobacterium tuberculosis infection, modulates multiple immune cell subsets, in particular conventional Th1 and Th22 cells, which should be investigated in discovery studies of correlates of protection.


Conflict of interest statement

MH discloses a clinical trial grant to University of Cape Town, TJS reports grants to University of Cape Town from Aeras, Sanofi Pasteur, the Bill and Melinda Gates Foundation, the Government of the Netherlands Directorate-General for International Cooperation and the United Kingdom Department for International Development.SG and CDG report being employed by and holding shares and stock options in Sanofi Pasteur. The remaining authors declare no competing interests.

Figures

Fig. 1
Fig. 1. Schematic representation of the analysis pipeline and approaches used to characterize the immune response after in vitro stimulation with Ag85B and TB10.4 or BCG in trial participants.
Lymphocytes expressing any cytokines, selected by conventional flow cytometry gating in stimulated and unstimulated samples, were subjected to unsupervised analyses (left) using tSNE and CITRUS, or to targeted analyses (right) where subsets were manually gated and cytokine-co-expression subsets were analyzed by comparing their frequencies directly, or by using COMPASS (functionality and polyfunctionality assessments) or MIMOSA2 (to assign vaccine responder and non-responder status). Double sided arrows show the analyses used in parallel to validate observations with multiple strategies. Single arrows indicate the flow of analysis.
Fig. 2
Fig. 2. H4:IC31-induced immune responses.
tSNE analysis of total cytokine-expressing lymphocytes observed 70 days post-vaccination in H4:IC31 recipients (n = 26) after in vitro restimulation of whole blood with Ag85B (a) or TB10.4 (b). Mean proportions of each lymphocyte subset among the total cytokine-expressing cells are indicated by the horizontal bars. Error bars represent the 95% CI and colors correspond to those in the tSNE plot. Three cell populations were not identifiable with the flow cytometry antibody panel. c Frequencies of CD4 T cells expressing any combination of IFNγ, IL-2, TNF, IL-22, and/or IL-17 for each individual at day 0 (circles) and day 70 (diamonds) randomized to placebo (blue) or H4:IC31 (red). Values above the horizontal floating lines represent p values obtained by comparing responses between day 0 and day 70, calculated by Wilcoxon signed-rank test. d Relative proportions of total cytokine-expressing Ag85B- (blue) or TB10.4-specific (orange) CD4 T cells expressing Th1 cytokines (IFNγ, IL-2 and/or TNF), IL-22 or IL-17 measured at day 70 in H4:IC31 recipients. All participants had a detectable response (Fishers’ exact test, see “Methods”). e, f COMPASS polyfunctionality scores for CD4 T cells, stratified by vaccine arm in response to Ag85B (e) and TB10.4 (f). Changes between day 0 (circles) and day 70 (diamonds) were calculated by Wilcoxon signed-rank test. g Heatmap of COMPASS posterior probabilities for detecting an antigen-specific CD4 T cell response on day 70 relative to day 0 for the indicated cytokine-co-expression subsets in H4:IC31 or placebo recipients. Columns correspond to the different cell subsets (shown are the 13 of 24 subsets with detectable antigen-specific response in at least one participant regardless of antigen specificity), identified below the heatmap and color-coded by the cytokines they express (white = none, shaded = present) and ordered by degree of functionality from one function on the left to five functions on the right. Each row in the heatmap represents one participant. h Percentage of participants with significant vaccine-induced responses to Ag85B (blue) or TB10.4 (red), calculated by MIMOSA2 (see “Methods” section), based on CD4 T cells expressing any combination of IFNγ, IL-2, TNF, IL-22, and/or IL-17 (left), polyfunctional IFNγ+IL-2+ TNF+ (center) or Th22 (right) cytokines on day 70 relative to day 0.
Fig. 3
Fig. 3. BCG-specific immune responses.
tSNE analysis of the total cytokine-expressing lymphocytes observed after BCG restimulation of whole blood collected at day 70 in participants from all study arms (n = 76) (a). Mean proportions of each lymphocyte subset among the total cytokine-expressing cells are indicated by the horizontal bars. Error bars represent the 95% CI and colors correspond to those in the tSNE plot. Two cell populations were not identifiable with the flow cytometry antibody panel. b The same tSNE plot, disaggregated by cytokine and vaccine arm (placebo, blue, n = 23; H4:IC31, red n = 26; and BCG, green, n = 27). c Frequencies of lymphocytes in two BCG-reactive cytokine-expressing cell clusters that were found to be differentially abundant (FDR < 0.1) between day 0 and day 70 in BCG recipients (n = 27) by CITRUS Significance Analysis of Microarrays (SAM) analysis (Supplementary Fig. 7a). d Identity of CITRUS clusters shown in c was confirmed by manual gating in FlowJo as BCG-reactive Th1 and IL-22-producing CD4 T cells. Bars denote medians; p values were computed by comparing frequencies between day 0 and day 70 by Wilcoxon signed-rank test. e Frequencies of lymphocytes in four BCG-reactive cytokine-expressing cell clusters that were found to be differentially abundant (FDR < 0.1) between placebo (blue) and BCG (green) recipients at day 70 by CITRUS SAM analysis (Supplementary Fig. 7b). f Identity of CITRUS cluster A and B shown in e was confirmed by manual gating in FlowJo as BCG-reactive Th1 and IL-22-producing CD4 T cells. Bars denote medians and inter-quartile ranges; p values were computed by comparing frequencies between placebo and BCG recipients by Mann–Whitney U test.
Fig. 4
Fig. 4. Functionality of BCG-specific CD4 T cell immune responses.
a Frequencies of CD4 T cells expressing any combination of IFNγ, IL-2, TNF, IL-22, and/or IL-17 after BCG stimulation at day 0 (circles) and day 70 (diamonds) in the placebo (blue, n = 24) H4:IC31 (red, n = 26) or BCG (green, n = 28) arms. P values were computed by comparing response frequencies between day 0 and day 70 by Wilcoxon signed-rank test. b Relative proportions of total cytokine-expressing CD4 T cells expressing either Th1 cytokines (IFNγ, IL-2, and/or TNF), IL-22, or IL-17 after BCG stimulation, measured at day 70 in the placebo (blue, n = 23), H4:IC31 (red, n = 26), or BCG (green, n = 27) arms. Two participants with undetectable response (Fishers’ exact test, see “Methods”) are not shown. c Heatmap of COMPASS posterior probabilities for detecting an antigen-specific CD4 T cell response on day 70 relative to day 0 for the indicated cytokine-co-expression subsets in BCG or placebo recipients. Columns correspond to the different cell subsets identified below the heatmap (shown are the 13 of 24 subsets with detectable antigen-specific response in at least one participant regardless of antigen specificity), color-coded by the cytokines they express (white = none, shaded = present) and ordered by degree of functionality from one function on the left to five functions on the right. Each row in the heatmap represents one participant. d COMPASS polyfunctionality score for BCG-stimulated CD4 T cells stratified by vaccine arm in response to BCG (placebo in blue, H4:IC31 in red, and BCG in green). P values represent comparisons between day 0 (circles) and day 70 (diamonds), calculated by Wilcoxon signed-rank test. Each line represents one participant. eg Percentage of participants with significant vaccine-induced responses to BCG, calculated by MIMOSA2 (see “Methods” section), based on any combination of IFNγ, IL-2, TNF, IL-22, and/or IL-17 (e), polyfunctional IFNγ+IL-2+TNF+ (f), or IL-22-expressing (g) CD4 T cells stratified by vaccine arm (placebo n = 24, H4:IC31 n = 26, BCG n = 28).

References

    1. Hawn TR, et al. Tuberculosis vaccines and prevention of infection. Microbiol. Mol. Biol. Rev. 2014;78:650–671. doi: 10.1128/MMBR.00021-14. - DOI - PMC - PubMed
    1. Nemes E, et al. Prevention of M. tuberculosis infection with H4:IC31 vaccine or BCG revaccination. N. Engl. J. Med. 2018;379:138–149. doi: 10.1056/NEJMoa1714021. - DOI - PMC - PubMed
    1. Aagaard C, et al. Protection and polyfunctional T cells induced by Ag85B-TB10.4/IC31 against Mycobacterium tuberculosis is highly dependent on the antigen dose. PLoS ONE. 2009;4:e5930. doi: 10.1371/journal.pone.0005930. - DOI - PMC - PubMed
    1. Elvang T, et al. CD4 and CD8 T cell responses to the M. tuberculosis Ag85B-TB10.4 promoted by adjuvanted subunit, adenovector or heterologous prime boost vaccination. PLoS ONE. 2009;4:e5139. doi: 10.1371/journal.pone.0005139. - DOI - PMC - PubMed
    1. Billeskov R, Elvang TT, Andersen PL, Dietrich J. The HyVac4 subunit vaccine efficiently boosts BCG-primed anti-mycobacterial protective immunity. PLoS ONE. 2012;7:e39909. doi: 10.1371/journal.pone.0039909. - DOI - PMC - PubMed

Publication types

MeSH terms