. 2020 Dec;39(50):7239-7252.
doi: 10.1038/s41388-020-01495-6. Epub 2020 Oct 9.

SUV39H1 regulates the progression of MLL-AF9-induced acute myeloid leukemia

Affiliations

SUV39H1 regulates the progression of MLL-AF9-induced acute myeloid leukemia

Yajing Chu et al. Oncogene. 2020 Dec.

Abstract

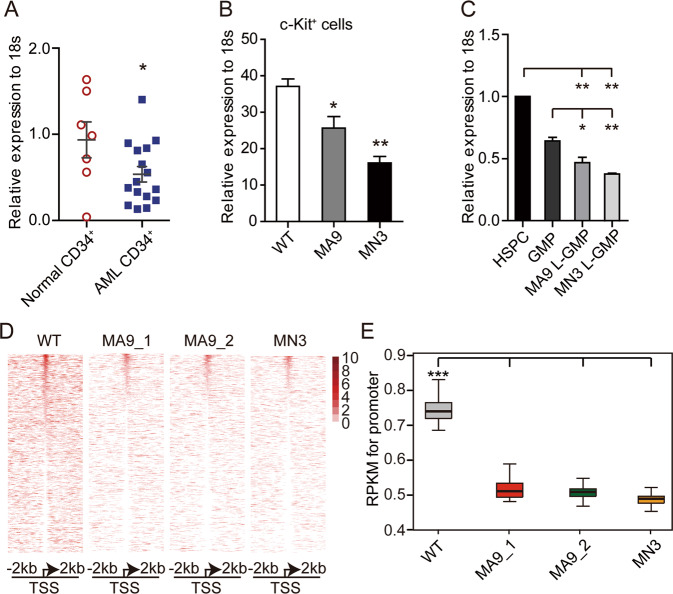
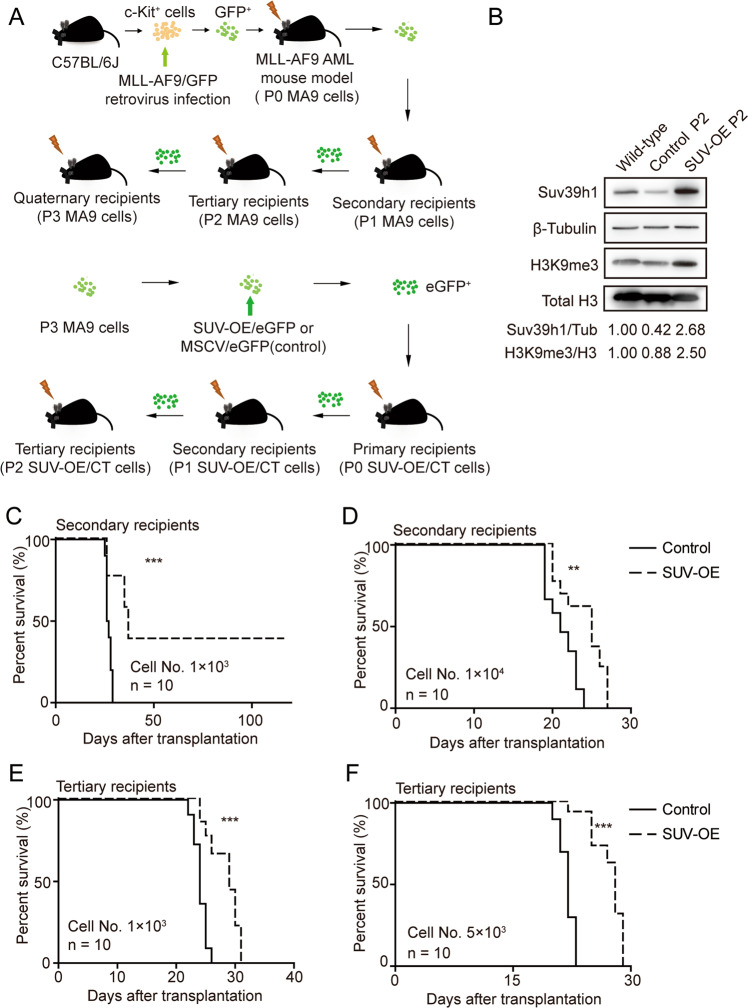
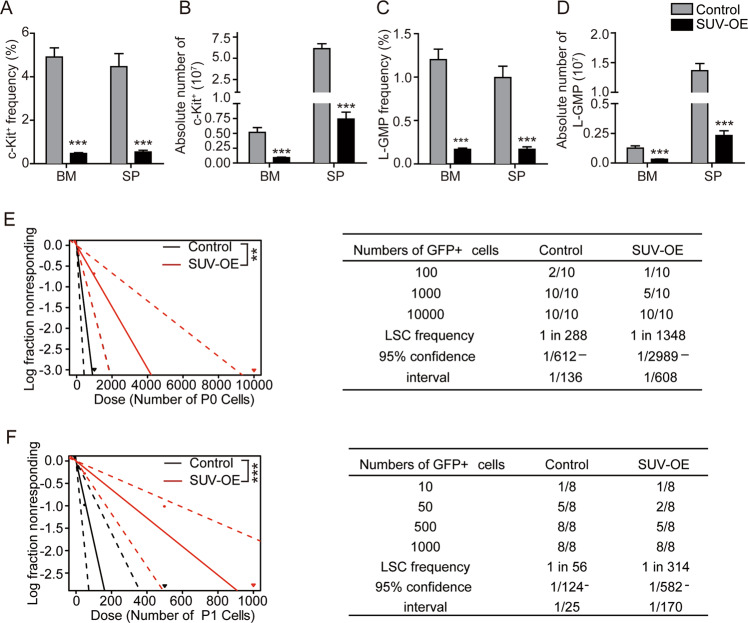
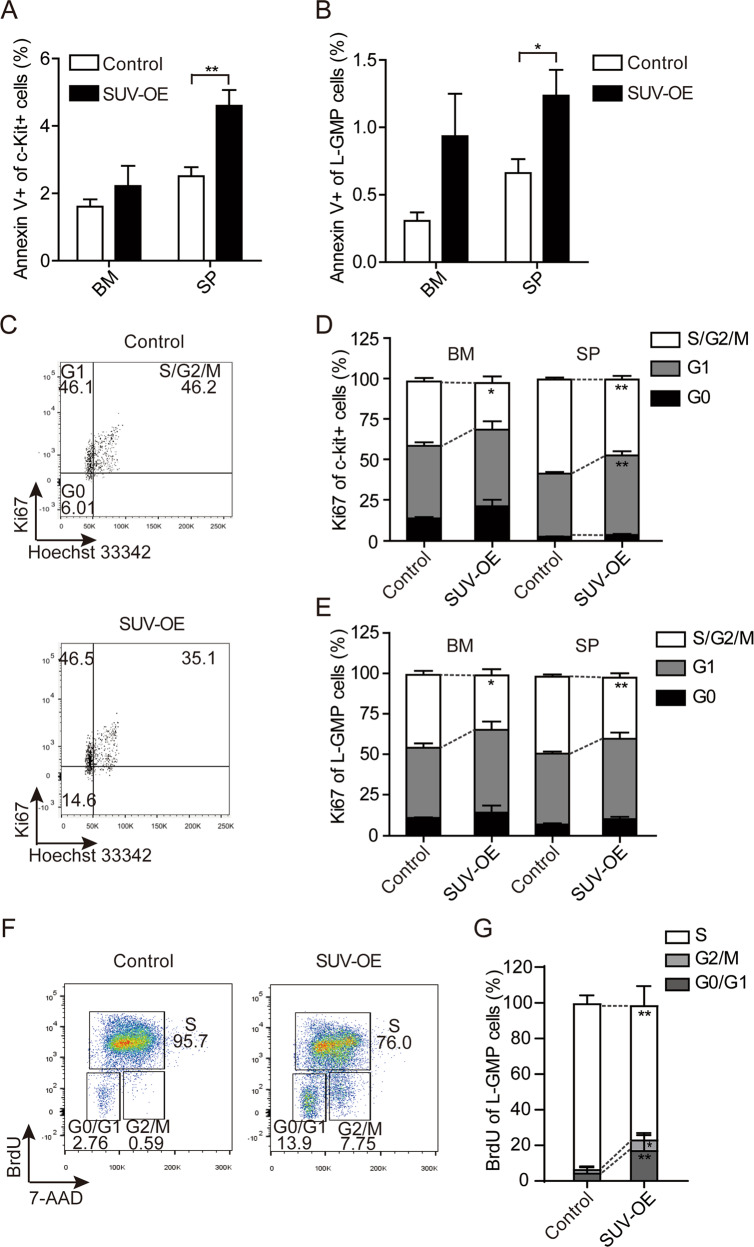
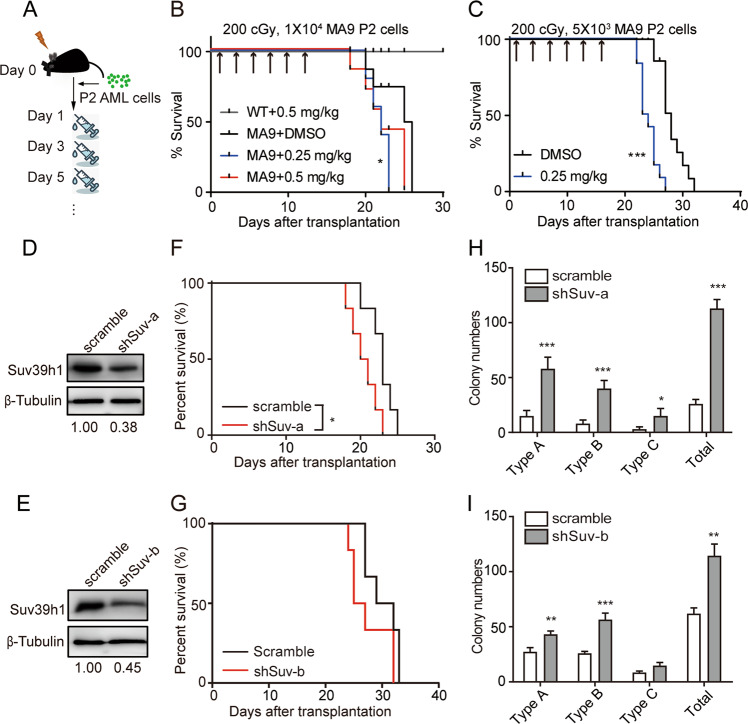
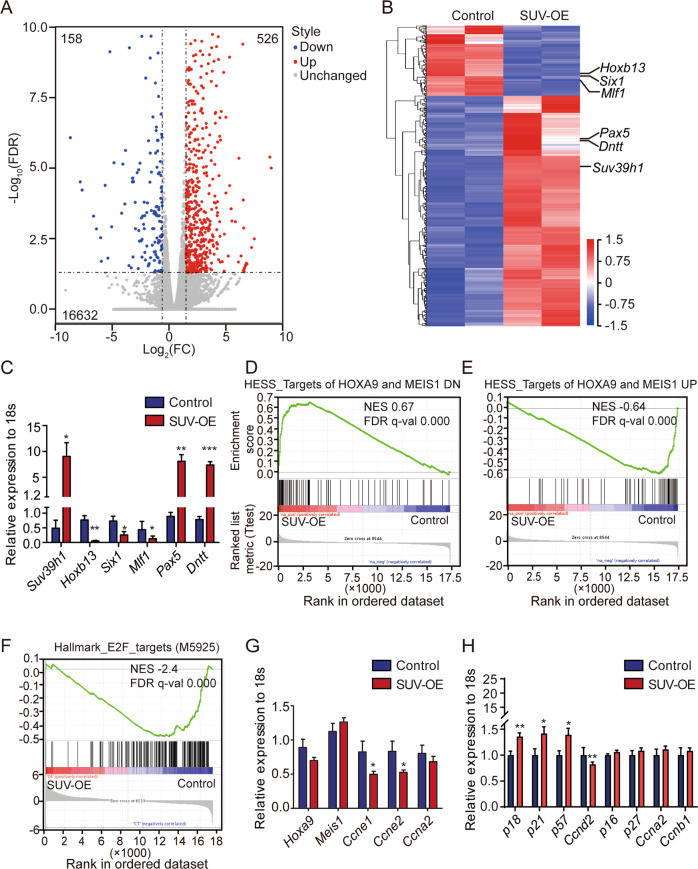
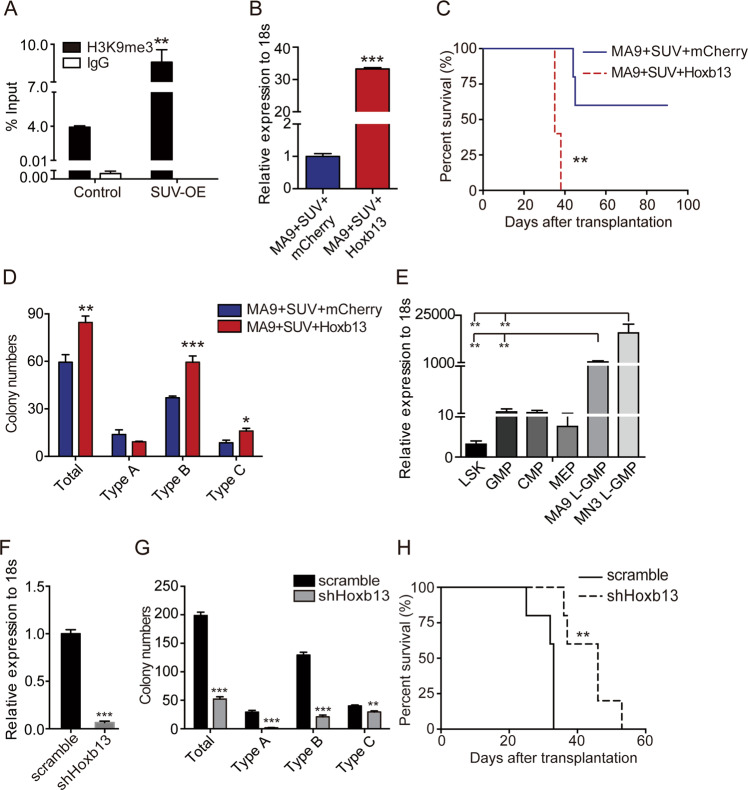
Epigenetic regulations play crucial roles in leukemogenesis and leukemia progression. SUV39H1 is the dominant H3K9 methyltransferase in the hematopoietic system, and its expression declines with aging. However, the role of SUV39H1 via its-mediated repressive modification H3K9me3 in leukemogenesis/leukemia progression remains to be explored. We found that SUV39H1 was down-regulated in a variety of leukemias, including MLL-r AML, as compared with normal individuals. Decreased levels of Suv39h1 expression and genomic H3K9me3 occupancy were observed in LSCs from MLL-r-induced AML mouse models in comparison with that of hematopoietic stem/progenitor cells. Suv39h1 overexpression increased leukemia latency and decreased the frequency of LSCs in MLL-r AML mouse models, while Suv39h1 knockdown accelerated disease progression with increased number of LSCs. Increased Suv39h1 expression led to the inactivation of Hoxb13 and Six1, as well as reversion of Hoxa9/Meis1 downstream target genes, which in turn decelerated leukemia progression. Interestingly, Hoxb13 expression is up-regulated in MLL-AF9-induced AML cells, while knockdown of Hoxb13 in MLL-AF9 leukemic cells significantly prolonged the survival of leukemic mice with reduced LSC frequencies. Our data revealed that SUV39H1 functions as a tumor suppressor in MLL-AF9-induced AML progression. These findings provide the direct link of SUV39H1 to AML development and progression.


Conflict of interest statement

The authors declare that they have no conflict of interest.

Figures

Fig. 1
Fig. 1. Differential expression of SUV39H1 and distribution of H3K9me3 in MLL-r AML LSCs in comparison with normal counterparts.
a Expression levels of SUV39H1 in our in-house collected samples: bone marrow (BM) CD34+ cells from donors and AML patients. Data are presented as means ± s.e.m., *P < 0.05, Student’s t test. b, c Expression levels of Suv39h1 in leukemic stem cell-enriched groups (defined as c-Kit+ in b, and as L-GMP, IL-7RLinSca-1c-Kit+CD34+CD16/32+ in c) isolated from two MLL-r AML mouse models compared with the expression in normal murine HSPCs. MA9, MLL-AF9; MN3, MLL-NRIP3 (see Materials and Methods). Data are presented as means ± s.e.m., n = 3, *P < 0.05, **P < 0.01, Student’s t test. d Heat maps showing ChIP-seq signal of H3K9me3 at TSSs ± 2 kb regions for all genes in c-Kit+ cells isolated from WT or MLL-r leukemic mice. e Box plots showing changes in ChIP-seq signals of H3K9me3 at TSSs ± 2 kb regions of genome in c-Kit+ cells isolated from WT or MLL-r leukemic mice. ***P < 0.001, Wilcoxon test.
Fig. 2
Fig. 2. Restoring SUV39H1 expression suppressed leukemic progression of MLL-AF9-induced murine AML.
a Experimental scheme of establishing Suv39h1 overexpressing (SUV-OE) and control murine AML models. b Immunoblot analysis of Suv39h1 and H3K9me3 levels in whole BM cells from control or SUV-OE tertiary recipients. Densitometry was determined by ImageJ, n = 2. c, d Kaplan–Meier survival curve of secondary recipients (transplanted with P0 cells, 1 × 103 cells per group for (c) and 1 × 104 cells per group for (d). n = 10, **P < 0.01, ***P < 0.001, Mantel–Cox test. e, f Kaplan–Meier survival curve of tertiary recipients (transplanted with P1 cells, 1 × 103 cells per group for (e) and 5 × 103 cells per group for (f). n = 10, ***P < 0.001, Mantel–Cox test.
Fig. 3
Fig. 3. SUV39H1 overexpression reduced the frequency of leukemia stem cells in MLL-AF9-induced murine AML.
a, c Cell frequency analyses of c-Kit+ (a) and L-GMP (c) in bone marrow (BM) and spleen (SP) from moribund tertiary recipients using flow cytometry. n = 6, ***P < 0.001, Student’s t test. b, d Absolute cell number of c-Kit+ (b) and L-GMP (d) in BM and SP from moribund tertiary recipients. Leukemic cells were collected from femur, tibia and ilium (for BM) and whole SP (for SP), and dead cells were excluded using Trypan blue staining. n = 6, ***P < 0.001, Student’s t test. e, f Limiting dilution assay estimation of LSC frequency of P0 (e) and P1 (f) AML cells. Left panels: Logarithmic plot showing the percentage of non-responding recipients transplanted with different cell doses of eGFP+ P0 (e) and P1 (f) BM cells. Right panels: Table showing the number of recipients that developed leukemia and total number of recipients transplanted per cell dose. The chi-squared test was used. **P < 0.01, ***P < 0.001.
Fig. 4
Fig. 4. Increase expression of Suv39h1 induced apoptosis and suppressed proliferation of leukemia cells.
a, b Apoptosis analyses of c-Kit+ (a) and L-GMP (b) LSCs in BM and SP from moribund tertiary recipients. n = 7 for each group. *P < 0.05, **P < 0.01, Student’s t test. c Representative flow cytometric analysis of cell cycle of L-GMP in BM from tertiary recipients. d, e Quantification of G0, G1 and S/G2/M phases of c-Kit+ (d) and L-GMP (e) cells in BM and SP from tertiary recipients. n = 7 for each group. *P < 0.05, **P < 0.01, ***P < 0.001, Student’s t test. f Flow cytometry was used to evaluate proliferation of leukemia stem cells (L-GMP) in SUV-OE (n = 8) and Control (n = 9) mice (BrdU incorporation assay). g Quantification of G0/G1, S and G2/M phases of L-GMP cells in BM (f). *P < 0.05, **P < 0.01, Student’s t test.
Fig. 5
Fig. 5. Chaetocin treatment or Suv39h1 knockdown accelerated AML progression.
a Experimental scheme of chaetocin treatment. Mice were sub-lethally irradiated, and transplanted with MA9 P2 AML cells. Chaetocin treatment started at 1 day after transplantation. Intraperitoneal (ip) injections were done every 2 days. b Kaplan–Meier survival curve. Mice were treated as described in (a). Median survival: 25.5 days for DMSO group, 22 days for both dosages of chaetocin groups. n = 5 for each group. Mantel–Cox test, *P < 0.05 for 0.25 mg/kg chaetocin group only. c Kaplan–Meier survival curve. Mice were treated as described in (a). Median survival: 28 days for DMSO group, 23.5 days for chaetocin group. n = 12 for each group. Mantel–Cox test, ***P < 0.0001. d, e Immunoblot analyses of Suv39h1 level in whole BM cells from control or shSUV primary recipients (d for shSuv-a and e for shSuv-b). Densitometry was determined by ImageJ. f, g Kaplan–Meier survival curves of secondary (transplanted with P0 cells, 2 × 104 cells per group, (f) for shSuv-a and (g) for shSuv-b) recipients. n = 6 for each group, Mantel–Cox test *P < 0.05 for shSuv-a. h, i Colony-forming assays of BM leukemic cells from secondary recipients (h for shSuv-a and i for shSuv-b); n = 4, *P < 0.05, ***P < 0.001, Student’s t test.
Fig. 6
Fig. 6. Suv39h1 overexpression resulted in dysregulation of transcriptional program involved in leukemia.
a Control and SUV-OE P1 AML c-Kit+ cells from moribund mice were used for RNAseq analysis. Volcano plot of the transcriptome profile is presented. Red dots and blue dots represent differentially expressed genes (DEGs) with a log2FC ≥ 1 and FDR < 0.05 (DESeq2) or log2FC ≤ −1 and FDR < 0.05, respectively, and black dots represent genes with no significant differences between control and SUV-OE. n = 2 per group. b Heatmap showing the DEGs, |log2FC| ≥ 1, FDR < 0.05 between control and SUV-OE AML c-Kit+ cells using RNAseq analysis. c, g Quantitative RT-PCR analysis of DEGs revealed using RNA-Seq in control and SUV-OE c-Kit+ cells. Data are presented as the means ± s.e.m., n = 3, *P < 0.05, **P < 0.01, ***P < 0.001, Student’s t test. d, e Gene set enrichment analysis demonstrating increased gene expression of the down-regulated targets and decreased expression of upregulated targets of HOXA9 and MEIS1 in SUV-OE groups compared with the expression in controls. NES (nominal enrichment score), FDR (false discovery rate). f Gene set enrichment analysis showing decreased expression of hallmark of E2F targets in SUV-OE groups compared with the expression in controls. h qRT-PCR analysis of cell cycle related genes. Data are presented as the means ± s.e.m., n = 3, *P < 0.05, **P < 0.01, ***P < 0.001, Student’s t test.
Fig. 7
Fig. 7. Hoxb13 functioned as a downstream effector of SUV-OE and regulated MA9 AML progression.
a H3K9me3 ChIP-qPCR analysis of Hoxb13 promoter in c-Kit+ cells from control and SUV-OE AML mice. Data are presented as the means ± s.e.m., n = 3, **P < 0.01, Student’s t test. b Quantitative RT-PCR analysis of Hoxb13 level in SUV-OE cells with Hoxb13-OE (MA9 + SUV + Hoxb13). Control cells were obtained in parallel with Hoxb13-OE cells (MA9 + SUV + mcherry). Data are presented as the means ± s.e.m., n = 3, ***P < 0.001, Student’s t test. c Kaplan–Meier survival curve of secondary recipients transplanted with leukemia cells; 1 × 103 cells per group, n = 6, **P < 0.01, Mantel–Cox test. d Colony-forming assay of MA9 + SUV + Hoxb13 and control cells from secondary recipients; n = 4, *P < 0.05, **P < 0.01, ***P < 0.001, Student’s t test. e qRT-PCR analysis of Hoxb13 level in normal murine HSPCs and leukemia stem cells from MLL-r leukemic mice. n = 3, *P < 0.05, **P < 0.01, Student’s t test. f Hoxb13 expression levels in MA9 AML cells with mock shRNA or shHoxb13 (knockdown). n = 3, ***P < 0.001, Student’s t test. g Number of colonies of MA9 AML cells with Hoxb13 knockdown (shHoxb13) or controls; n = 4, **P < 0.01, ***P < 0.001, Student’s t test. h Kaplan–Meier curves of secondary recipients transplanted with MA9-sh-scramble or with MA9-shHoxb13 cells, 33 days vs. 46 days, respectively; 1 × 104 cells for each group (n = 10 per group), **P < 0.01, Log-rank (Mantel–Cox) test.

Similar articles

Cited by

References

    1. Tsai CT, So CW. Epigenetic therapies by targeting aberrant histone methylome in AML: molecular mechanisms, current preclinical and clinical development. Oncogene. 2017;36:1753–9. - PMC - PubMed
    1. Zeisig BB, Kulasekararaj AG, Mufti GJ, So CW. SnapShot: acute myeloid leukemia. Cancer Cell. 2012;22:698–698. - PubMed
    1. Kandoth C, McLellan MD, Vandin F, Ye K, Niu B, Lu C, et al. Mutational landscape and significance across 12 major cancer types. Nature. 2013;502:333–9. - PMC - PubMed
    1. Fraga MF, Ballestar E, Villar-Garea A, Boix-Chornet M, Espada J, Schotta G, et al. Loss of acetylation at Lys16 and trimethylation at Lys20 of histone H4 is a common hallmark of human cancer. Nat Genet. 2005;37:391–400. - PubMed
    1. Fong CY, Morison J, Dawson MA. Epigenetics in the hematologic malignancies. Haematologica. 2014;99:1772–83. - PMC - PubMed

Publication types

MeSH terms