. 2020 Dec 7;55(5):617-628.e6.
doi: 10.1016/j.devcel.2020.09.020. Epub 2020 Oct 9.

Inflammation of the Embryonic Choroid Plexus Barrier following Maternal Immune Activation

Affiliations

Inflammation of the Embryonic Choroid Plexus Barrier following Maternal Immune Activation

Jin Cui et al. Dev Cell. .

Abstract

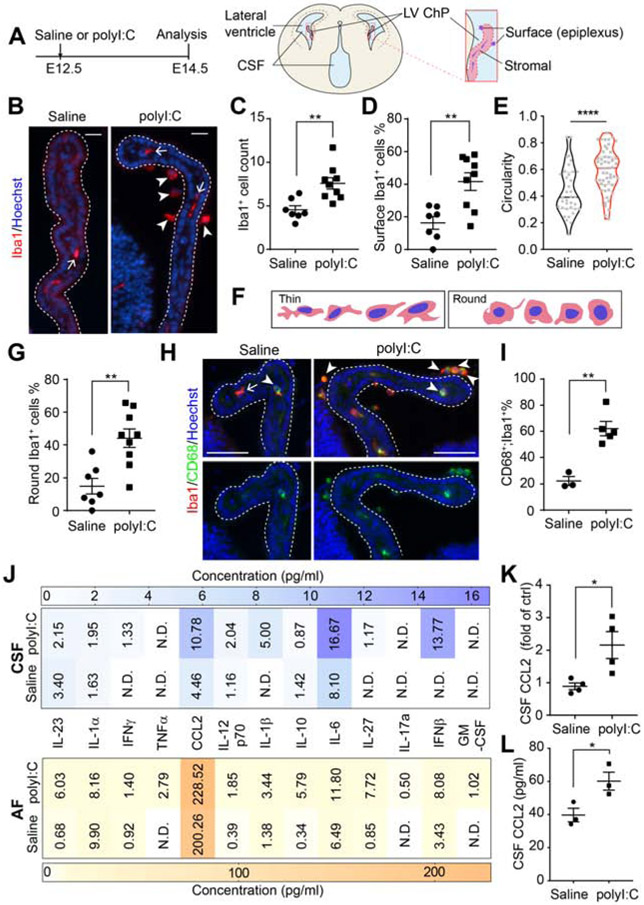
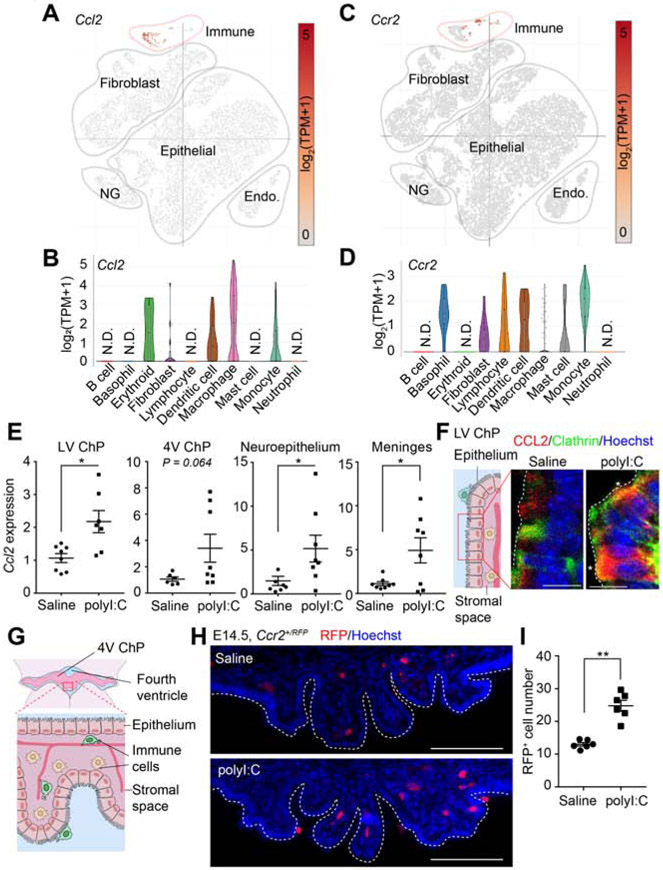
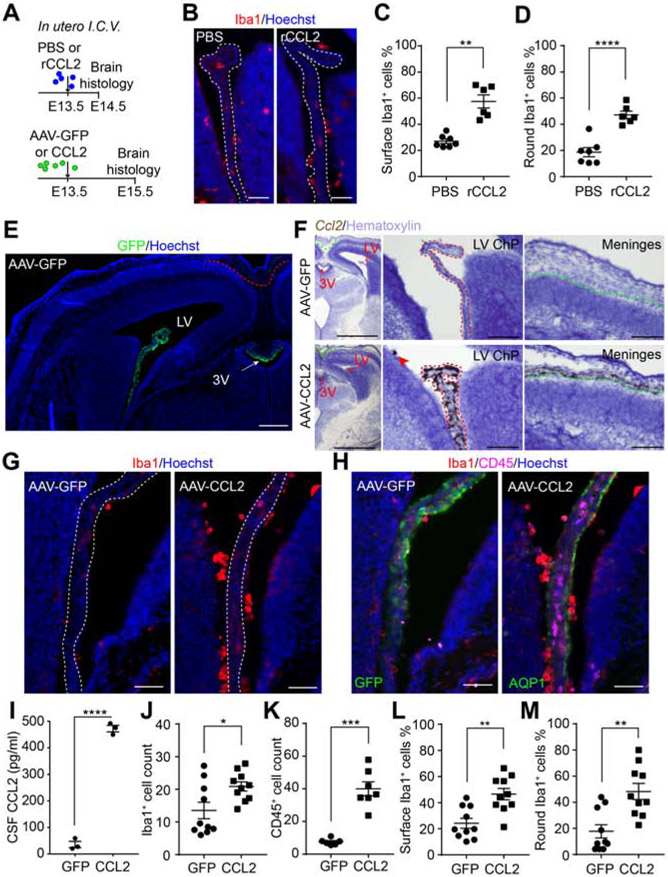
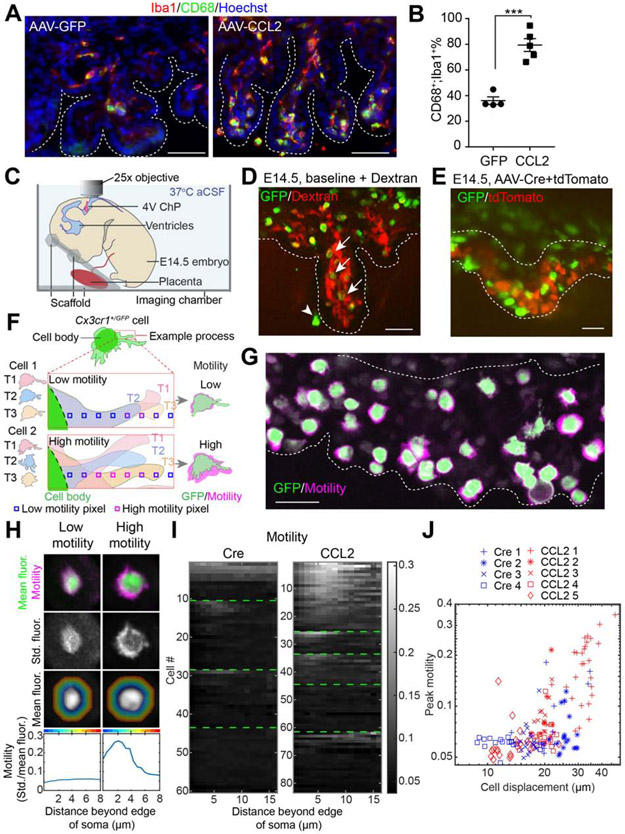
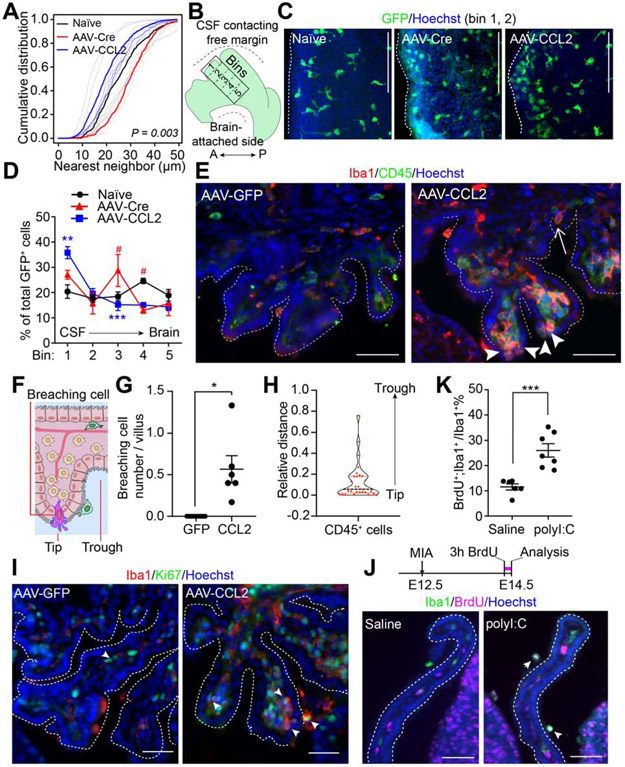
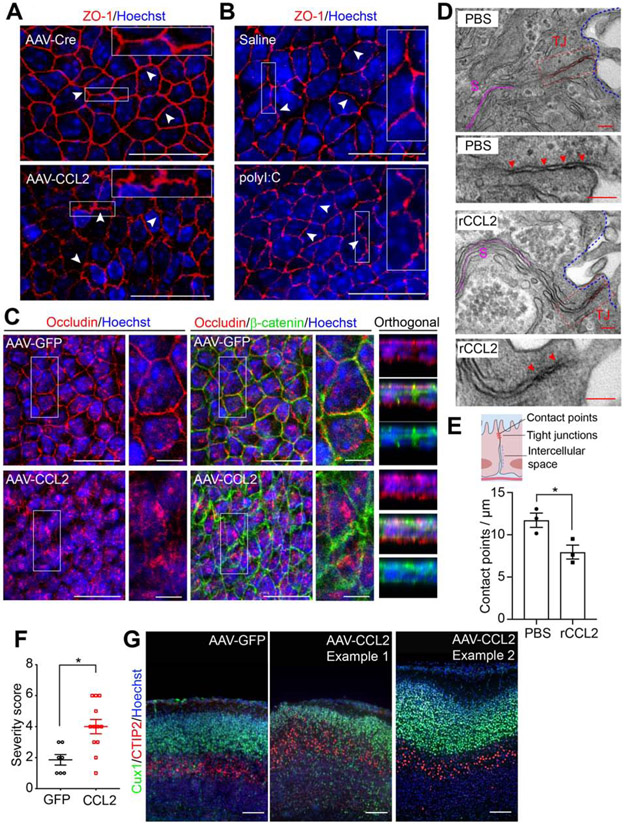
The choroid plexus (ChP) regulates brain development by secreting instructive cues and providing a protective brain barrier. Here, we show that polyI:C-mediated maternal immune activation leads to an inflammatory response in the developing embryonic mouse brain that manifests as pro-inflammatory cerebrospinal fluid (CSF) and accumulation of ChP macrophages. Elevation of CSF-CCL2 was sufficient to drive ChP immune cell recruitment, activation, and proliferation. In addition, ChP macrophages abandoned their regular tiling pattern and relocated to the ChP-free margin where they breached the weakened epithelial barrier. We further found that these immune cells entered from the ChP into the brain via anatomically specialized "hotspots" at the distal tips of ChP villi. In vivo two-photon imaging demonstrated that surveillance behaviors in ChP macrophages had already emerged at this early stage of embryogenesis. Thus, the embryonic ChP forms a functional brain barrier that can mount an inflammatory response to external insults.

Keywords: CCL2; cerebrospinal fluid; choroid plexus; cytokines; immune cells; maternal immune activation; neural development; two-photon imaging.


Conflict of interest statement

Declaration of Interests The authors declare no competing interests.

Figures

Figure 1.
Figure 1.. MIA triggers macrophage accumulation at the embryonic ChP and modifies CSF composition.
(A) Schematic of experimental paradigm and E14.5 brain. (B) LV ChP macrophages from saline- or polyI:C conditions. Arrow: macrophages in ChP stromal space; arrowheads: macrophages at ChP surface. Scale = 20 μm. (C) Iba1+ macrophage numbers per LV ChP. **P = 0.0030, unpaired t-test. (D) Percent of epiplexus ChP macrophages. **P = 0.0029, unpaired t-test. (E) Iba1+ macrophage circularity. ****P < 0.0001, unpaired t-test. Dashed lines: median and quartile values. Data points: individual cells. (F) Schematic depicting major morphological states of Iba1+ macrophages at E14.5. (G) Round ChP Iba1+ macrophages (% of total). **P = 0.0020, unpaired t-test. See also Figure S1F. (H) CD68+ macrophages from MIA E14.5 LV ChP Arrows: “thin” macrophage, CD68;Iba1+; arrowheads: “round” macrophages, CD68+;Iba1+. Scale = 50 μm. (I) Macrophages (Iba1+) that are phagocytic (CD68+;Iba1+, in %) in (H) (% of total). **P = 0.0021, unpaired t-test. (J) Cytokines and chemokines in E14.5 CSF and AF. n ≥ 4 litters per group. (K) Relative changes in CCL2 in CSF samples from (J). *P = 0.025, unpaired t-test. (L) E14.5 CSF [CCL2] analyzed by sandwich ELISA. n = 3 litters per group, *P = 0.0039, unpaired t-test. All data presented as mean ± S.E.M., except in (J) where mean values are presented. See also Figure S1, Tables S1-S2.
Figure 2.
Figure 2.. MIA is accompanied by increased CCL2-CCR2 signaling at the ChP-CSF barrier.
(A) Ccl2 and (B) Ccr2 expression in E16.5 ChP from Dani et al., bioRxiv, 2019. Endo: endothelial cells; NG: neuroglia. (C-D) Violin plots showing Ccl2 (C) and Ccr2 (D) expression in embryonic ChP immune cell subclusters from Dani et al., bioRxiv, 2019. (E) Ccl2 expression (qRT-PCR) in CSF-contacting tissue following MIA, normalized to saline. LV ChP: *P = 0.016; Neuroepithelium, *P = 0.031; Meninges: *P = 0.033 Welch’s t-test. One outlier in polyI:C LV ChP sample and one outlier in saline neuroepithelium sample were removed using the ROUT method (Q = 1%). (F) ChP schematic and representative images of CCL2 cellular distribution in LV ChP. Asterisks: co-localization of CCL2 and Clathrin. Scale = 10 μm. See also Figure S2D for antibody validation. (G) E14.5 4V ChP schematic. (H) Ccr2+/RFP monocytes in 4V ChP of MIA E14.5 Ccr2+/RFP samples. Scale = 100 μm. (I) Ccr2+/RFP monocyte numbers (per LV ChP) for (H). ****P < 0.0001, unpaired t-test. All data presented as mean ± S.E.M. See also Figure S2.
Figure 3.
Figure 3.. CSF-CCL2 supplementation stimulates immune cell accumulation at the ChP.
(A) Schematic of in utero ICV injection paradigm. (B) ChP macrophages in PBS or rCCL2. (C-D) Cell location (C) and shape (D) of macrophages in (B). (C) Epiplexus macrophages (% of total). **P = 0.0011, Welch’s t-test. (D) Round macrophages (% of total). ****P < 0.0001, unpaired t-test. (E) Representative image of E15.5 AAV-GFP brain, 48 h post infection. Red dashed line: meninges where no GFP signal was observed using the viral transduction paradigm illustrated in (A). Scale = 200 μm. (F) Representative image of Ccl2 RNAscope in situ hybridization of untreated or AAV-CCL2 E15.5 section. Representative 4x images of brain sections for AAV-GFP or AAV-CCL2 condition (left; Scale = 1 mm) and representative 20x images showing LV ChP (middle; scale = 100 μm) and meninges (right; scale = 100 μm). Red dashed line: epithelial cells of LV ChP where Ccl2 transcript was most enriched in AAV-CCL2 samples; green dashed line: meninges where Ccl2 transcript was detected but at lower levels than in LV ChP epithelial cells from AAV-CCL2 samples. (G-H) LV ChP macrophages (G) and immune cells (H) in AAV-GFP or -CCL2 conditions. (I) CSF CCL2 concentrations; n = 3 litters/condition. ****P < 0.0001, unpaired t-test. (J-K) LV ChP Iba1+ (J) and CD45+ (K) cell numbers in each condition. ***P = 0.0002, Welch’s t-test. *P = 0.0195, unpaired t-test. (L-M) Location (L) and shape (M) of Iba1+ cell in (G). (L) Epiplexus macrophages (% of total). **P = 0.011, unpaired t-test. (M) Round macrophages (% of total). **P = 0.012, unpaired t-test. Scale = 50 μm. All data presented as mean ± S.E.M. See also Figure S3.
Figure 4.
Figure 4.. Visualizing immune cells at the developing ChP.
(A) Phagocytic macrophages at E15.5 4V ChP Scale = 50 μm. (B) Phagocytic 4V ChP macrophages (CD68+;Iba1+; % of total Iba1+), mean ± S.E.M. ***P = 0.0002, unpaired t-test. (C) Schematic of imaging setup. (D) Z-projection of E14.5 4V ChP across time-averaged imaging volume of GFP+ cells and Dextran-labeled ChP vasculature from a naive Cx3cr1+/GFP sample. Arrows: GFP+ cells in the stromal region of 4V ChP. Arrowhead: GFP+ cell at 4V ChP tissue surface (epiplexus cell). Scale = 50 μm. (E) Z-projection image of E14.5 4V ChP GFP+ macrophages and tdTomato+ epithelial cells from a Cx3cr1+/GFP sample. Images taken 1 day after in utero ICV delivery of AAV-Cre (control) and AAV-tdTomato (mixture ratio of Cre : tdTomato = 5 : 1). Data are from recordings averaging 30-minutes. Scale = 50 μm. Dashed white lines: 4V ChP boundaries. (F) Schematic of cells exhibiting low (Cell 1) or high (Cell 2) motility. Low motility cells showed limited movement of processes, leading to a smaller motility “halo” than high-motility cells. (G) ChP macrophages with estimated motility “halos” (see below), from an AAV-CCL2 + AAV-tdTomato Cx3cr1+/GFP sample. (H) Procedure for estimating motility in low- and high-motility cells. Top row: mean cell body fluorescence (green) and standard deviation of bandpass filtered fluorescence across time, at each pixel (motility “halo,” magenta). Second row: standard deviation of bandpass-filtered fluorescence. Third row: Mean cell body fluorescence. Regions with the same pseudocolor hue indicate pixels with a similar distance from the outer edge of the cell body (up to 8 μm away; see also hollow squares in F). Bottom row: for all pixels at a given distance from the outer edge of the cell (cf. colors at top of panel), we calculated the average of the standard deviation (third row) normalized by mean fluorescence (second row). This showed that the example cell at right (a “High motility” cell from the CCL2 condition) had elevated motility of processes peaking at 2-3 μm from the cell border. (I) Heatmap of motility (same estimate as bottom row of H) for every imaged cell in Cre and CCL2 conditions (1 cell / row). For each sample, rows were sorted by the cell’s peak motility. Green lines separate data from different samples (Cre: n = 66 cells from 4 individuals; CCL2: n = 89 cells from 5 individuals). Cells from the first sample of each condition correspond to cells in Video S7. Gray scale indicates motility score. (J) Relationship between cell displacement and peak motility for each cell for all samples (with a different symbol for each individual) and conditions (CCL2 and Cre; see Methods). We noted a trend to greater displacement and mobility for CCL2 vs. Cre conditions. However, these differences may be due, in part, to overall variability across individuals. Indeed, we could not determine whether the CCL2 vs. control condition had a significant effect on motility (P = 0.33) or displacement (P = 0.67) when accounting differences across individuals using a normally distributed generalized linear mixed effects model (GLMM) with an identity link function, with the category type as a predictive variable and the sample number as a fixed effect. We also asked whether displacement and motility were correlated and found that the level of motility strongly predicted that of displacement (P < 0.0001) even when accounting for sample number (using a normally distributed GLMM with an identity link function, with the displacement as a predictive variable and both the sample number as a fixed effect). See also Figure S4, Videos S1-7.
Figure 5.
Figure 5.. ChP barrier properties are altered by CSF composition.
(A-E) Macrophage distribution analysis of LV ChP explants of naïve (untreated), AAV-Cre (AAV control), and AAV-CCL2 Cx3cr1+/GFP conditions. (A) Cumulative distribution of nearest-neighbor distances across GFP+ immune cells indicates that differences between groups are statistically significant (studentized permutation test, P = 0.003). See also Figure S5C. (B) Schematic depicting LV ChP explant and binned areas for cell counting. A, Anterior; P, Posterior. (C) Cx3cr1+/GFP LV ChP explants from each condition. (D) GFP+ cell numbers from bin #1 (CSF-contacting region) to bin #5 (brain-proximal region). GFP+ cell density (% of total GFP+ cells across bins). AAV-Cre vs. AAV-CCL2: ** P = 0.037 (Bin #1), *** P = 0.0009 (Bin #3); AAV-Cre vs. naive: # P = 0.0017 (Bin #3), # P = 0.0017 (Bin #4). All other P-values > 0.05. n = 3 for naive and AAV-Cre, n = 6 for AAV-CCL2, two-way ANOVA, P values corrected for multiple comparisons by Holm-Sidak test. Scale = 100 μm. (E) Immune cells (CD45, pseudocolored in green) breaching 4V ChP epithelium. In AAV-GFP condition, CD45+ cells were mostly seen in the 4V ChP stromal space. In AAV-CCL2 condition, Iba1+ and CD45+ cells were in stromal space, on the ChP surface, and between epithelial cells (arrowheads). Dashed lines: 4V ChP. Arrowheads: putative transmigrating immune cells at distal tip of 4V ChP villi. Arrow: transmigrating immune cell at trough between 4V ChP villi. Scale = 50 μm. (F) Schematic depicting a breaching immune cell. (G) Number of cells breaching the barrier per ChP villus: GFP = 0, n = 9; CCL2 = 0.57 ± 0.16, n = 6. * P = 0.018 Welch’s t-test. (H) Violin plots and individual cell data illustrating the distribution of relative distances of the “barrier breaching” CD45+/hi cells from the distal tip of the adjacent 4V ChP villus (‘0’: cell at tip; ‘1’: cell at trough). 65.5% of cells had a relative distance of ≤ 0.1 from the tip of the villus, 6.9% cells had relative distance ≥ 0.5, n = 29 cells from 6 AAV-CCL2 individuals. (I) Proliferating (Ki67, green pseudocolored) immune cells (Iba1, red) in 4V ChP of AAV-GFP or AAV-CCL2 individuals. Arrowheads in I, J: BrdU+;Iba1+ cells. Scale bars = 50 μm. (J) Top: schematic of BrdU labeling. Bottom: LV ChP BrdU+ and Iba1+ staining related to (K). (K) Iba1+ cells that are BrdU+ (% of total). ***P = 0.0006, unpaired t-test. Scale = 50 μm. All data presented as mean ± S.E.M. except in (H). See also Figure S5.
Figure 6.
Figure 6.. ChP barrier properties and embryonic brain development are altered by CSF-CCL2 augmentation.
(A-B) Mean z-projection images showing ZO-1 staining of LV ChP explants from (A) AAV-GFP or -CCL2 conditions, and (B) E14.5 control or MIA conditions. Arrowheads: representative staining patterns; scale = 20 μm. (C) Representative mean z-projection images, and orthogonal images of boxed areas showing Occludin and β-catenin staining. Scale = 20 μm, or 5 μm in close-up views. For each condition in (A) to (C), two regions of interest per explant were examined, and whole mount LV ChP explants of n ≥ 3 individuals from two litters were scanned and assessed. (D) EM of tight junctions (TJ) between ChP epithelial cells from PBS or recombinant CCL2 (rCCL2) conditions. Scale = 100 nm. TJ: red; intercellular space (S): magenta; arrowheads: contact points; blue dashed lines: CSF-facing apical surface of the LV ChP (E) Top: schematic showing TJ between ChP epithelial cells. Bottom: number of contact points per μm. LV ChP samples from n = 3 individuals, at least 10 TJ per sample were analyzed, *P = 0.033, unpaired t-test. (F) P0 cortical disorganization severity scores. n = 7 from two litters for AAV-GFP, and n = 12 from three litters for AAV-CCL2. ** P = 0.0048, unpaired t-test. (G) Representative zoomed-in images showing cortical disorganization patches of P0 samples from (F). Scale = 100 μm. See also Figure S6.

Comment in

References

    1. Abdallah MW, Larsen N, Grove J, Nørgaard-Pedersen B, Thorsen P, Mortensen EL, and Hougaard DM (2012). Amniotic fluid chemokines and autism spectrum disorders: An exploratory study utilizing a Danish Historic Birth Cohort. Brain. Behav. Immun 26, 170–176. - PubMed
    1. Ashwood P, Wills S, and Van de Water J (2006). The immune response in autism: a new frontier for autism research. J. Leukoc. Biol 80, 1–15. - PubMed
    1. Baddeley A, Rubak E, and Turner R (2016). Spatial Point Patterns: Methodology and Applications with R (CRC Press Taylor & Francis Group, LLC; ).
    1. Barman M, Unold D, Shifley K, Amir E, Hung K, Bos N, and Salzman N (2008). Enteric Salmonellosis Disrupts the Microbial Ecology of the Murine Gastrointestinal Tract. 76, 907–915. - PMC - PubMed
    1. Baruch K, Deczkowska A, David E, Castellano JM, Miller O, Kertser A, Berkutzki T, Barnett-Itzhaki Z, Bezalel D, Wyss-Coray T, et al. (2014). Aging-induced type I interferon response at the choroid plexus negatively affects brain function. Science (80-. ). 346, 89–93. - PMC - PubMed

Publication types

LinkOut - more resources