. 2020 Oct 29;183(3):818-834.e13.
doi: 10.1016/j.cell.2020.09.015. Epub 2020 Oct 9.

Key Parameters of Tumor Epitope Immunogenicity Revealed Through a Consortium Approach Improve Neoantigen Prediction

Collaborators, Affiliations

Key Parameters of Tumor Epitope Immunogenicity Revealed Through a Consortium Approach Improve Neoantigen Prediction

Daniel K Wells et al. Cell. .

Abstract

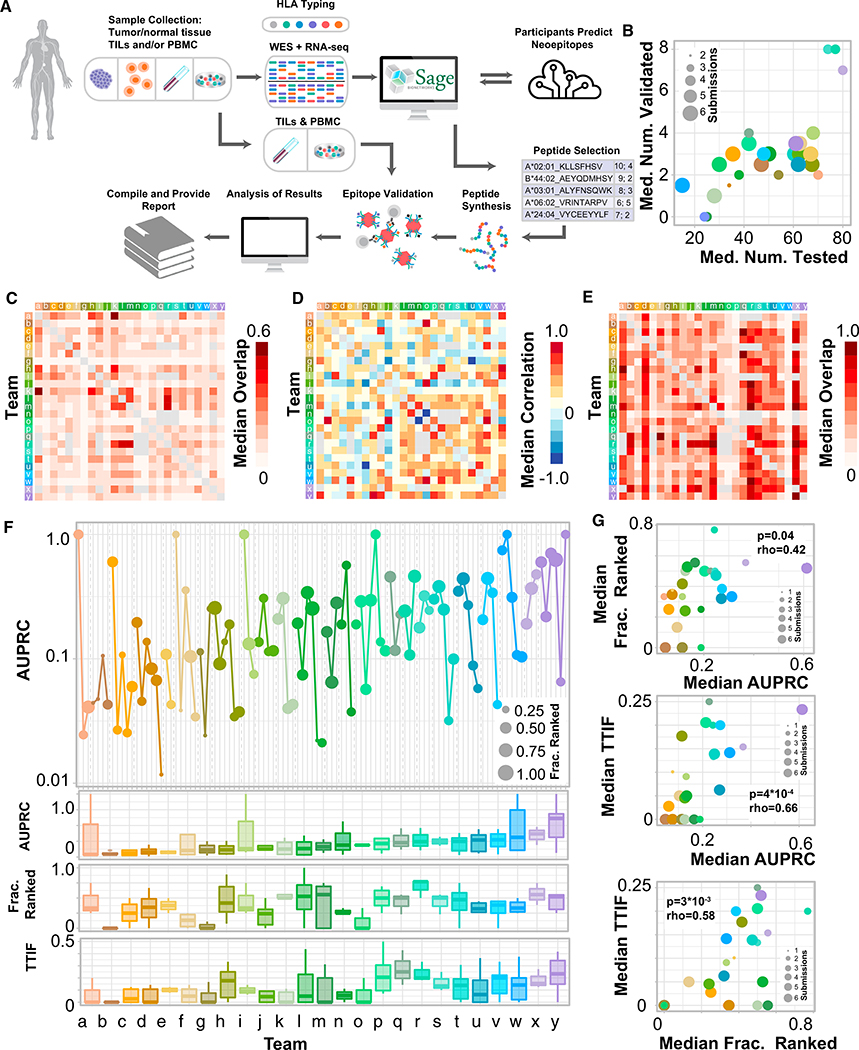
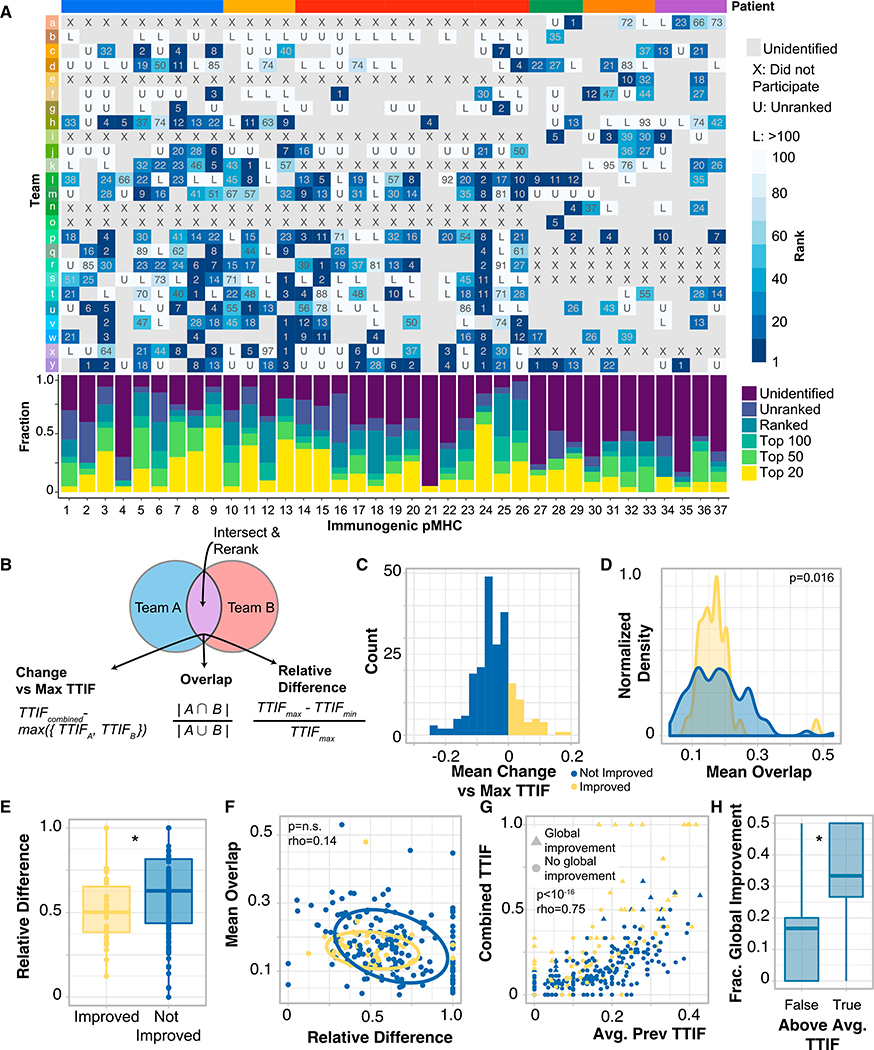
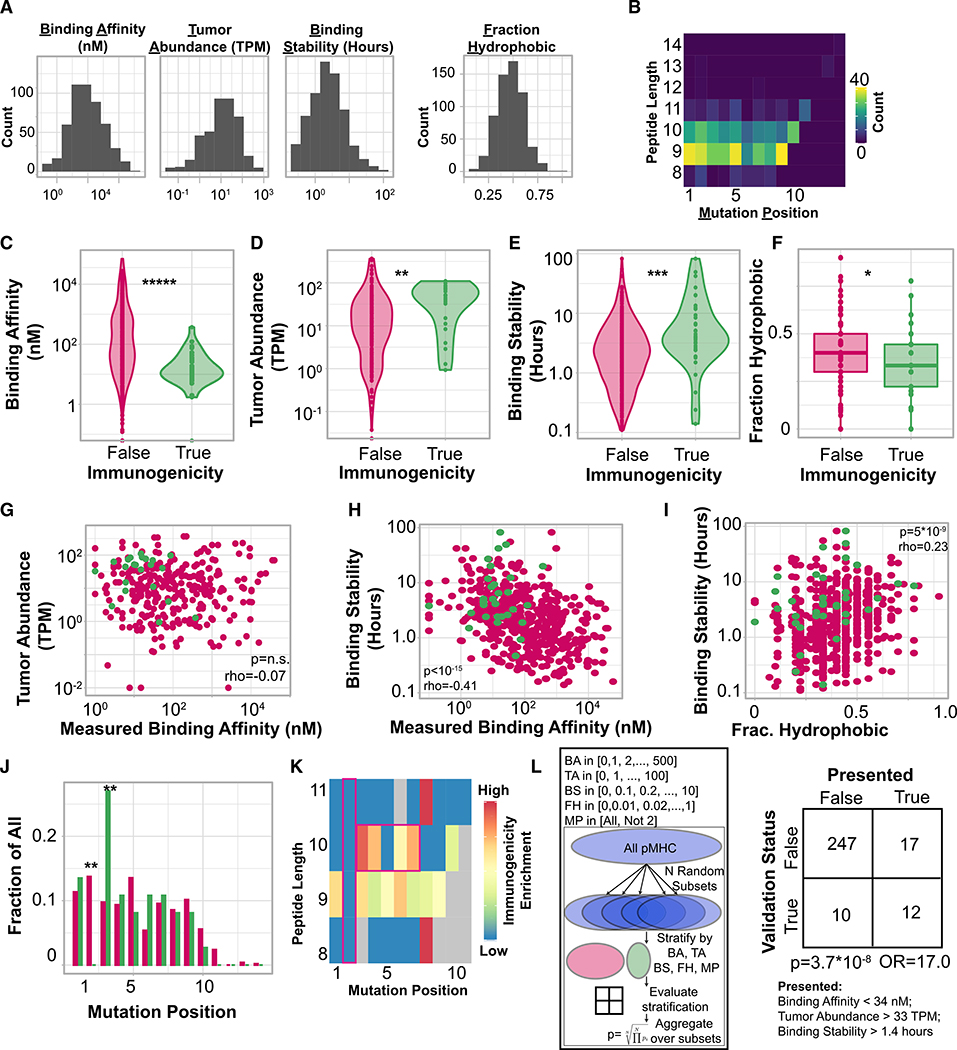
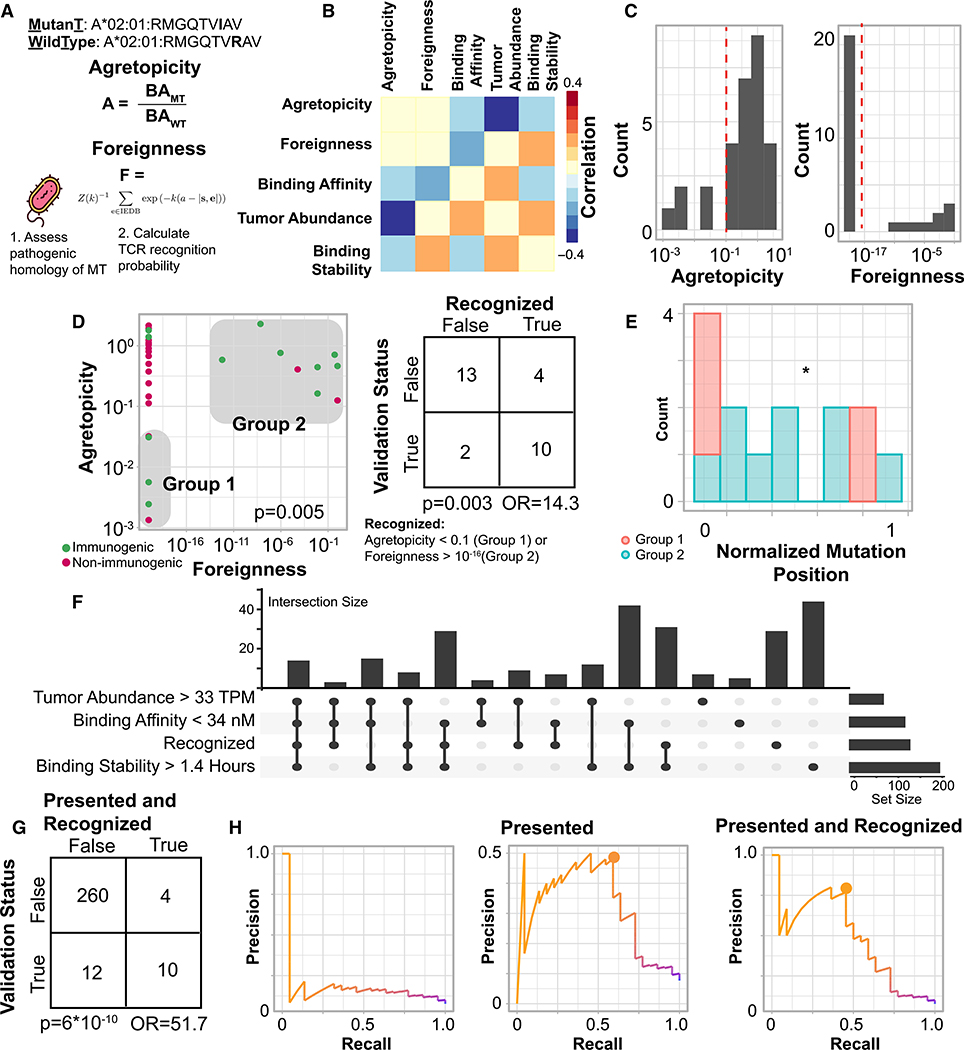
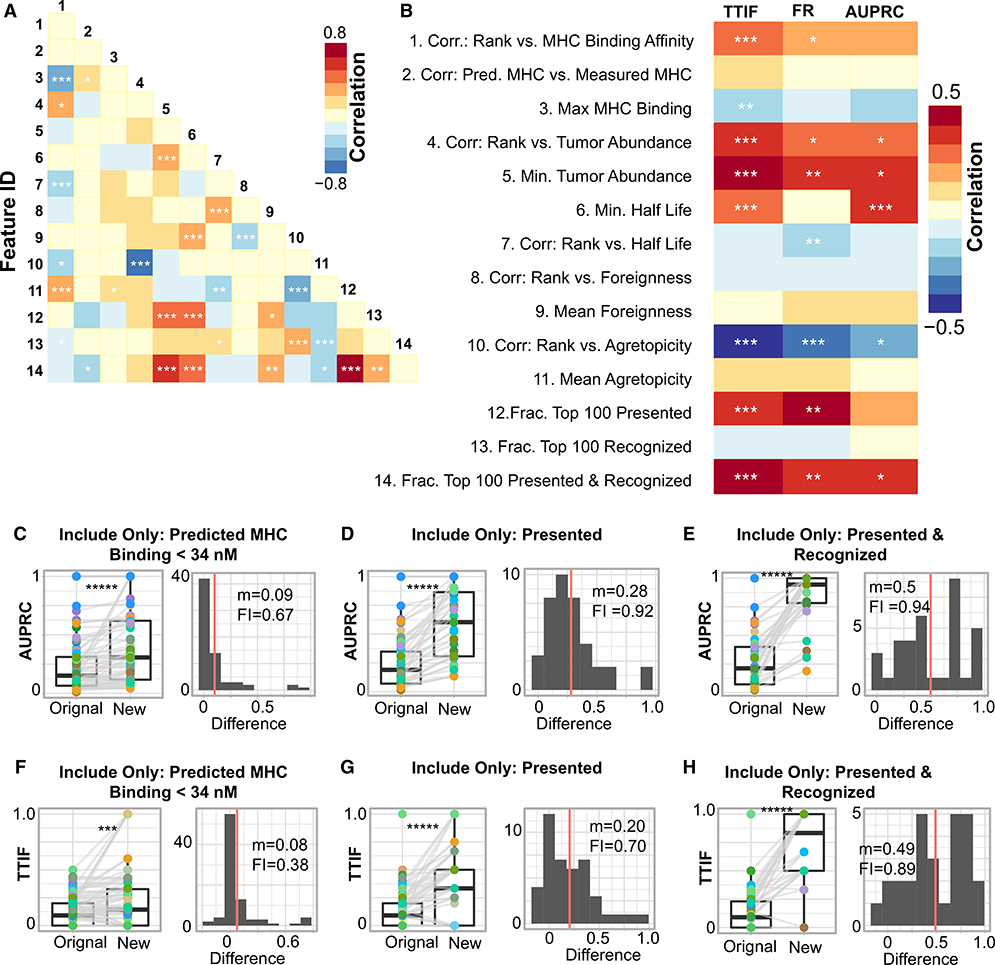
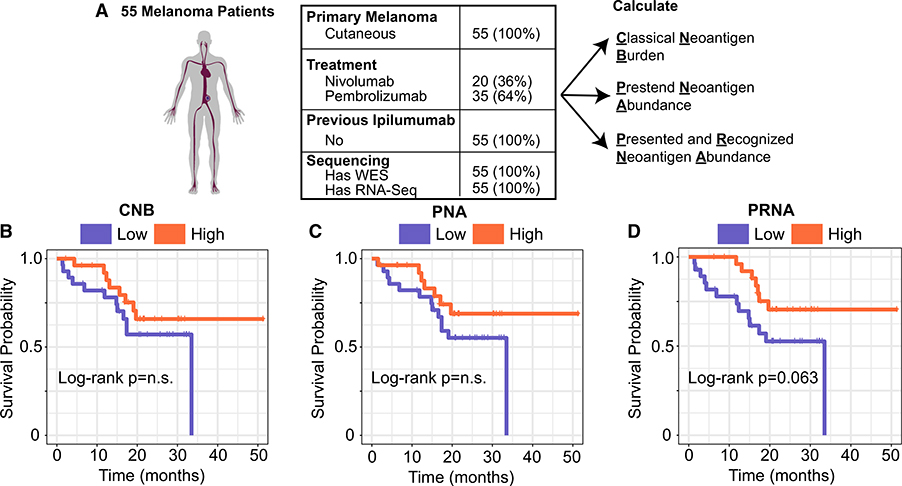
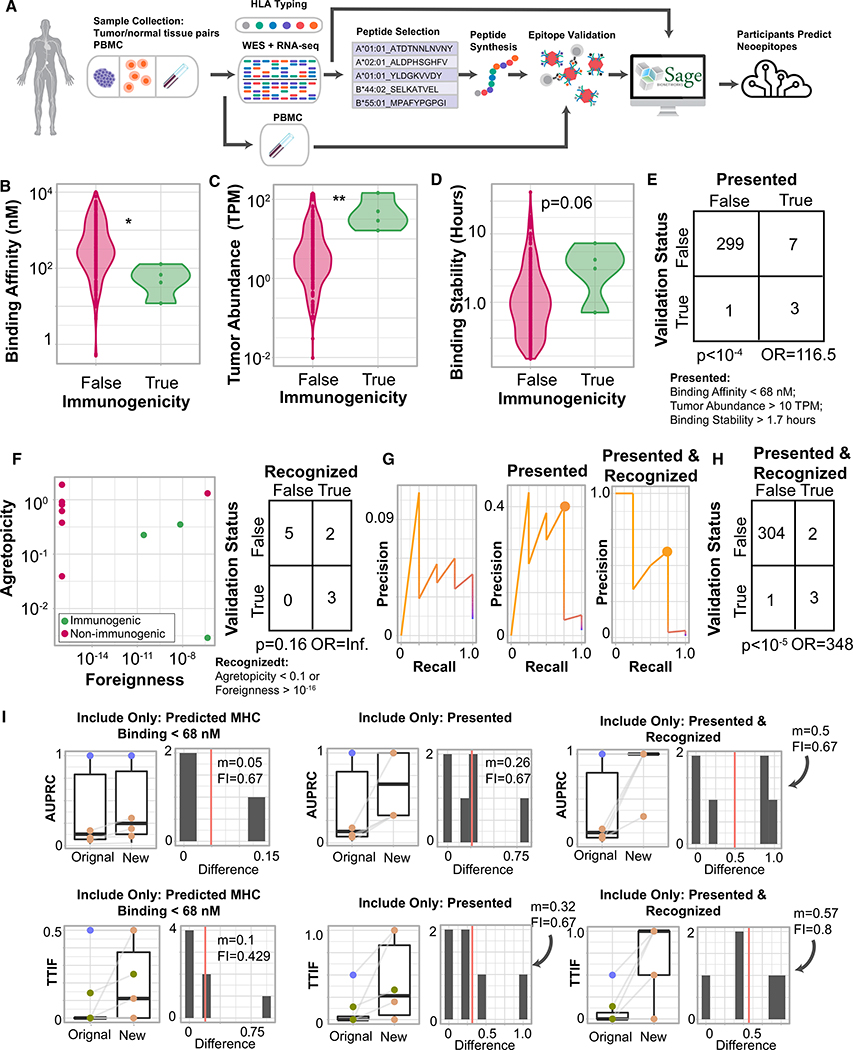
Many approaches to identify therapeutically relevant neoantigens couple tumor sequencing with bioinformatic algorithms and inferred rules of tumor epitope immunogenicity. However, there are no reference data to compare these approaches, and the parameters governing tumor epitope immunogenicity remain unclear. Here, we assembled a global consortium wherein each participant predicted immunogenic epitopes from shared tumor sequencing data. 608 epitopes were subsequently assessed for T cell binding in patient-matched samples. By integrating peptide features associated with presentation and recognition, we developed a model of tumor epitope immunogenicity that filtered out 98% of non-immunogenic peptides with a precision above 0.70. Pipelines prioritizing model features had superior performance, and pipeline alterations leveraging them improved prediction performance. These findings were validated in an independent cohort of 310 epitopes prioritized from tumor sequencing data and assessed for T cell binding. This data resource enables identification of parameters underlying effective anti-tumor immunity and is available to the research community.

Keywords: TESLA; epitope; immunogenicity; immunogenomics; immunotherapy; neoantigen.


Conflict of interest statement

Declaration of Interests D.K.W. is a paid scientific advisor and shareholder in Immunai and receives research support from Bristol-Myers Squibb. M.M.v.B. is a stockholder and employee of BioNTech. V.M.H.-L. is an unpaid scientific advisor and holds equity in FX Biopharma. B.C.-A. has a contract grant with Kite Pharma and is a member of the Institutional Biosafety Committee (IBC) at Advarra Inc. N.H. is a stockholder in BioNTech, K.M.C. is a stockholder in Geneoscopy. J.Z. is an equity/stock holder and consultant to PACT Pharma. A.R. has received honoraria from consulting with Amgen, Bristol-Myers Squibb, Chugai, Genentech, Merck, Novartis, and Roche, is or has been a member of the scientific advisory board, and holds stock in Advaxis, Arcus Biosciences, Bioncotech Therapeutics, Compugen, CytomX, Five Prime, FLX-Bio, ImaginAb, Isoplexis, Kite-Gilead, Lutris Pharma, Merus, PACT Pharma, Rgenix, and Tango Therapeutics. M.D.H. receives research support from Bristol-Myers Squibb, has been a compensated consultant for Merck, Bristol-Myers Squibb, AstraZeneca, Genentech/Roche, Nektar, Syndax, Mirati, Shattuck Labs, Immunai, Blueprint Medicines, Achilles, and Arcus, received travel support/honoraria from AstraZeneca, Eli Lilly, and Bristol-Myers Squibb, has options from Shattuck Labs, Immunai, and Arcus, and has a patent filed by his institution related to the use of tumor mutation burden to predict response to immunotherapy (PCT/US2015/062208), which has received licensing fees from PGDx. P.K. is a consultant for Neon Therapeutics and Personalis. J.R.H. is board member and founder of Isoplexis and board member and founder of PACT. F.R. is an advisor/consultant to Equillium Bio, Good Therapeutics, SelectION, Inc., Cascade Drug Development Group, aTyr Pharma, and Lumos Pharma, and is a founder and holds equity in Sonoma Biotherapeutics. R.D.S. is a cofounder, scientific advisory board member, stockholder, and royalty recipient of Jounce Therapeutics and Neon Therapeutics and is a scientific advisory board member for A2 Biotherapeutics, BioLegend, Codiak Biosciences, Constellation Pharmaceuticals, NGM Biopharmaceuticals, and Sensei Biotherapeutics. J.S. and A.S. receive funding from BMS and Gritstone, are consultants for Turnstone, and perform fee-for-service assays for Neon. A.S. is a consultant for Gritstone. N.B. receives research funds from Novocure, Celldex, Ludwig institute, Genentech, Oncovir, Melanoma Research Alliance, Cancer Research Institute, Leukemia & Lymphoma Society, 485, NYSTEM, and Regeneron, and is on the advisory boards of Neon, Tempest, Checkpoint Sciences, Curevac, Primevax, Novartis, Array BioPharma, Roche, and Avidea. T.N.S. receives research funds from Merck KGaA, is consultant/advisory board member for Adaptive Biotechnologies, AIMM Therapeutics, Allogene Therapeutics, Merus, Neogene Therapeutics, Neon Therapeutics, Scenic Biotech, and Third Rock Ventures, and is a stockholder in AIMM Therapeutics, Allogene Therapeutics, BioNTech, Merus, Neogene Therapeutics, Scenic Biotech, and Third Rock Ventures Fund IV and V. A.R. has received honoraria from consulting with Amgen, Bristol-Myers Squibb, Chugai, Genentech, Merck, Novartis, Roche, and Sanofi, is or has been a member of the scientific advisory board, holds stock in Advaxis, Apricity, Arcus Biosciences, Bioncotech Therapeutics, Compugen, CytomX, Five Prime, FLX-Bio, ImaginAb, Isoplexis, Kite-Gilead, Lutris Pharma, Merus, PACT Pharma, Rgenix, and Tango Therapeutics, has received research funding from Agilent and from Bristol-Myers Squibb through Stand Up to Cancer (SU2C), and has received payment for licensing a patent on non-viral T cell gene editing to Arsenal. The remaining authors declare no conflicts of interest.

Figures

Figure 1.
Figure 1.. Overview of TESLA Team Performance
(A) Schematic of TESLA. (B) Scatterplot of median number of peptides tested for immunogenicity (x axis) versus median number of peptides with validated immunogenicity (y axis). Dot size is the number of patients a given team submitted for. (C) Heatmap of the median overlap (described in STAR Methods) in the top 100 predicted pMHC for each pair of teams. (D) Heatmap of the Spearman correlation of rank between overlapping pMHC for each pair of teams. (E) Heatmap of the median overlap between the top 100 predicted pMHC from one team (y axis) versus the entire submitted set of pMHC (ranked and unranked) of another (x axis). (F) AUPRC for each submission for each team. Dot size represents the fraction ranked for that particular submission. Bottom: boxplot of AUPRC, FR, and TTIF for each team, aggregated over all submissions. (G) Scatterplots of median AUPRC versus median FR (top), median TTIF versus median AUPRC (center), and median TTIF versus median FR (bottom) for each team. Dot size represents the number of evaluable submission from that team included in the calculation. Rho, spearman rho; AUPRC, area under the precision recall curve; FR, fraction ranked; TTIF, top twenty immunogenic fractions. See also Figure S1 and Tables S1, S2, S3, and S5.
Figure 2.
Figure 2.. Rational Combination of Neoantigen Predictions Improve Prediction Performance
(A) Overview of each pMHC across all of TESLA that validated in a multimer-based assay. For each pMHC, the rank of that pMHC for a given team is shown. Places where a team did not identify a particular pMHC in any of their submissions are shown in gray. Bottom: for each peptide, the fraction of time that peptide was ranked in different ranking groups (left). (B) Schematic of prediction combination method along with metric calculation. (C) Histogram of average change in combined TTIF. Yellow, combination improves prediction on average; blue, combination is detrimental to prediction on average. (D) Density plot of average overlap, stratified by improvement status. Distributional difference assessed by Kolmogorov-Smirnov test. (E) Boxplot of relative difference stratified by improvement status. *p < 0.05. (F) Scatterplot of average overlap by relative difference. Ellipses represent best fit at one standard deviation. Rho, Spearman rho. (G) Combined TTIF by the average of the two initial TTIF values, by team pair and patient. Color represented improvement status (as in C), and shape represents if a particular value was a global improvement (larger than all previous TTIF values for that patient, triangle) or not (circle). (F) Fraction of predictions that are global improvements stratified by whether average team-pair TTIF is above or below the median. *p < 0.05.
Figure 3.
Figure 3.. Presentation Features Associated with Peptide Immunogenicity
(A) Histogram of each feature considered. (B) Heatmap of peptide length compared to mutation position. (C) Violin plot of binding affinity stratified by peptide immunogenicity. *****p < 10−5, Mann-Whitney U test. (D) Violin plot of tumor abundance stratified by peptide immunogenicity. **p < 0.01, Mann-Whitney U test. (E) Violin plot of binding stability stratified by peptide immunogenicity. ***p < 0.001, Mann-Whitney U test. (F) Boxplot of peptide hydrophobicity fraction stratified by peptide immunogenicity. *p < 0.05, Mann-Whitney U test. (G) Scatterplot of binding affinity compared to tumor abundance. Correlation: Spearman rho. (H) Scatterplot of binding affinity compared to binding stability. Correlation: Spearman rho. (I) Scatterplot of binding stability compared to hydrophobicity fraction. Correlation: Spearman rho. (J) Barplot of mutation position, normalized to each subset (immunogenic/non-immunogenic) separately. **p < 0.01, Fisher’s exact test. (K) Length-dependent enrichment of mutational position. Enrichment calculated as odds ratio from Fisher’s exact test. Gray denotes pairs that did not occur in our dataset. (L) Schematic of cross-validation scheme to select feature and threshold set. BA, binding affinity; TA, tumor abundance; BS, binding stability; FH, fraction hydrophobic; MP, mutation position. Right: contingency table using the optimal stratification parameters (below). p, Fisher’s exact test. See also Figures S2, S3, S4, and S5 and Table S4.
Figure 4.
Figure 4.. Recognition Features Associated with Peptide Immunogenicity
(A) Illustration of agretopicity and foreignness features. (B) Correlation between recognition and presentation associated features. Correlation calculated with spearman rho. All correlations not significant. (C) Histograms of agretopicity (left) and foreignness (right) among presented peptides. (D) Scatterplot of foreignness compared to agretopicity. Color: immunogenicity. Gray boxes denote low agretopicity or high foreignness peptides. Right: contingency table comparing validation status to recognition status among presented peptides. p, Fisher’s exact test; OR, odds ratio. (E) Barplot of mutation position by low agretopicity or high foreignness. (F) Upset plot of all four features associated with immunogenicity. Right: total number of peptides with that feature present. (G) Contingency table over all peptides comparing validation status to presented and recognized status. p, Fisher’s exact test; OR, odds ratio. (H) Precision-recall curves of peptides ranked only by MHC binding affinity (left), prioritizing presented peptides (center), and prioritizing presented and recognized peptides (right). Circles represent optimal precision-recall tradeoffs.
Figure 5.
Figure 5.. Directed Interventions on Submission Features Improves Neoantigen Pipeline Performance
(A) Spearman correlation between each feature pair across all teams. Feature IDs are those in (A). (B) Spearman correlation between 3 performance metrics (AUPRC, FR, and TTIF variability) and the 17 submission features plotted in (A) over all submissions. ***q < 0.05; **q < 0.1; *q < 0.25. (C–H) Two pipeline performance metrics are considered (AUPRC, C–E; TTIF, F–H), and for each metric, three interventions are demonstrated. For each intervention, the boxplot (left) shows the change in the performance metrics from the original prediction to the new prediction (post intervention). Significance values are calculated using a paired Mann-Whitney U test. ***p < 0.001; *****p < 10−5. The histogram (right) shows the distribution of changes to the performance metric. Red line, median; m, median improvement; FI, fraction improved. See also Figure S6 and Table S6.
Figure 6.
Figure 6.. Predicted and Recognized Neoantigen Abundance Is Associated with Overall Survival to Anti-PD1
(A) Patient cohort table displaying primary type, treatment, previous immunotherapies, and presence of sequencing. (B) Kaplan-Meier plot of overall survival stratified by CNB-high/low status. p value, log rank test. (C) Kaplan-Meier plot of overall survival stratified by PNA-high/low status. p value, log rank test. (D) Kaplan-Meier plot of overall survival stratified by PRNA-high/low status. p value, log rank test. All high/low cutoffs were taken to be the median across the cohort.
Figure 7.
Figure 7.. Features Associated with Improved Neoepitope Prediction in a Validation Cohort
(A) Schematic of the validation experiment. (B) Violin plot of binding affinity stratified by peptide immunogenicity. **p < 10−2, Mann-Whitney U test. (C) Violin plot of tumor abundance stratified by peptide immunogenicity. *p < 0.05, Mann-Whitney U test. (D) Violin plot of binding stability stratified by peptide immunogenicity. p = 0.06, Mann-Whitney U test. (E) Contingency table using optimal stratification parameters (below). p, Fisher’s exact test. (F) Scatterplot of foreignness compared to agretopicity. Color: immunogenicity. Right: contingency table comparing validation status to recognition status among presented peptides. p, Fisher’s exact test; OR, odds ratio. (G) Precision-recall curves of peptides ranked only by MHC binding affinity (left), prioritizing presented peptides (center), and prioritizing presented and recognized peptides (right). Circles represent optimal precision-recall tradeoffs. (H) Contingency table over all peptides comparing validation status to presented and recognized status. p, Fisher’s exact test. OR, odds ratio. (I) Two pipeline performance metrics are considered (AUPRC, top; TTIF, bottom), and for each metric, three interventions are demonstrated. For each intervention, the boxplot (left) shows the change in the performance metrics from the original prediction to the new prediction (post intervention). The histogram (right) shows the distribution of changes to the performance metric. Red line, median; m, median improvement; FI, fraction improved. See also Table S7.

Comment in

References

    1. Abelin JG, Keskin DB, Sarkizova S, Hartigan CR, Zhang W, Sidney J, Stevens J, Lane W, Zhang GL, Eisenhaure TM, et al. (2017). Mass Spectrometry Profiling of HLA-Associated Peptidomes in Mono-allelic Cells Enables More Accurate Epitope Prediction. Immunity 46, 315–326. - PMC - PubMed
    1. Abelin JG, Harjanto D, Malloy M, Suri P, Colson T, Goulding SP, Creech AL, Serrano LR, Nasir G, Nasrullah Y, et al. (2019). Defining HLA-II Ligand Processing and Binding Rules with Mass Spectrometry Enhances Cancer Epitope Prediction. Immunity 51, 766–779. - PubMed
    1. Alspach E, Lussier DM, Miceli AP, Kizhvatov I, DuPage M, Luoma AM, Meng W, Lichti CF, Esaulova E, Vomund AN, et al. (2019). MHC-II neoantigens shape tumour immunity and response to immunotherapy. Nature 574, 696–701. - PMC - PubMed
    1. Andersen RS, Kvistborg P, Frøsig TM, Pedersen NW, Lyngaa R, Bakker AH, Shu CJ, Straten Pt., Schumacher TN, and Hadrup SR (2012). Parallel detection of antigen-specific T cell responses by combinatorial encoding of MHC multimers. Nat. Protoc 7, 891–902. - PubMed
    1. Balachandran VP, Łuksza M, Zhao JN, Makarov V, Moral JA, Remark R, Herbst B, Askan G, Bhanot U, Senbabaoglu Y, et al.; Australian Pancreatic Cancer Genome Initiative; Garvan Institute of Medical Research; Prince of Wales Hospital; Royal North Shore Hospital; University of Glasgow; St Vincent’s Hospital; QIMR Berghofer Medical Research Institute; University of Melbourne, Centre for Cancer Research; University of Queensland, Institute for Molecular Bioscience; Bankstown Hospital; Liverpool Hospital; Royal Prince Alfred Hospital, Chris O’Brien Lifehouse; Westmead Hospital; Fremantle Hospital; St John of God Healthcare; Royal Adelaide Hospital; Flinders Medical Centre; Envoi Pathology; Princess Alexandria Hospital; Austin Hospital; Johns Hopkins Medical Institutes; ARC-Net Centre for Applied Research on Cancer (2017). Identification of unique neoantigen qualities in long-term survivors of pancreatic cancer. Nature 551, 512–516. - PMC - PubMed

Publication types