. 2020 Nov:61:103051.
doi: 10.1016/j.ebiom.2020.103051. Epub 2020 Oct 7.

Pan-cancer analysis of somatic mutations in miRNA genes

Affiliations

Pan-cancer analysis of somatic mutations in miRNA genes

Martyna O Urbanek-Trzeciak et al. EBioMedicine. 2020 Nov.

Abstract

Background: miRNAs are considered important players in oncogenesis, serving either as oncomiRs or suppressormiRs. Although the accumulation of somatic alterations is an intrinsic aspect of cancer development and many important cancer-driving mutations have been identified in protein-coding genes, the area of functional somatic mutations in miRNA genes is heavily understudied.

Methods: Here, based on the analysis of large genomic datasets, mostly the whole-exome sequencing of over 10,000 cancer/normal sample pairs deposited within the TCGA repository, we undertook an analysis of somatic mutations in miRNA genes.

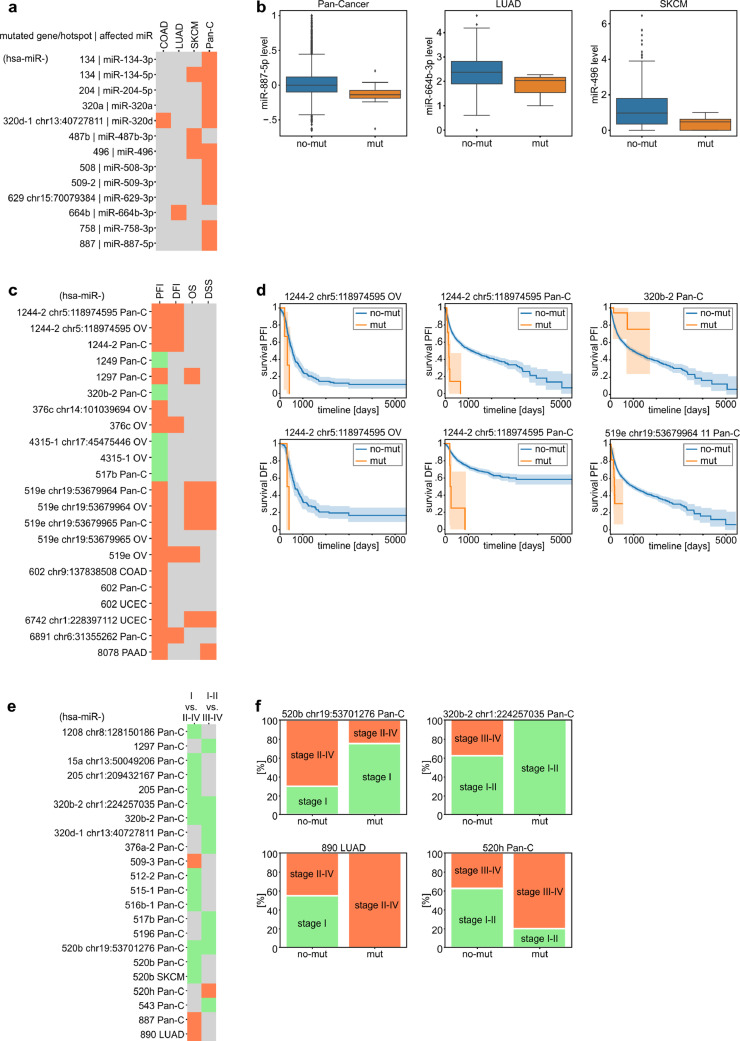
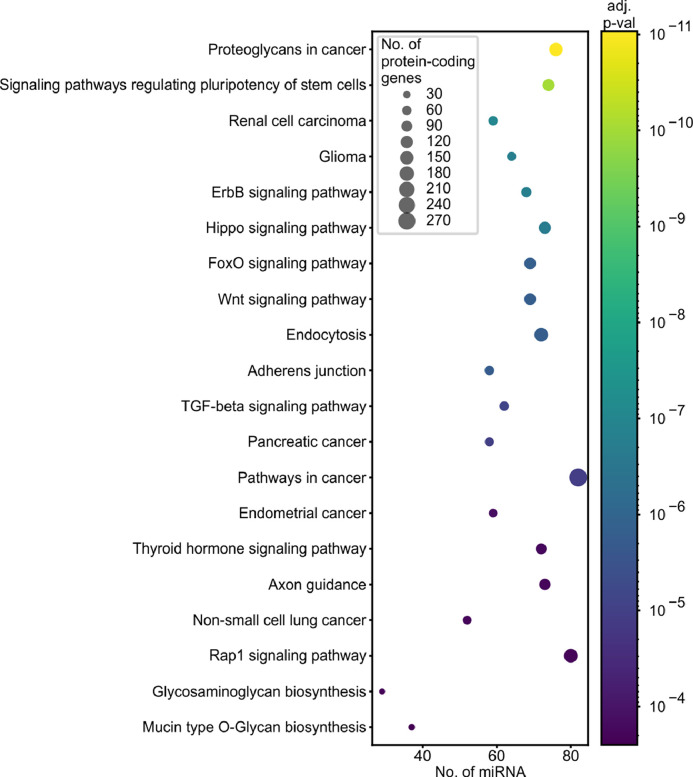
Findings: We identified and characterized over 10,000 somatic mutations and showed that some of the miRNA genes are overmutated in Pan-Cancer and/or specific cancers. Nonrandom occurrence of the identified mutations was confirmed by a strong association of overmutated miRNA genes with KEGG pathways, most of which were related to specific cancer types or cancer-related processes. Additionally, we showed that mutations in some of the overmutated genes correlate with miRNA expression, cancer staging, and patient survival.

Interpretation: Our study is the first comprehensive Pan-Cancer study of cancer somatic mutations in miRNA genes. It may help to understand the consequences of mutations in miRNA genes and the identification of miRNA functional mutations. The results may also be the first step (form the basis and provide the resources) in the development of computational and/or statistical approaches/tools dedicated to the identification of cancer-driver miRNA genes.

Funding: This work was supported by research grants from the Polish National Science Centre 2016/22/A/NZ2/00184 and 2015/17/N/NZ3/03629.

Keywords: Non-coding; Pan-Cancer; Somatic mutations; TCGA; miRNA.


Conflict of interest statement

Declaration of Competing Interest The authors declare no competing financial interests.

Figures

Fig. 1:
Fig. 1
Summary of mutations identified in miRNome in TCGA cancer types. (a) The number of mutations in the exome (x-axis, log10 scale) and miRNome (y-axis, linear scale) per sample in Pan-Cancer. Each dot represents a single sample. Black dots represent hypermutated (>10k somatic mutations in exome) samples. (b) The average number of mutations in the exome (x-axis, linear scale) and miRNome per cancer type (y-axis, linear scale). Each dot represents a single cancer type. Hypermutated samples were excluded prior to the analysis. (c) Percentage of patients with at least one somatic mutation detected in miRNA genes. (d) The number of mutations in miRNA genes per patient. Each dot represents a single patient. Patients are ranked by the number of mutations in miRNA genes. Scale is linear (values 0-10) and log10 (values 10+).
Fig. 2:
Fig. 2
Localization of somatic mutations in miRNA precursors in Pan-Cancer. (a) An overview of a primary miRNA transcript with the indicated subregions considered in the study. The miRNA duplex is indicated in blue, and representative sequence consensus motifs recognized as enhancers of miRNA biogenesis are represented by green circles. (b) Localization of all detected mutations in the Pan-Cancer cohort. miRNA duplex positions are indicated in blue, seed regions in dark blue, and flanking regions and terminal positions of the apical loop in grey. The numbers in the lower-right corner represent the number of plotted mutations (upper) and the number of mutated miRNA genes (lower). If present, sequence variants localized beyond position 22 in longer mature miRNAs are shown cumulatively at position 22. The plot shows mutations within six positions of the loop (first 3 and last 3 nucleotides). The number of remaining mutations is indicated within the loop. Analyses were also performed in narrowed groups of miRNAs that release the guide miRNA strand predominantly from the 5p or 3p arm (lower panels).
Fig. 3:
Fig. 3
Most frequently mutated miRNA genes and hotspots in Pan-Cancer. (a) miRNA genes with at least 20 somatic mutations in Pan-Cancer. Each colour represents a distinct cancer type. (b) Heatmap showing the percentage of mutations in miRNA genes overmutated (according to functionally weighted analysis) in Pan-Cancer and in specific cancers. Framed squares indicate cancer types in which gene enrichment reached statistical significance (binomial distribution test, adjusted p < 0.01). Specific values of mutation frequencies are shown in Supplementary Table S4. (c) Hotspot positions in miRNA genes with at least 10 somatic mutations in Pan-Cancer (colour legend as in panel a). To simplify the figure, we omitted the prefix hsa-miR in the gene IDs; * note the comment on mutations in hsa-miR-1324 at the end of the section Examples of overmutated miRNA genes.
Fig. 4:
Fig. 4
Localization of mutations in the selected overmutated miRNA genes. In each panel, on the left, mutations identified in the study in the TCGA samples (black arrowheads) and ICGC-PCAWG samples (purple arrowheads) are shown on mfold-predicted 2D structures of the miRNA precursors. Mature miRNA and seed sequences are indicated in light blue and dark blue, respectively. On the right, a screenshots from the UCSC genome browser, showing (from the top) a custom track with positions of the TCGA mutations detected in the study, conservation of the genomic region, and position of short non-coding RNAs, including pre-miRNAs (red bar; according to miRbase) and snoRNAs (green bar). For selected seed mutations, Venn-diagrams indicate the number of predicted targets for the wild-type (pink circle) and mutated (green circle) seeds. The effect of the seed mutations on the levels of the selected mutation-specific targets is shown in Supplementary Fig. S4. Genomic positions of the most significant hotspots are indicated next to mutations symbol. (a) Mutations found in hsa-miR-142. Green arrowheads indicate mutations detected in previous studies [[57], [58], [59], [60], [61],[63], [64], [65]] (for details see Supplementary Table S8); red arrowhead indicates the mutation identified by us in the Burkitt's lymphoma (Raji) cell line. * indicates the mutations tested functionally . (b) Mutations found in hsa-miR-205 (above). Below: (i) the corresponding 2D structure of the precursor with the chr1:209432226G>A[+] mutation (drawn in green) and (ii) superimposed 3D structures of the wild-type (black) and mutant (green) precursors are shown. The position of the mutation and the mutant allele are marked in pink. (c-h) Mutations found in hsa-let-7d, hsa-miR-411, hsa-miR-519e, hsa-miR-664b, hsa-miR-496, and hsa-miR-1302-3, respectively.
Fig. 5:
Fig. 5
Association of miRNA gene mutations with miRNA expression, patient survival, and cancer stage. (a) Heatmap shows miRNAs whose levels are significantly changed in samples mutated in the indicated genes or hotspots. Orange indicates that all miRNAs were downregulated by mutations in their genes. (b) Box plots show representative examples of miRNAs whose levels were changed in samples with mutations (mut) vs. samples without mutations (no-mut) in the corresponding gene. For Pan-Cancer analysis, miRNA levels were normalized to allow comparison between cancer types. (c) Heatmap shows the miRNA genes or hotspot mutations significantly associated with PFI (green - positively, orange - negatively). In the next columns, associations of the genes/hotspots with the other survival metrics (DFI, DSS, and OS) are also shown. (d) Example survival plots comparing mut and no-mut samples (shown in c). (e) Heatmap shows miRNA genes or hotspot mutations associated with cancer stages. Orange and green colours indicate associations of samples bearing mutations with higher and lower cancer stages, respectively. (f) Examples of associations (shown in e) of mutation with the distribution of cancer stages. To simplify the figure, we omitted the prefix hsa-miR in the gene IDs.
Fig. 6:
Fig. 6
Functional association of overmutated miRNA genes with KEGG pathways. The graph shows the top 20 pathways (y-axis) enriched in protein-coding genes regulated by miRNAs (x-axis) encoded by overmutated miRNA genes. Dot size indicates the number of protein-coding genes; dot colour depicts an adjusted p-value (Fisher's combined probability method) of association. The enrichment analysis was performed with the use of miRPath v3.0 and encompassed the top 100 miRNA genes enriched in the functionally weighted test. The full list of enriched pathways is shown in Supplementary Table S13.

References

    1. Kumar S, Warrell J, Li S. Passenger mutations in more than 2500 cancer genomes: overall molecular functional impact and consequences. Cell. 2020;180:915–927. .e16. - PMC - PubMed
    1. Horn S, Figl A, Rachakonda PS. TERT promoter mutations in familial and sporadic melanoma. Science. 2013;339:959–961. - PubMed
    1. Huang FW, Hodis E, Xu MJ, Kryukov GV, Chin L, Garraway LA. Highly recurrent TERT promoter mutations in human melanoma. Science. 2013;339:957–959. - PMC - PubMed
    1. Vinagre J, Almeida A, Pópulo H. Frequency of TERT promoter mutations in human cancers. Nat Commun. 2013;4:2185. - PubMed
    1. Hosseinahli N, Aghapour M, Duijf PHG, Baradaran B. Treating cancer with microRNA replacement therapy: a literature review. J Cell Physiol. 2018;233:5574–5588. - PubMed

MeSH terms