Observational Study
. 2020 Nov:61:103053.
doi: 10.1016/j.ebiom.2020.103053. Epub 2020 Oct 7.

An observational study identifying highly tuberculosis-exposed, HIV-1-positive but persistently TB, tuberculin and IGRA negative persons with M. tuberculosis specific antibodies in Cape Town, South Africa

Affiliations
Observational Study

An observational study identifying highly tuberculosis-exposed, HIV-1-positive but persistently TB, tuberculin and IGRA negative persons with M. tuberculosis specific antibodies in Cape Town, South Africa

Elouise E Kroon et al. EBioMedicine. 2020 Nov.

Abstract

Background: Mycobacterium tuberculosis (Mtb) infection is inferred from positive results of T-cell immune conversion assays measuring Mtb-specific interferon gamma production or tuberculin skin test (TST) reactivity. Certain exposed individuals do not display T-cell immune conversion in these assays and do not develop TB. Here we report a hitherto unknown form of this phenotype: HIV-1-positive persistently TB, tuberculin and IGRA negative (HITTIN).

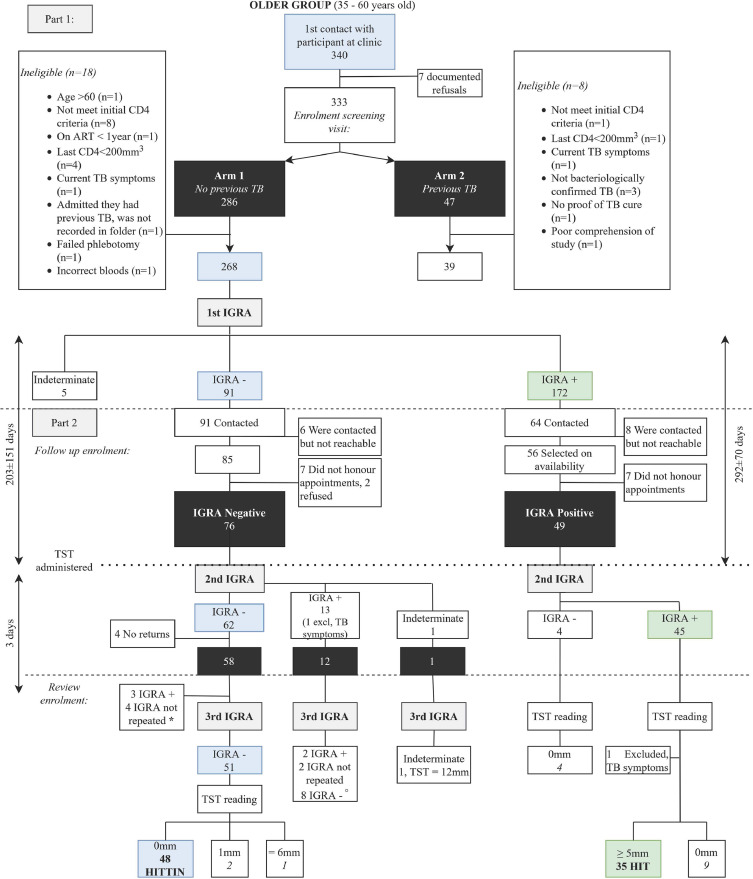
Methods: A community-based case-control design was used to systematically screen and identify adults living with HIV (HIV+), aged 35-60 years, who met stringent study criteria, and then longitudinally followed up for repeat IGRA and TST testing. Participants had no history of TB despite living in TB hyper-endemic environments in Cape Town, South Africa with a provincial incidence of 681/100,000. Mtb-specific antibodies were measured using ELISA and Luminex.

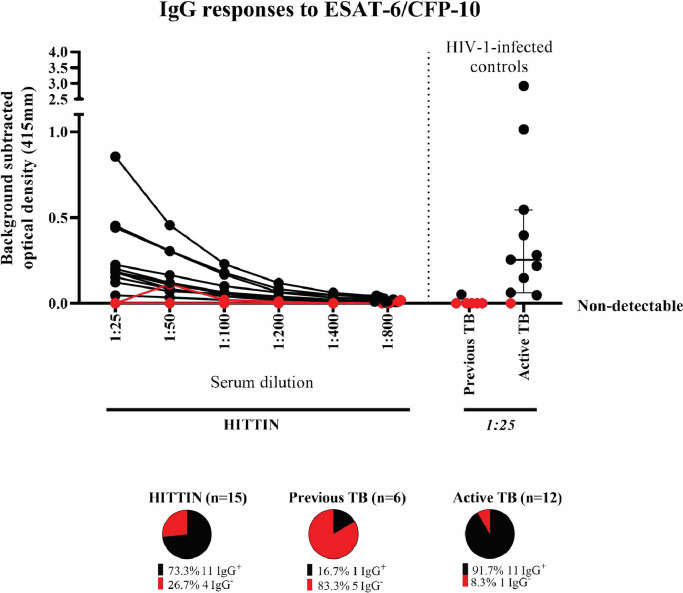
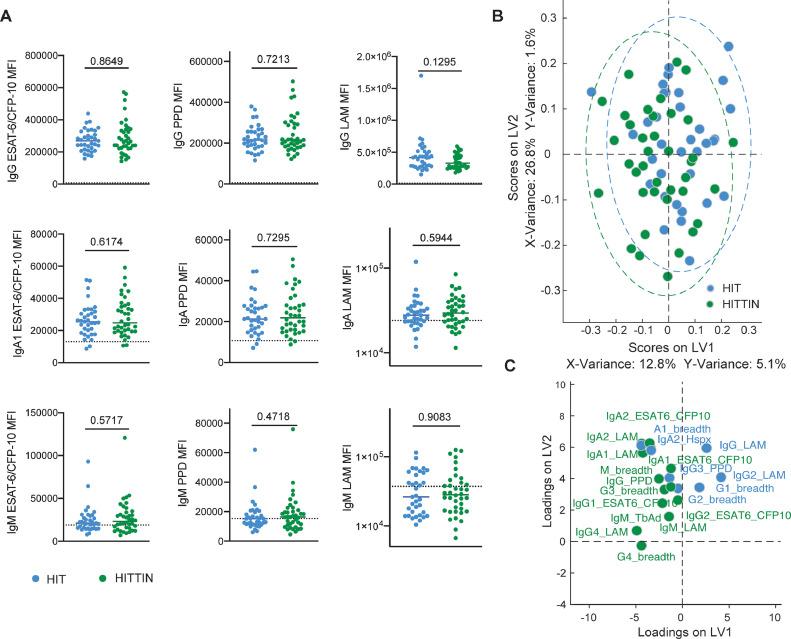
Findings: We identified 48/286 (17%) individuals who tested persistently negative for Mtb-specific T-cell immunoreactivity (three negative Quantiferon results and one TST = 0mm) over 206±154 days on average. Of these, 97·2% had documented CD4 counts<200 prior to antiretroviral therapy (ART). They had received ART for 7·0±3·0 years with a latest CD4 count of 505·8±191·4 cells/mm3. All HITTIN sent for further antibody testing (n=38) displayed Mtb-specific antibody titres.

Interpretation: Immune reconstituted HIV+ persons can be persistently non-immunoreactive to TST and interferon-γ T-cell responses to Mtb, yet develop species-specific antibody responses. Exposure is evidenced by Mtb-specific antibody titres. Our identification of HIV+ individuals displaying a persisting lack of response to TST and IGRA T-cell immune conversion paves the way for future studies to investigate this phenotype in the context of HIV-infection that so far have received only scant attention.

Keywords: Antibodies; Early clearance; Interferon gamma release assay; Resister; Tuberculin skin test.


Conflict of interest statement

Declaration of Competing Interest Data is available on reasonable request to the corresponding author. Dr Moller reports grants from National Institutes of Health, during the conduct of the study. Dr. Schurr reports to be the PI on NIH 1R01AI124349. The study was also partly funded by the Canadian Institutes of Health Research (CIHR) through grant FDN-143332 for which Dr. Schurr is the PI. Dr Kroon reports grants from National Institutes of Health, other from European and Developing Countries Clinical Trials Partnership, other from South African Medical Research Council during the conduct of the study. Dr Alter reports other from Seromyx Systems Inc outside the submitted work. In addition, Dr. Alter has a patent Systems Serology pending to Galit Alter. Dr. Wilkinson reports grants from Wellcome, grants from UK Research and Innovation, grants from Cancer Research UK, grants from National Institutes of Health, during the conduct of the study. Dr Walzl, Dr Hoal, Prof Kinnear, Dr Boolay, Dr Fischinger, Dr Orlova, Dr Jacobs and Ms Shin have nothing to disclose.

Figures

Fig 1:
Fig. 1
Recruitment flow diagram. The main phenotype derived from Arm 1 (visit 1) of the study, was stringently defined according to the criteria discussed under prescreening of records. Eighteen Arm 1 participants were excluded. We recalled as many negative IGRA participants as possible, since this was our phenotype of interest. Fifteen negative IGRA participants were excluded. Sixty-two of the part negative group had a negative second IGRA result. Four participants did not return. *Of the 58 participants who returned for a third visit, three had a positive third IGRA result (2 TST = 0mm, 1 TST = 15mm) and four did not have a third IGRA (TST = 7, 7, 10, 16mm). Fourty-eight participants have three negative IGRA results and a TST reading of 0 mm and were defined as HITTIN (indicated in blue on the flow diagram). °Eight participants tested IGRA negative on the first visit. They had a second positive IGRA result and retested IGRA negative the third time. Six of the eight had TST readings of 0 mm. These six participants likely had false positive IGRA results on the second IGRA test. The HIT group is indicated in green and was selected from 45 persons who tested IGRA positive for a second time and who had TST readings ≥5mm. The timeline on the left reflects the time between the first and the second IGRA of the HITTIN group (203±151 days) and then the time between second to the third IGRA (6±7 days). The timeline on the right reflects the time between the first and the second IGRA of the HIT groups (292±70 days). The TST were read 3 days later with only one read on day 4 and one on day 8. Both of these participants also self-reported persistant lack of TST response.
Fig 2:
Fig. 2
TBAg1 and TBAg2 responses. A) TBAg1a and B) TBAg2b IGRAc results of the six participants who converted during visit 2 (follow up enrolment) and reverted after 3 days (review enrolment). Each of the six participants had TSTd readings of 0 mm.The threshold of 0·35 IU/ml is indicated by the dashed line. aTBAg1 (TB1 tube result for QuantiFERON®-TB Gold Plus test) bTBAg2 (TB2 tube result for QuantiFERON®-TB Gold Plus test) cIGRA (interferon gamma release assay) dTST (tuberculin skin test)
Fig. 3:
Fig. 3
IgG responses to ESAT-6/CFP-10. IgG antibody titers against Mtb-specific antigens ESAT-6/CFP-10 (4µg/ml). Titration curves of serum antibody responses against a fusion protein of ESAT-6 and CFP-10 (Lionex) in 19 HIV-1-infected persistently TB, tuberculin and IGRA negative (HITTIN). Optical density (OD 415mm) values from antigen-uncoated wells at each dilution were subtracted from serum OD values at that dilution. A positive response was determined by OD values above background, and absent binding curves are demonstrated in red. Controls include 6 individuals with previous TB from Arm 2, and HIV-1-infected controls with active TB with median and interquartile ranges shown. Out of 15 HITTIN tested, 13 demonstrated decreased OD on dilution (68·4%), whereas only 1/6 (16·7%) of Arm 2 participants did (16·7%), and 11/12 (91·7%) controls with active TB. There is no statistically significant difference between IgG+ antibodies in HITTIN compared to the previous TB (Arm 2) group (p=0·18, Kruskal-Wallis test with Dunn's post test correction for multiple comparisons) and active TB group (p=0·06, Kruskal-Wallis test with Dunn's post test correction for multiple comparisons).
Fig. 4:
Fig. 4
HITTIN and HIT individuals harbor similar antibody profiles across subclasses/isotypes and antigens. A: Plasma levels of IgG, IgA1 and IgM reactive to ESAT6/CFP10, PPD and LAM were profiled across HIV-1-infected persistently TB, tuberculin and IGRA negative (HITTIN) (n=38) and HIV-1-infected IGRA positive tuberculin positive (HIT) individuals (n=35) represented by median fluorescent intensity (MFI) using a customized Luminex assay. The antigen-specific isotype levels are plotted for the two different groups, HITTIN (green) and HIT individuals (blue), the median is depicted, the dotted line represents the median level detected in HIV-negative, healthy North American volunteers. Mann-Whitney test was used to compare between groups. B and C: LASSO-PLSDA was performed utilizing antigen-specific antibody levels (total number of initial features=48). The scores plot (B) shows the distribution of groups (each dot represents one individual) across two latent variables (LV1 and 2), driven by the down selected features (C). P-values shown in Fig. 4 calculated with Mann-Whitney test.

References

    1. Simmons JD, Stein CM, Seshadri C, Campo M, Alter G, Fortune S. Immunological mechanisms of human resistance to persistent Mycobacterium tuberculosis infection. Nat Rev Immunol. 2018;18(9):575–589. doi: 10.1038/s41577-018-0025-3. - DOI - PMC - PubMed
    1. Verrall AJ, Netea MG, Alisjahbana B, Hill PC, van Crevel R. Early clearance of Mycobacterium tuberculosis: a new frontier in prevention. Immunology. 2014;141:506–513. doi: 10.1111/imm.12223. - DOI - PMC - PubMed
    1. Verrall AJ, Schneider, Alisjahbana M, Apriani B, van Laarhoven L, Koeken VACM A. Early clearance of Mycobacterium tuberculosis is associated with increased innate immune responses. J Infect Dis. 2020;221(8):1342–1350. doi: 10.1093/infdis/jiz147. - DOI - PubMed
    1. Stein CM, Zalwango S, Malone LL, Thiel B, Mupere E, Nsereko M. Resistance and Susceptibility to Mycobacterium tuberculosis Infection and Disease in Tuberculosis Households in Kampala, Uganda. Am J Epidemiol. 2018;187:1477–1489. doi: 10.1093/aje/kwx380. - DOI - PMC - PubMed
    1. Stein CM, Nsereko M, Malone LL, Okware B, Kisingo H, Nalukwago S. Long-term stability of resistance to latent M. tuberculosis infection in highly exposed TB household contacts in Kampala, Uganda. Clin Infect Dis. 2018;68(10):1705–1712. doi: 10.1093/cid/ciy751. - DOI - PMC - PubMed

Publication types

MeSH terms