

Prediction of Loneliness in Older Adults Using Natural Language Processing: Exploring Sex Differences in Speech
- PMID: 33039266
- PMCID: PMC7486862
- DOI: 10.1016/j.jagp.2020.09.009
Prediction of Loneliness in Older Adults Using Natural Language Processing: Exploring Sex Differences in Speech
Abstract
Objective: The growing pandemic of loneliness has great relevance to aging populations, though assessments are limited by self-report approaches. This paper explores the use of artificial intelligence (AI) technology to evaluate interviews on loneliness, notably, employing natural language processing (NLP) to quantify sentiment and features that indicate loneliness in transcribed speech text of older adults.
Design: Participants completed semi-structured qualitative interviews regarding the experience of loneliness and a quantitative self-report scale (University of California Los Angeles or UCLA Loneliness scale) to assess loneliness. Lonely and non-lonely participants (based on qualitative and quantitative assessments) were compared.
Setting: Independent living sector of a senior housing community in San Diego County.
Participants: Eighty English-speaking older adults with age range 66-94 (mean 83 years).
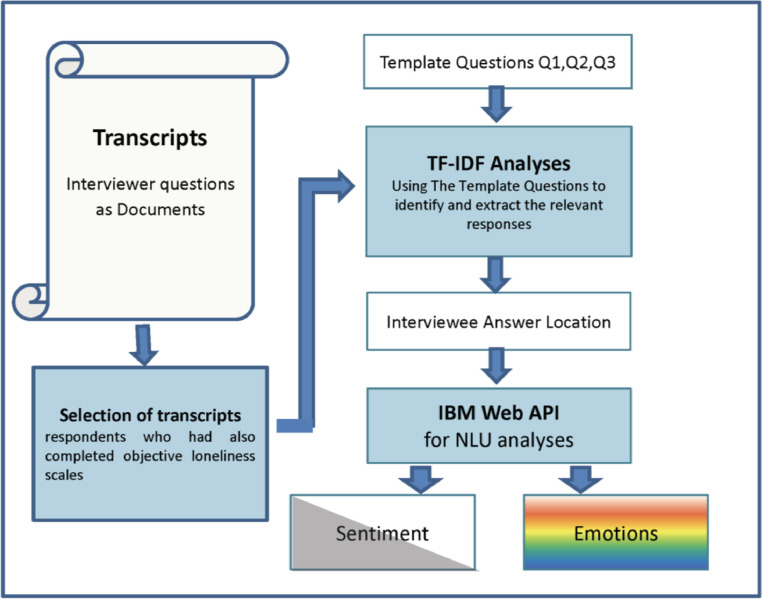
Measurements: Interviews were audiotaped and manually transcribed. Transcripts were examined using NLP approaches to quantify sentiment and expressed emotions.
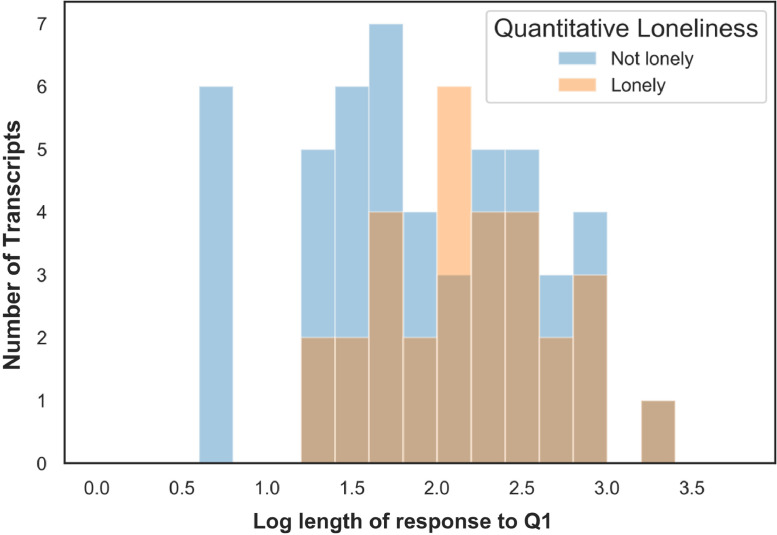
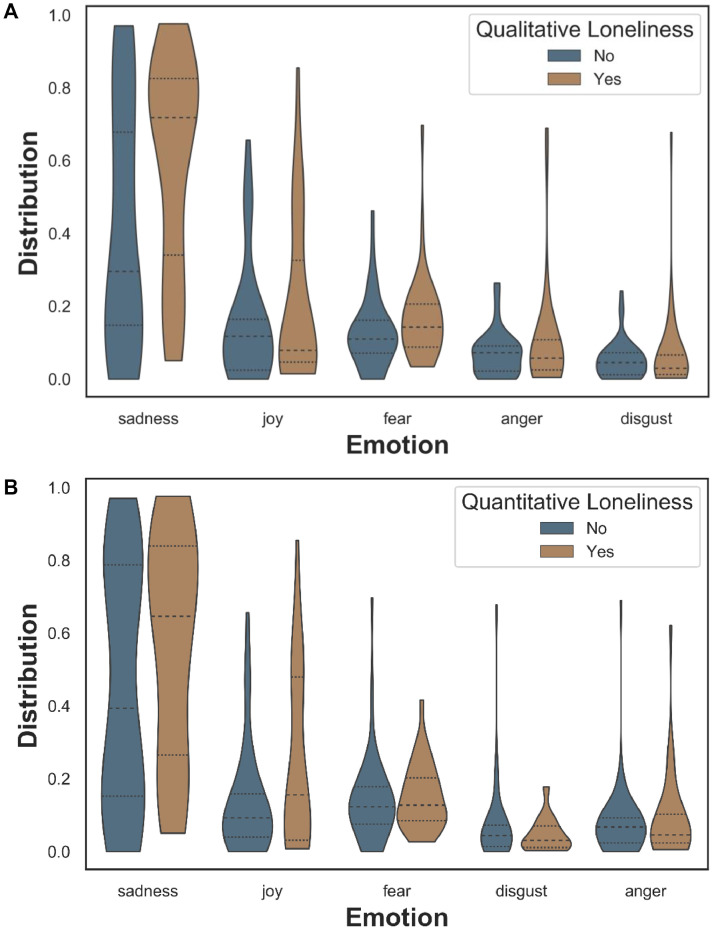
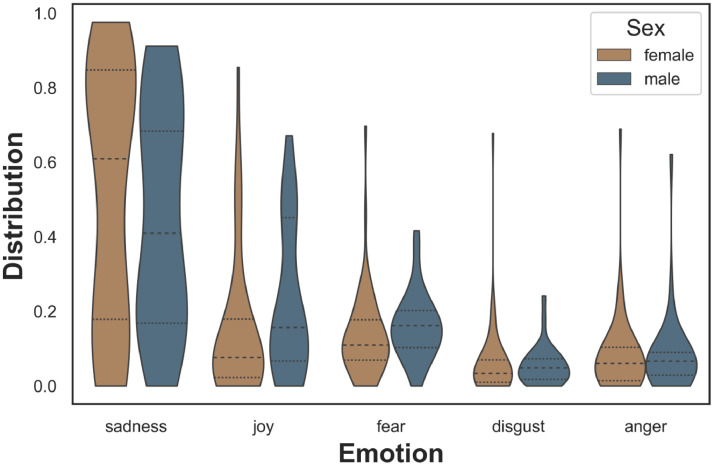
Results: Lonely individuals (by qualitative assessments) had longer responses with greater expression of sadness to direct questions about loneliness. Women were more likely to endorse feeling lonely during the qualitative interview. Men used more fearful and joyful words in their responses. Using linguistic features, machine learning models could predict qualitative loneliness with 94% precision (sensitivity = 0.90, specificity = 1.00) and quantitative loneliness with 76% precision (sensitivity = 0.57, specificity = 0.89).
Conclusions: AI (e.g., NLP and machine learning approaches) can provide unique insights into how linguistic features of transcribed speech data may reflect loneliness. Eventually linguistic features could be used to assess loneliness of individuals, despite limitations of commercially developed natural language understanding programs.
Keywords: Artificial Intelligence; gender; social isolation.
Published by Elsevier Inc.
Figures
References
-
- Lubben J, Gironda M, Sabbath E, et al. Social isolation presents a grand challenge for social work (Grand Challenges for Social Work Initiative Working Paper No. 7), 2015, Cleveland, OH: American Academy of Social Work and Social Welfare.
-
- Dahlberg L, Andersson L, McKee KJ. Predictors of loneliness among older women and men in Sweden: a national longitudinal study. Aging Ment Health. 2015;19:409–417. - PubMed
-
- United States Census Bureau . United States Census Bureau; Washington, D.C.: 2011. Changing American Households.
-
- Pew Research Center . Pew Internet & American Life Project; 2009. Social Isolation and New Technology.
