. 2021 Feb;160(3):831-846.e10.
doi: 10.1053/j.gastro.2020.10.002. Epub 2020 Oct 8.

High-Fidelity Drug-Induced Liver Injury Screen Using Human Pluripotent Stem Cell-Derived Organoids

Affiliations

High-Fidelity Drug-Induced Liver Injury Screen Using Human Pluripotent Stem Cell-Derived Organoids

Tadahiro Shinozawa et al. Gastroenterology. 2021 Feb.

Abstract

Background & aims: Preclinical identification of compounds at risk of causing drug induced liver injury (DILI) remains a significant challenge in drug development, highlighting a need for a predictive human system to study complicated DILI mechanism and susceptibility to individual drug. Here, we established a human liver organoid (HLO)-based screening model for analyzing DILI pathology at organoid resolution.

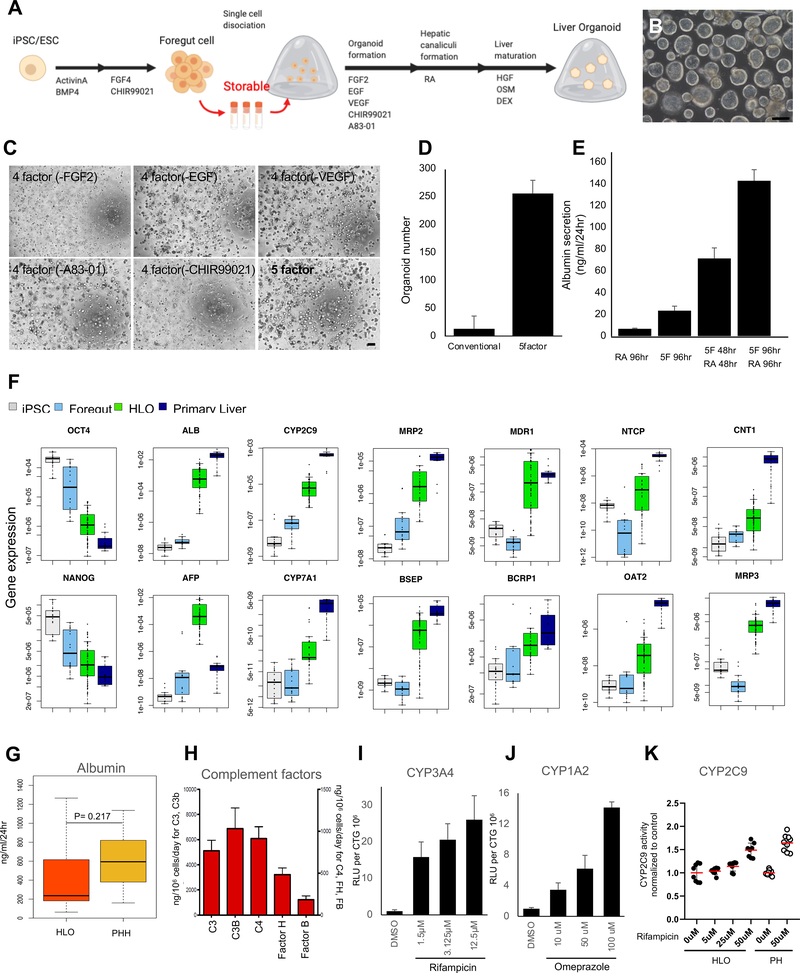
Methods: We first developed a reproducible method to generate HLO from storable foregut progenitors from pluripotent stem cell (PSC) lines with reproducible bile transport function. The qRT-PCR and single cell RNA-seq determined hepatocyte transcriptomic state in cells of HLO relative to primary hepatocytes. Histological and ultrastructural analyses were performed to evaluate micro-anatomical architecture. HLO based drug-induced liver injury assays were transformed into a 384 well based high-speed live imaging platform.

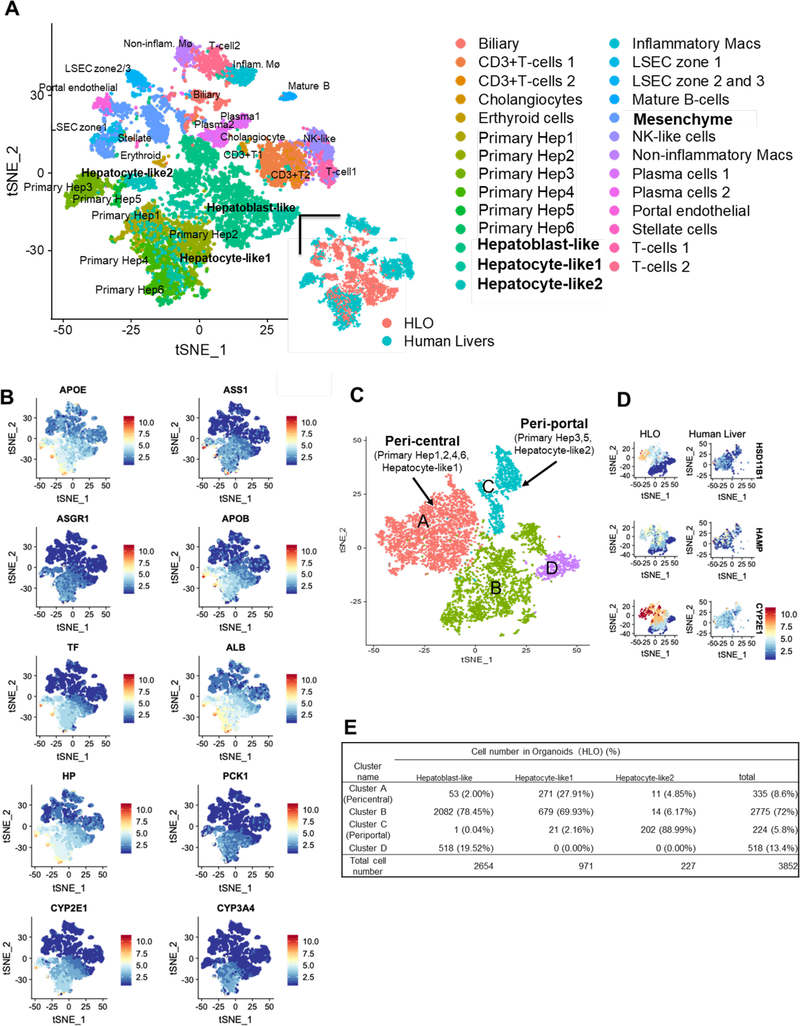
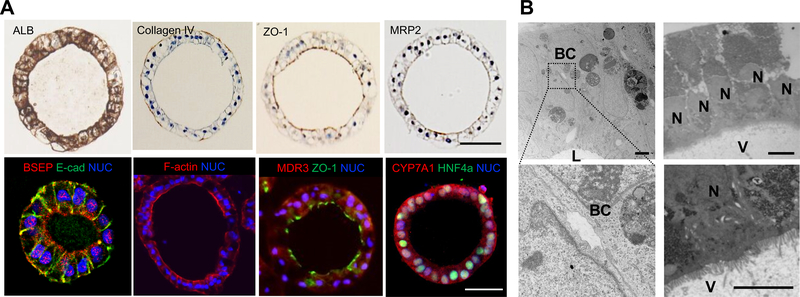
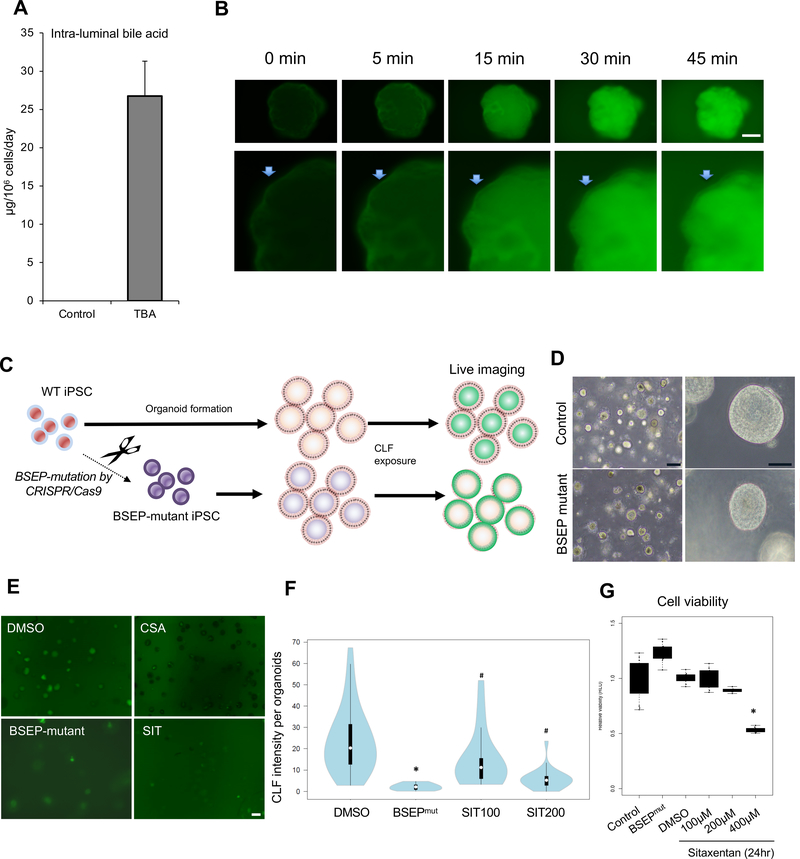
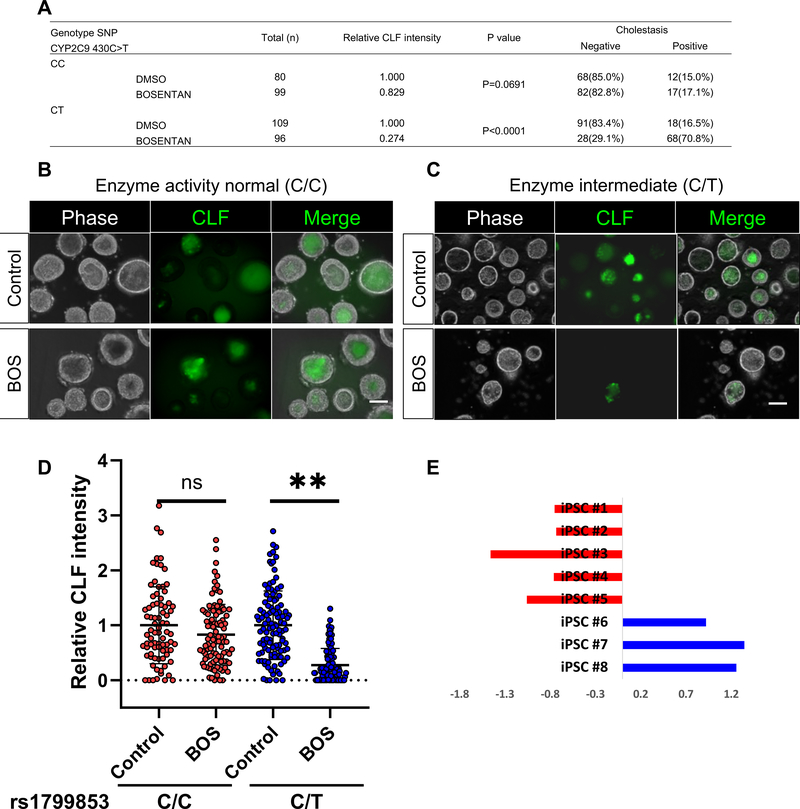
Results: HLO, generated from 10 different pluripotent stem cell lines, contain polarized immature hepatocytes with bile canaliculi-like architecture, establishing the unidirectional bile acid transport pathway. Single cell RNA-seq profiling identified diverse and zonal hepatocytic populations that in part emulate primary adult hepatocytes. The accumulation of fluorescent bile acid into organoid was impaired by CRISPR-Cas9-based gene editing and transporter inhibitor treatment with BSEP. Furthermore, we successfully developed an organoid based assay with multiplexed readouts measuring viability, cholestatic and/or mitochondrial toxicity with high predictive values for 238 marketed drugs at 4 different concentrations (Sensitivity: 88.7%, Specificity: 88.9%). LoT positively predicts genomic predisposition (CYP2C9∗2) for Bosentan-induced cholestasis.

Conclusions: Liver organoid-based Toxicity screen (LoT) is a potential assay system for liver toxicology studies, facilitating compound optimization, mechanistic study, and precision medicine as well as drug screening applications.

Keywords: Cholestasis; DILI; Liver Organoid; Pluripotent Stem Cell.


Figures

Figure 1.
Figure 1.. Generation of human liver organoid (HLO) from storable PSC-derived foregut cells
A. Overview of our differentiation method for liver organoids. B. Representative Image of HLO at Day 20. Bar = 200 μm. C. Phase-contrast image of HLO in different culture conditions with 5 factors, which were FGF2, VEGF, EGF, CHIR-99021 (GSK-3 inhibitor) and A83–01 (TGF-β inhibitor). Bar = 200 μm D. The number of HLO cultured with 5 factors. Conventional: Treated with only RA. E. The secretion of albumin from HLO in culture condition with treatment of different factors. F. Quantitative RT-PCR analysis of representative gene related to hepatic function and pluripotency marker. Undifferentiated iPSCs (iPSC, n=8), posterior foregut organoid (Foregut, n=8), human liver organoid (HLO, n=16) and Primary Liver (Human primary hepatocytes, n=8). G. The secretion of albumin in HLO (n=92) and primary hepatocytes (n=14). H. The secretion of complement factors in HLO. n=4. I. CYP3A4 activation by treatment of Rifampicin. n = 5. J. CYP1A2 activation by treatment of Omeprazole. n = 5. K. The CYP2C9 induction capacity after Rifampicin treatment in HLO and Primary Hepatocytes (PHH). Bars represent the mean ± SD, n=7 for HLO, n=9 for primary hepatocytes.
Figure 2.
Figure 2.. Single cell RNA sequencing profiling of hepatic cells in HLO
A. Integrated tSNE map of 5177 HLO cells and 8439 primary human liver cells. Each point indicates a single cell which are colored by cell type (upper and right bottom) or original source. B. In integrated tSNE map of HLO and primary hepatocytes, the feature plots showed expression of hepatic marker genes. Color bar indicates scaled gene expression level. C. Integrated tSNE map and clustering of 3852 hepatoblast-like and hepatocyte-like cells in HLO and 3507 hepatocytes in primary human liver identify zonal characters in A and C. The inset indicates cell cycle phase of each cell. D. The feature plots showed expression of four zonal peri-central markers of hepatocytic clusters. E. The table shown percentage of hepatoblast-like and hepatocyte-like cell of HLO in each cluster.
Figure 3.
Figure 3.. Structural profiling of HLO
A. Immunostaining for Albumin (ALB), Collagen IV, ZO-1, MRP2, E-cadherin (E-cad), BSEP, F-actin, MDR3, CYP7A1 and HNF4a in HLO. Nuclei were stained with DAPI (blue). Bars, 50 μm. B. Transmission electron micrograph of an HLO showing microvilli (V) intra-luminal surface; V: Microvilli, BC: Bile canaliculi-like structure, L: Lumen, N: nuclei. Bars, 10 μm.
Figure 4.
Figure 4.. Bile transport property in HLO
A. Total bile acid (TBA) secretion level inside HLO at day 27. Bars represent the mean ± SEM, n=4. B. Sequential images for efflux of FD toward the inside of the organoid from outside. Arrow: Surface of an organoid. Bar = 50 μm. C. Overview of the method to investigate transporter BSEP activity in organoids. D. Representative phase-contrast image of BSEP-mutated HLO. Bar = 200 μm (Left image), 50 μm (Right image). E. Representative image of bile acid uptake in BSEP-mutated HLO, CSA and sitaxentan (SIT) which were BSEP inhibitors after 30 min of culture in the presence of CLF. Bar = 200 μm F. Graph indicated CLF intensity levels in each HLO. White circles show the medians: box limits indicate the 25th and 75th percentiles as determined by R software: whiskers extend 1.5 times the interquartile range from the 25th and 75th percentiles: polygons represent density estimates of data and extend to extreme values. BSEPmut: BSEP mutant. SIT100: sitaxentan 100 μM, SIT200: 200 μM. *: p <0.01 on t-test. #: p <0.05 on Dunnett’s test. G. The viability of HLO. *: <0.01 on Dunnett’s test.
Figure 5.
Figure 5.. Large scale-organoid based toxicity (LoT) screen identifies compounds with toxic potential
A. Schematic of the DILI screen workflow with image of quantification strategy for CLF and cell viability. B. Representative images of 384-well drug screen plate with quantification of CLF at 24 hours. CLF mono-fluorescence converted to intensity plot by imageJ. Right upper image: negative compound (sucrose), right bottom image: positive compounds (CSA). See Supplementary Table 1. C. Violin plot of CLF intensity in HLO treated with compounds relative to control. D. Scatter plot of the viability and CLF intensity. Sen: sensitivity (true positive / true positive + false negative), Spe: specificity (true negative / true negative + false positive). Circle dots: the data of DILI positive compounds. Triangle dot: the data of DILI negative compounds. n = 5. E. CLF intensity of representative drugs categorized into Negative and Cholestatic groups.
Figure 6.
Figure 6.. Mechanistic toxicological approach using DILI HLO model
A. Upper: Image of FD transport inhibition after treatment of 9 training compounds for 5 min. Bottom: Image of mitochondria membrane potential (MMP) on TMRM after treatment of 9 training compounds (TC). B. Quantification of transport inhibition after treatment of TC, Bars represent the mean ± SD, *: p<0.05, **: p<0.01, n= 4–6. C. Quantification of MMP change after treatment of TC, Bars represent the mean ± SD, *: p<0.05, **: p<0.01, n= 4–5. CON: Control sample, STP: Streptomycin, TOL: Tolcapone, DICLO: Diclofenac, BOS: Bosentan, CSA: Cyclosporin A, TRO: Troglitazone, NEFA: Nefazodone, ENTA: Entacapone, PIO: Pioglitazone. C. Quantification of transport inhibition after treatment of training compounds, Bars represent the mean ± SD, *: p<0.05, **: p<0.01, n= 4–6. C. Quantification of MMP change after treatment of training compounds, Bars represent the mean ± SD, *: p<0.05, **: p<0.01, n= 4–5. CON: Control sample, STP: Streptomycin, TOL: Tolcapone, DICLO: Diclofenac, BOS: Bosentan, CSA: Cyclosporin A, TRO: Troglitazone, NEFA: Nefazodone, ENTA: Entacapone, PIO: Pioglitazone. D. Analysis between viability for 72h after treatment of drugs and dual risk parameters, drug-induced cholestasis potential and mitochondria toxicity potential. Cholestasis and Mitochondria toxicity (Mito-tox) indexes were derived from data in Figure. 6 B–C. The size of circles indicated the magnitude of viability decreases. E. Overview of evaluation of drug-induced cytotoxicity on vulnerable organoid model. Profiling of vulnerable model on lipid accumulation (Blue: nuclei, Green: Lipid, Red: F-actin) F. ROS production (Blue: nuclei, Green: ROS) and Mitochondria detection (Blue: nuclei, Red: Mitochondria). Image of organoids at 24h after drugs treatment. G. Viability assessment on lipid accumulation-induced vulnerable organoid model. Bars represent the mean ± SD, *: p<0.05, n= 5–6. CON: control, STP: Streptomycin, TRO: Troglitazone, PIO: Pioglitazone, NAC: N-acetylcysteine.
Figure 7.
Figure 7.. Bosentan induced cholestasis is specific to CYP2C9*2 HLO
A. The table indicates the possession of Enzyme activity normal(C/C) / intermediate (C/T) alleles, CYP2C9*2 to Bosentan-induced liver injury in iPSC lines and the ratio of CLF efflux difference in each group. B. Images of CLF transport activity and inhibition by Bosentan in HLO derived from donor with enzyme intermediate allele. Bar = 100 μm. C. Images of CLF transport activity and inhibition by Bosentan in HLO derived from donor with enzyme active allele. Bar = 100 μm. D. CLF intensity levels in HLOs derived from iPSC lines. **: p <0.0001, t-Test. NS: not significant. In the box plots, the top and bottom of the box represent the 75th and 25th percentiles, the center line represents the median. Dot indicates the data from each organoid. E. CLF intensity levels in organoids from 8 iPSC lines. The data were shown as Z-score in each sample.

Comment in

References

    1. Takebe T, Taniguchi H. Human iPSC-derived miniature organs: a tool for drug studies. Clin Pharmacol Ther 2014;96:310–3. - PubMed
    1. Yang K, Woodhead JL, Watkins PB, et al. Systems pharmacology modeling predicts delayed presentation and species differences in bile acid-mediated troglitazone hepatotoxicity. Clin Pharmacol Ther 2014;96:589–98. - PMC - PubMed
    1. Leslie EM, Watkins PB, Kim RB, et al. Differential inhibition of rat and human Na+-dependent taurocholate cotransporting polypeptide (NTCP/SLC10A1)by bosentan: a mechanism for species differences in hepatotoxicity. J Pharmacol Exp Ther 2007;321:1170–8. - PubMed
    1. Ouchi R, Togo S, Kimura M, et al. Modeling Steatohepatitis in Humans with Pluripotent Stem Cell-Derived Organoids. Cell Metab 2019. - PMC - PubMed
    1. Inoue H, Nagata N, Kurokawa H, et al. iPS cells: a game changer for future medicine. EMBO J 2014;33:409–17. - PMC - PubMed

Publication types

MeSH terms