. 2021 Jan;160(1):362-377.e13.
doi: 10.1053/j.gastro.2020.09.043. Epub 2020 Oct 9.

Targeting DNA Damage Response and Replication Stress in Pancreatic Cancer

Collaborators, Affiliations

Targeting DNA Damage Response and Replication Stress in Pancreatic Cancer

Stephan B Dreyer et al. Gastroenterology. 2021 Jan.

Abstract

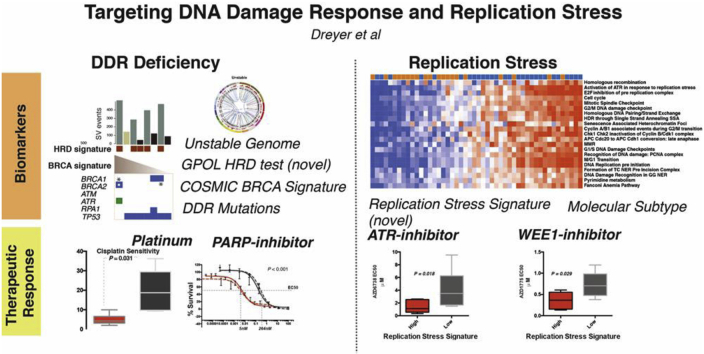
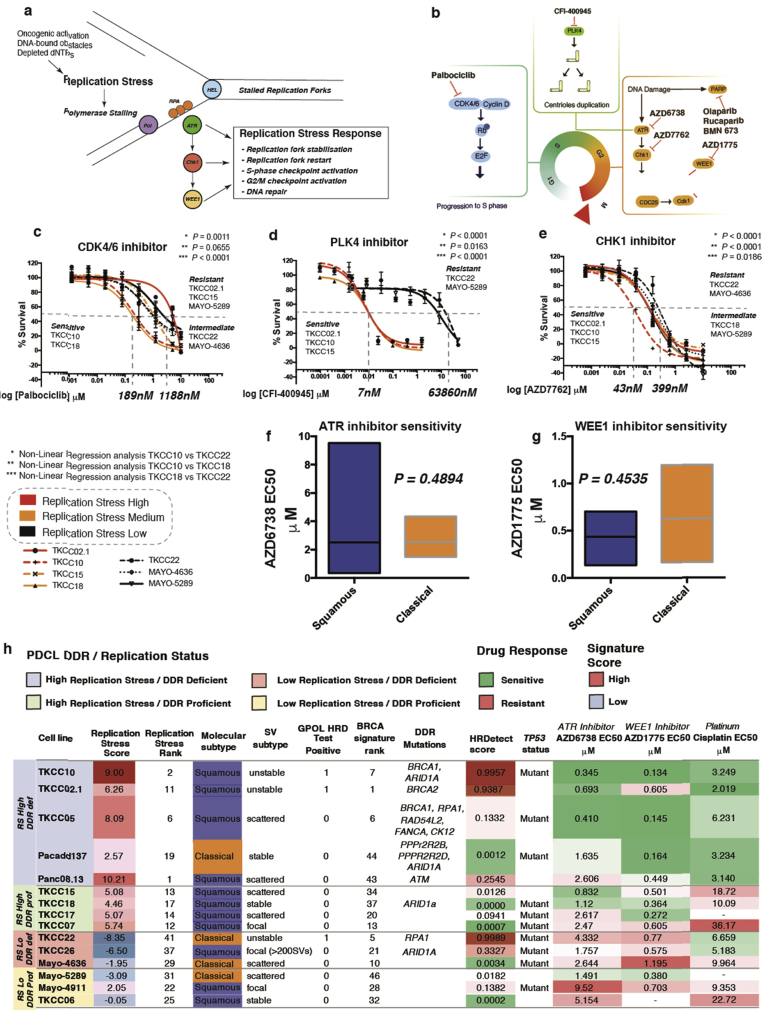
Background & aims: Continuing recalcitrance to therapy cements pancreatic cancer (PC) as the most lethal malignancy, which is set to become the second leading cause of cancer death in our society. The study aim was to investigate the association between DNA damage response (DDR), replication stress, and novel therapeutic response in PC to develop a biomarker-driven therapeutic strategy targeting DDR and replication stress in PC.

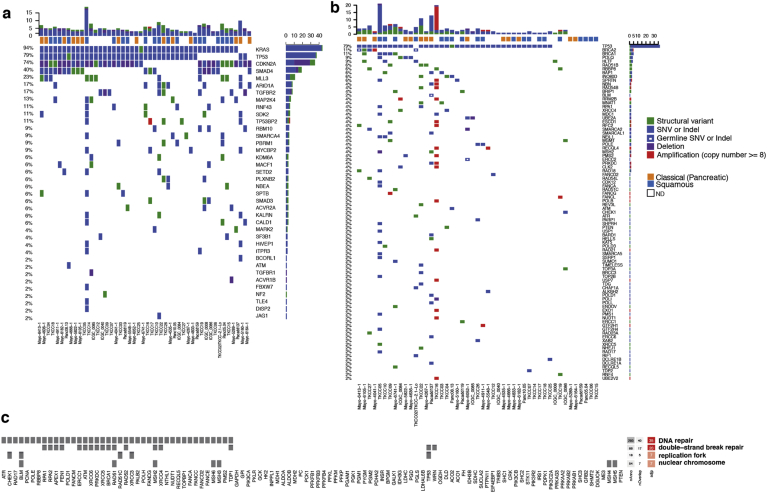
Methods: We interrogated the transcriptome, genome, proteome, and functional characteristics of 61 novel PC patient-derived cell lines to define novel therapeutic strategies targeting DDR and replication stress. Validation was done in patient-derived xenografts and human PC organoids.

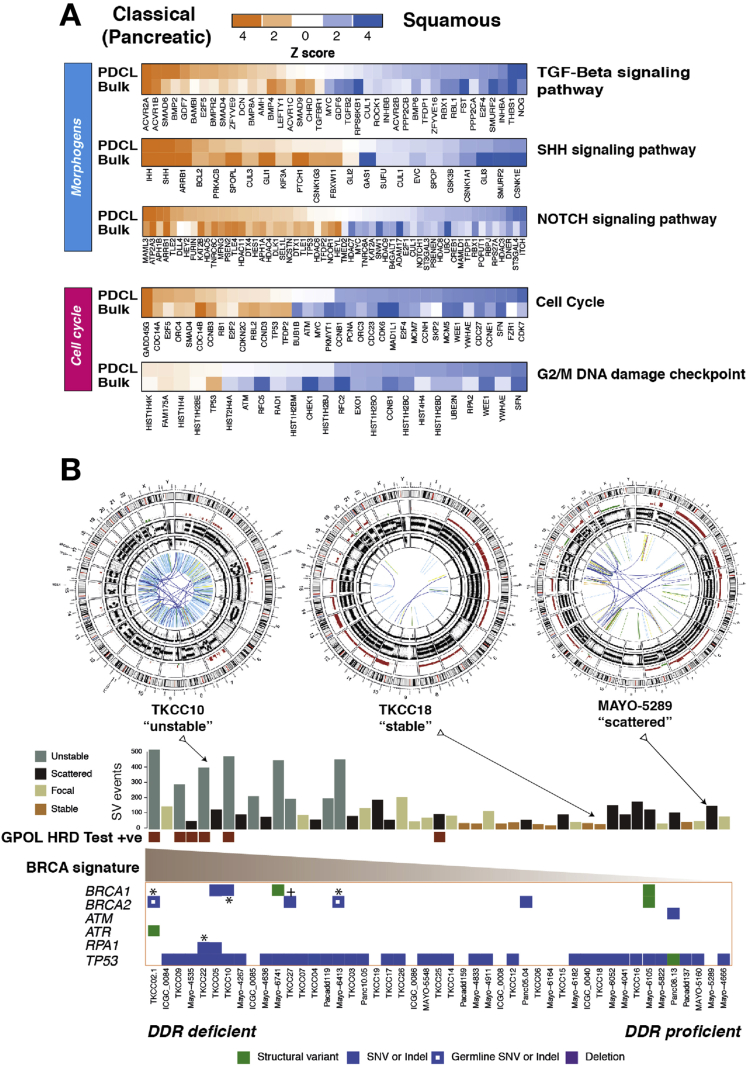
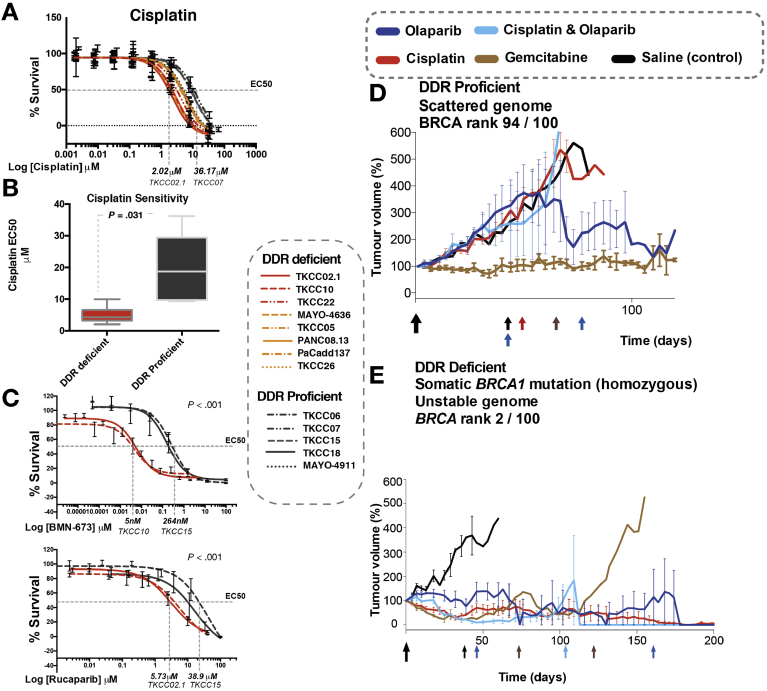
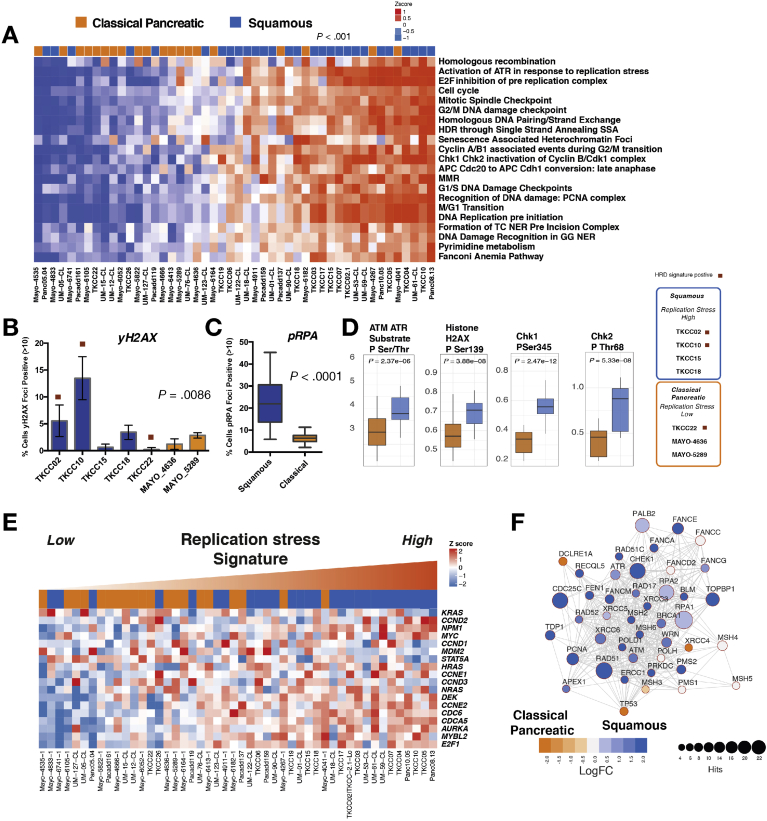
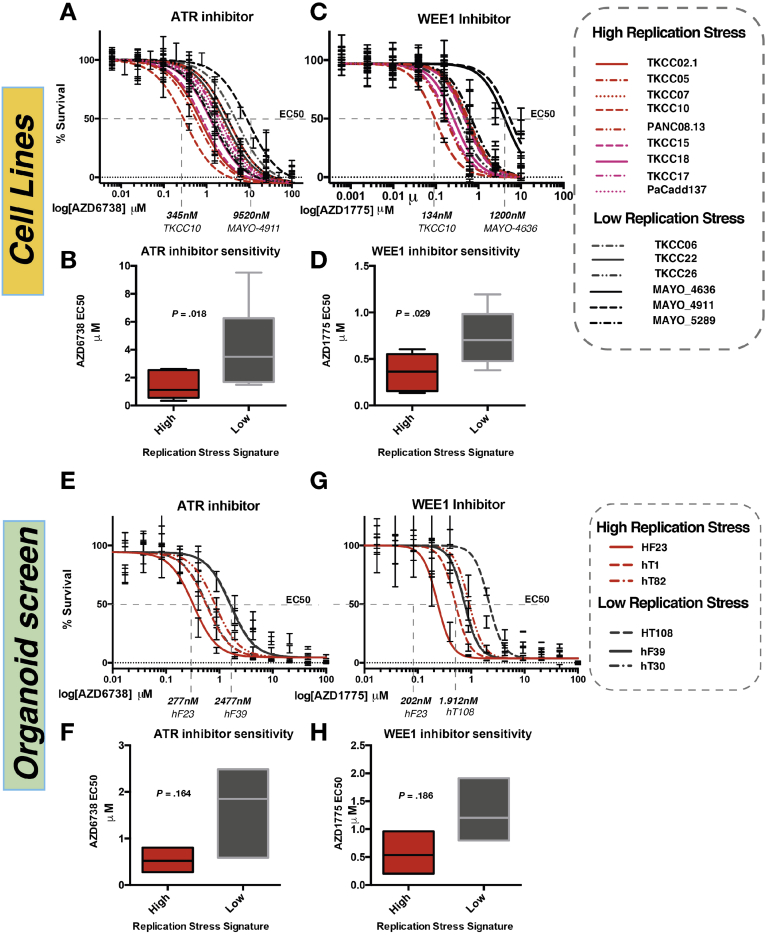
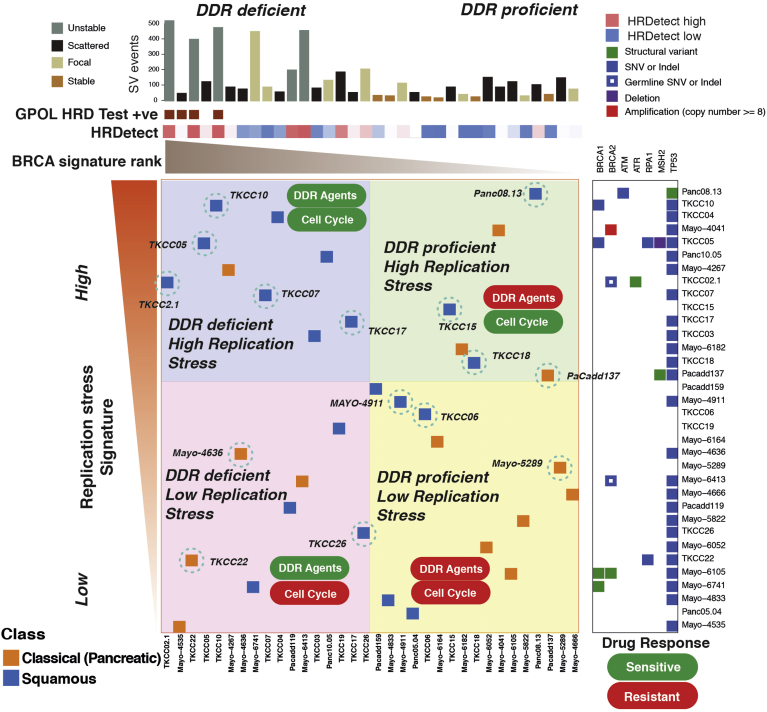
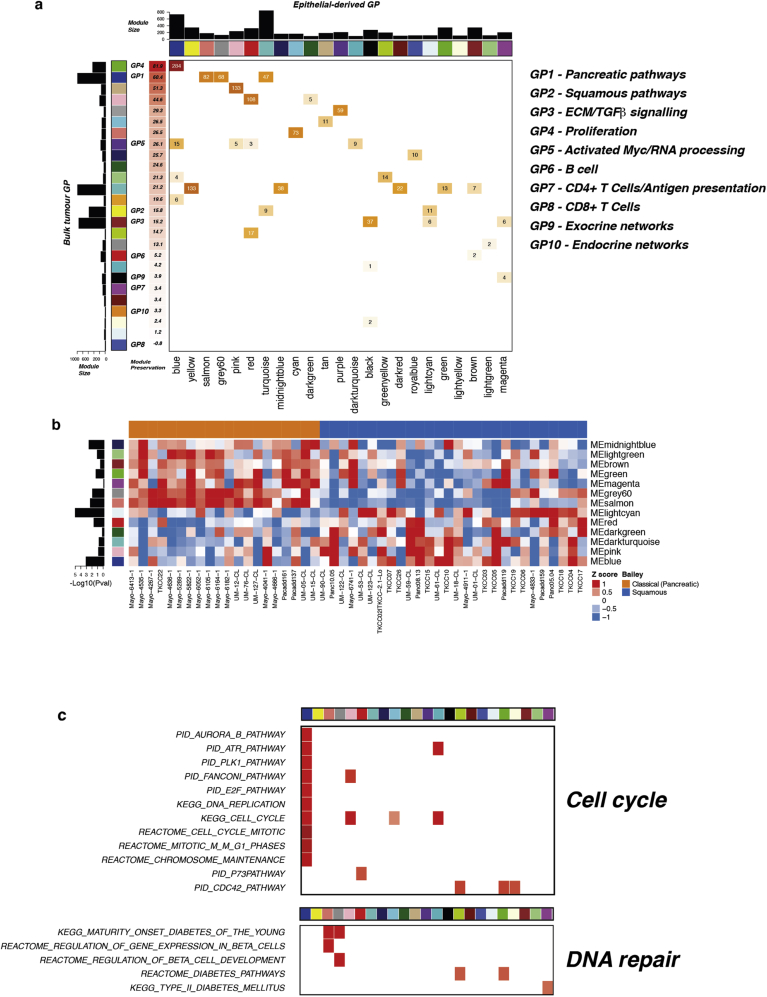
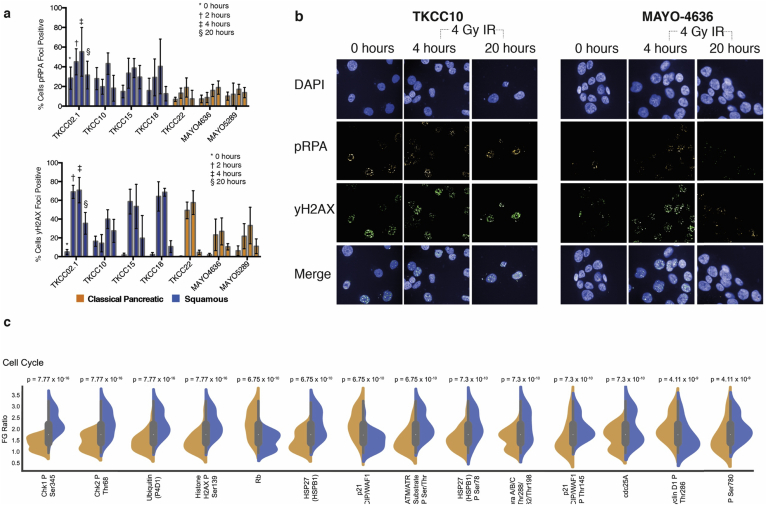
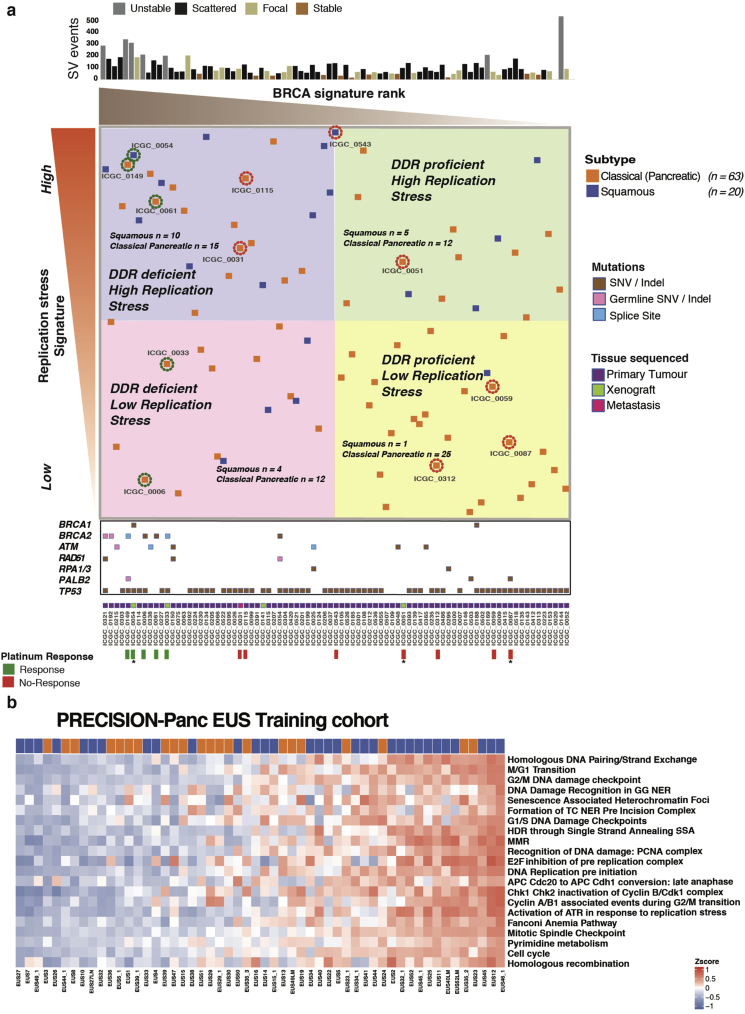
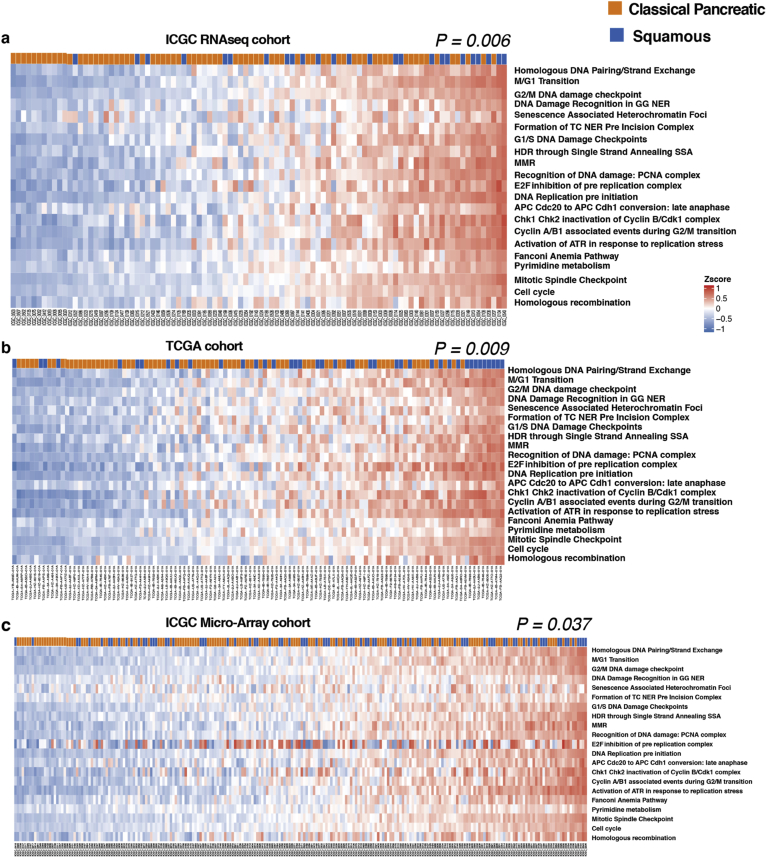
Results: Patient-derived cell lines faithfully recapitulate the epithelial component of pancreatic tumors, including previously described molecular subtypes. Biomarkers of DDR deficiency, including a novel signature of homologous recombination deficiency, cosegregates with response to platinum (P < .001) and PARP inhibitor therapy (P < .001) in vitro and in vivo. We generated a novel signature of replication stress that predicts response to ATR (P < .018) and WEE1 inhibitor (P < .029) treatment in both cell lines and human PC organoids. Replication stress was enriched in the squamous subtype of PC (P < .001) but was not associated with DDR deficiency.

Conclusions: Replication stress and DDR deficiency are independent of each other, creating opportunities for therapy in DDR-proficient PC and after platinum therapy.

Keywords: DNA Damage Response; Pancreatic Cancer; Personalized Medicine; Replication Stress.


Figures

None
Graphical abstract
Figure 1
Figure 1
Subtype specific differences and DDR in PDCLs of PC. (A) Heatmaps of key genes in pathways important in carcinogenesis, grouped into distinct molecular processes related to morphogenesis and cell cycle control between molecular subtypes of bulk tumor and PDCLs of PC. The degree of color saturation is proportional to the degree of enrichment in the squamous (blue) and classical pancreatic (orange) subtypes. For all samples within each subtype, genes are ranked by the most differentially expressed between subtypes. (B) Surrogate biomarkers of DDR deficiency, defined by large-scale sequencing projects of PC, include (1) unstable genome (>200 SVs), (2) the novel GPOL HRD test, (3) high-ranking BRCA mutational signature, and (4) deleterious mutations in DDR pathway genes. PDCLs are ranked from left to right based on the COSMIC BRCA mutational signature, with SV subtype, number of SVs, and GPOL HRD test status symbolized on the top bar. Examples of circos plots for 3 PDCLs are included, representing unstable, stable, and scattered subtypes. SNV, single-nucleotide variant; TGF, transforming growth factor.
Figure 2
Figure 2
Targeting DDR-deficient PC with platinum and PARP inhibitors. (A) Cell viability after 72 hours of cisplatin treatment in PDCLs. The dotted line indicates that EC50 in the most sensitive PDCL was approximately 15 times more sensitive than the most resistant PDCLs. (B) Boxplot of mean cisplatin EC50 in PDCLS stratified by DDR status. The boxes represent the 95% confidence interval, and whiskers show the minimum and maximum range. P was calculated by using the Mann-Whitney test between the mean EC50 in each group. (C) PARP inhibitor (BMN-637 and rucaparib) response in PDCLs. The dotted lines indicate the EC50 between the most sensitive and most resistant PDCLs. P indicates the statistical difference between TKCC 10 (GPOL HRD test positive) and TKCC15 (DDR proficient) using nonlinear regression analysis. (D) PDX 2133 and (E) PDX 2179 (DDR deficient) treated with a panel of DNA-damaging agents and gemcitabine. The colored arrows indicate redosing of specific agents. M, mol/L.
Figure 3
Figure 3
Replication stress in PDCLs of PC. (A) Heatmap of pathways and molecular processes (GO terms) involved in DNA maintenance and cell cycle regulation activated in replication stress and DNA damage response. PDCLs are ranked from right to left based on the decreasing novel transcriptomic signature score of replication stress, and molecular subtype is indicated in the top bar showing the association between activation of replication stress and the squamous subtype (P < .001, chi-square test, low vs high). (B, C) Immunofluorescent quantifications of (B) γH2AX and (C) pRPA at normal conditions are elevated in the squamous (blue) but not the classical pancreatic (orange) PDCLs. (D) Proteomic analysis using RPPA of a panel of PDCLs showed that replication stress response proteins are differentially activated in the squamous subtype. (E) Heatmap showing oncogene expression in PDCLs ranked from right to left by replication stress signature. Squamous PDCLs are enriched for oncogene activation and replication stress. (F) siRNA screening showing transcriptome functional interaction subnetwork, showing preferential dependencies of cell cycle control and DNA maintenance genes in the squamous subtype. Different node colors represent dependencies in different molecular subtypes, and the size of each node is relative to the number of siRNA hits. FC, fold change.
Figure 4
Figure 4
Targeting replication stress in PC. Dose response curves (EC50 shift) for (A) ATR and (B) WEE1 inhibitors calculated by using MTS assay in PDCLs after 72 hours of drug treatment. (C, D) Mean relative EC50 for PDCLs stratified by replication stress score. Patient-derived organoid drug screening dose response curves (EC50 shift) for (E) ATR and (G) WEE1 inhibitors calculated by using MTS assay after 72 hours of drug treatment. (F, H) Mean relative EC50 for PDCLs stratified by replication stress score. Each boxplot represents mean EC50, and box and whiskers represent minimum and maximum EC50 with 95% confidence interval. P calculated by using Mann-Whitney test between mean EC50 in each group.
Figure 5
Figure 5
Relationship between DDR deficiency, replication stress, and therapeutic response in PDCLs of PC. PDCLs are ranked based on a novel transcriptomic signature of replication stress (y-axis) and a composite genomic readout of DDR deficiency (x-axis). DDR deficiency is a hierarchical score that incorporates the COSMIC BRCA mutational signature (signature 3), the number of structural variants distributed across the genome, and the GPOL HRD test associated with BRCA deficiency. Relative HRDetect score is indicated by colored scale. The combination of high/low states of each characteristic results in 4 groups. Squamous subtype PDCLs (blue squares) are associated with high replication stress (P = .007, chi-square test). PDCLs tested are identified and encircled in blue. DDR deficiency and the replication stress signature predicted differential therapeutic response.
Supplementary Figure 1
Gene program dysregulation in PC PDCLs. (A) Comparison of gene programs (GP) of bulk tumor previously described and GPs identified in PDCLs by WGCNA; ranked by GP module preservation on the x-axis. (B) Heatmap of PDCLs classified into squamous (blue) and classical pancreatic (orange) subtypes showing GP module eigengene (ME) values. (C) The expression of components of publicly curated molecular pathways and mechanisms in PDCLs related to replication and DNA damage repair. GPs are grouped into key molecular processes that are important in carcinogenesis. ECM, extracellular matrix; TGF, transforming growth factor.
Supplementary Figure 2
Mutational landscape and subtype-specific siRNA screening dependencies of PC PDCLs. (A) Oncoplot of somatic mutations of significantly mutated genes in PDCLs. Structural variations (green), nonsilent mutations (blue), deletion (purple), and amplification of ≥8 copies (red). (B) Oncoplot of somatic and germline mutations in key genes known to contribute to DDR and its mutation rate. (C) siRNA hits across all PDCLs grouped into molecular processes of DDR.
Supplementary Figure 3
Targeting replication stress in PC PDCLs. (A) Replication stress can be induced by multiple factors, including oncogenic activation (KRAS, MYC) and chemotherapeutics (eg, platinum). This results in stalled replication forks when DNA polymerases (Pol) are separated from DNA helicase (HEL). This results in the coating of single-strand DNA by replication protein A (RPA), which results in ATR activation. This, in turn, generates the replication stress response via CHK1 and WEE1, resulting in checkpoint activation and DNA repair. This safeguards the integrity of the genome by preventing entry into mitosis with incompletely replicated genomes. (B) Agents currently in clinical trials or approved for use in other cancer types that target cell cycle checkpoints. Cell viability curves for agents inhibiting (C) CDK4/6 (palbociclib), (D) PLK4 (CDI-400945), and (E) CHK1 (AZD7762). PDCLs were classified by replication stress signature score as high (red), medium (orange), and low (black). (F) Differences in sensitivity to ATR inhibitor (AZD6738) in squamous and classical cell lines. (G) Differences in sensitivity to WEE1 inhibitor (AZD1775) in squamous and classical cell lines. (H) Response to DNA damaging agents and agents targeting cell cycle checkpoint. Colored heatmap reflects replication stress signature score and relative HRDetect score (red indicates high; blue indicates low) and drug sensitivity (green indicates most sensitive; red indicates resistant). In general, PDCLs with high replication stress are more sensitive to ATR and WEE1 inhibition, irrespective of DDR status. In general, platinum sensitivity is dependent on DDR status, irrespective of replication stress signature score. dNTP, deoxynucleotide triphosphate.
Supplementary Figure 4
Replication stress in PC PDCLs. (A) Immunofluorescent quantification of pRPA and yH2AX after 4 Gy of ionizing radiation (IR) in classical pancreatic (orange) and squamous (blue) PDCLs. pRPA- and γH2AX-positive cells are defined as cells with >10 foci of pRPA and γH2AX per cell. (B) Immunofluorescent images of TKCC10 (squamous) and Mayo-4636 (classical pancreatic) PDCLs at normal and at 4 and 20 hours after 4 Gy IR. (C) Violin plots of RPPA analysis showing differential expression of (phospho-)proteins in, cell cycle, and DNA damage pathways between subtypes. Kruskal-Wallis test was used for violin plot P values. FG, femtogram.
Supplementary Figure 5
Targeting replication stress and DDR deficiency in clinical cohorts of PC. (A) Bulk tumor samples from the ICGC PC cohort that have undergone both whole-genome sequencing and RNAseq are ranked from left to right based on the COSMIC BRCA mutational signature as a scale of DDR deficiency (x-axis) and top to bottom by the novel transcriptomic signature of replication stress (y-axis). HR pathway gene mutations and source of tissue sequenced are marked along the x-axis. Platinum response is marked along x-axis, and the related patient is encircled at individual points, where green represents response, and red indicates resistance. An asterisk indicates PDX response data. Relevant molecular subtype frequency (squamous vs classical pancreatic) is indicated for each quadrant, showing that squamous PC was associated with high-ranking replication stress score (15 out of 41 vs 5 out of 42) (P = .009, chi-square test). (B) The replication stress signature in the Precision-Panc endoscopic ultrasonography fine-needle biopsy training cohort, showing its clinical utility in the advanced disease setting (34% of cohort was locally advanced, and 37% was metastatic). The top-ranking quartile of replication stress signature scored as high showed that 50% of squamous tumors were within this group, compared to only 21% of the classical pancreatic tumors (P = .027, chi-square test). EUS, endoscopic ultrasonography; SNV, single-nucleotide variant.
Supplementary Figure 6
Replication stress signature in published bulk tumor cohorts of PC. The association between molecular subtype and replication stress in the (A) ICGC RNAseq (n = 94), (B) TCGA (n = 112), and (C) ICGC microarray (n = 232) cohorts. In the ICGC (P = .006), TCGA (P = .009), and ICGC microarray cohorts (P = .037), high replication stress was significantly enriched for the squamous subtype. High replication stress was defined as the top-ranking quartile in this cohort; P was calculated using the chi-square test.

References

    1. Siegel R.L., Miller K.D., Jemal A. Cancer statistics, 2019. CA Cancer J Clin. 2019;69:7–34. - PubMed
    1. Rahib L., Smith B.D., Aizenberg R. Projecting cancer incidence and deaths to 2030: the unexpected burden of thyroid, liver, and pancreas cancers in the United States. Cancer Res. 2014;74:2913–2921. - PubMed
    1. Biankin A.V., Waddell N., Kassahn K.S. Pancreatic cancer genomes reveal aberrations in axon guidance pathway genes. Nature. 2012;491(7424):399–405. - PMC - PubMed
    1. Waddell N., Pajic M., Patch A.M. Whole genomes redefine the mutational landscape of pancreatic cancer. Nature. 2015;518(7540):495–501. - PMC - PubMed
    1. Bailey P., Chang D.K., Nones K. Genomic analyses identify molecular subtypes of pancreatic cancer. Nature. 2016;531(7592):47–52. - PubMed

Supplementary References

    1. Langfelder P., Horvath S. WGCNA: an R package for weighted correlation network analysis. BMC Bioinformatics. 2008;9:559. - PMC - PubMed
    1. Campbell J., Ryan C.J., Brough R. Large-scale profiling of kinase dependencies in cancer cell lines. Cell Rep. 2016;14:2490–2501. - PMC - PubMed
    1. Boutros M., Bras L.P., Huber W. Analysis of cell-based RNAi screens. Genome Biol. 2006;7(7):R66. - PMC - PubMed
    1. Zhang J.H., Chung T.D., Oldenburg K.R. A simple statistical parameter for use in evaluation and validation of high throughput screening assays. J Biomol Screen. 1999;4:67–73. - PubMed
    1. Parrish R.S., Spencer H.J., 3rd Effect of normalization on significance testing for oligonucleotide microarrays. J Biopharm Stat. 2004;14:575–589. - PubMed

Publication types