. 2021 Jan:91:296-314.
doi: 10.1016/j.bbi.2020.10.008. Epub 2020 Oct 8.

Dexmedetomidine attenuates sepsis-associated inflammation and encephalopathy via central α2A adrenoceptor

Affiliations

Dexmedetomidine attenuates sepsis-associated inflammation and encephalopathy via central α2A adrenoceptor

Bin Mei et al. Brain Behav Immun. 2021 Jan.

Abstract

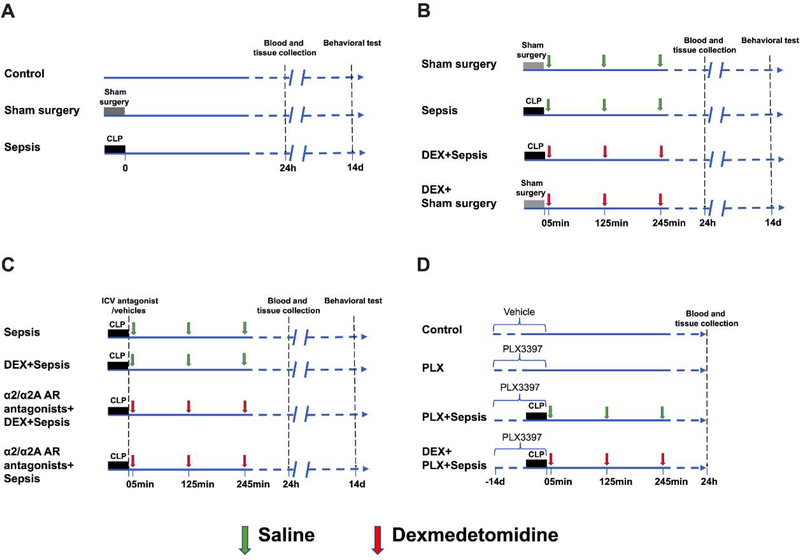
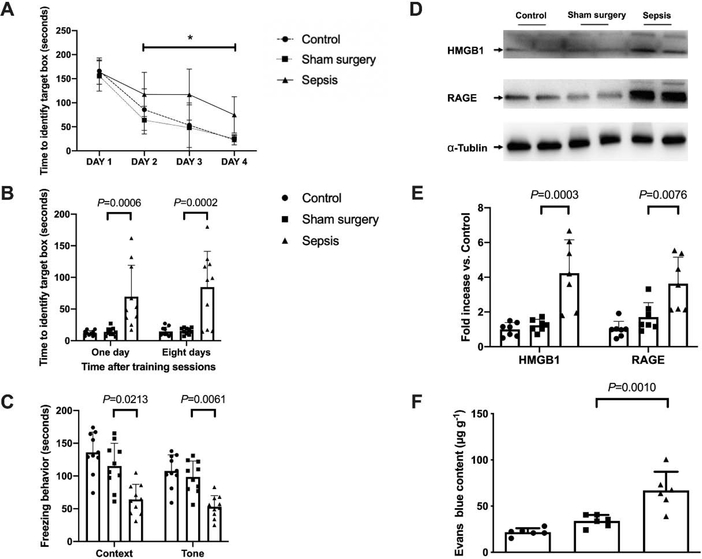
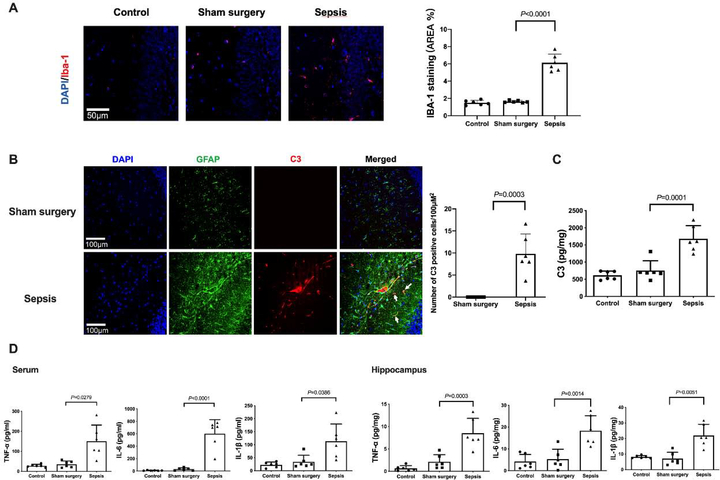
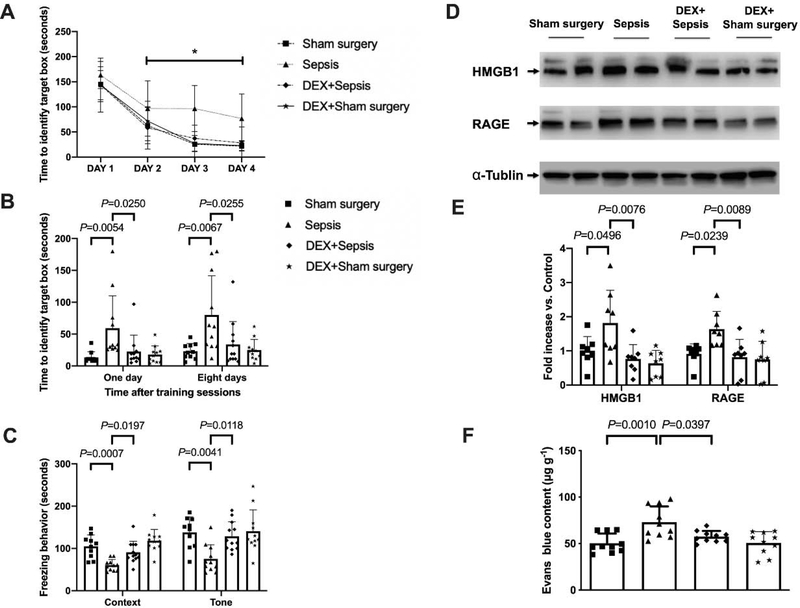
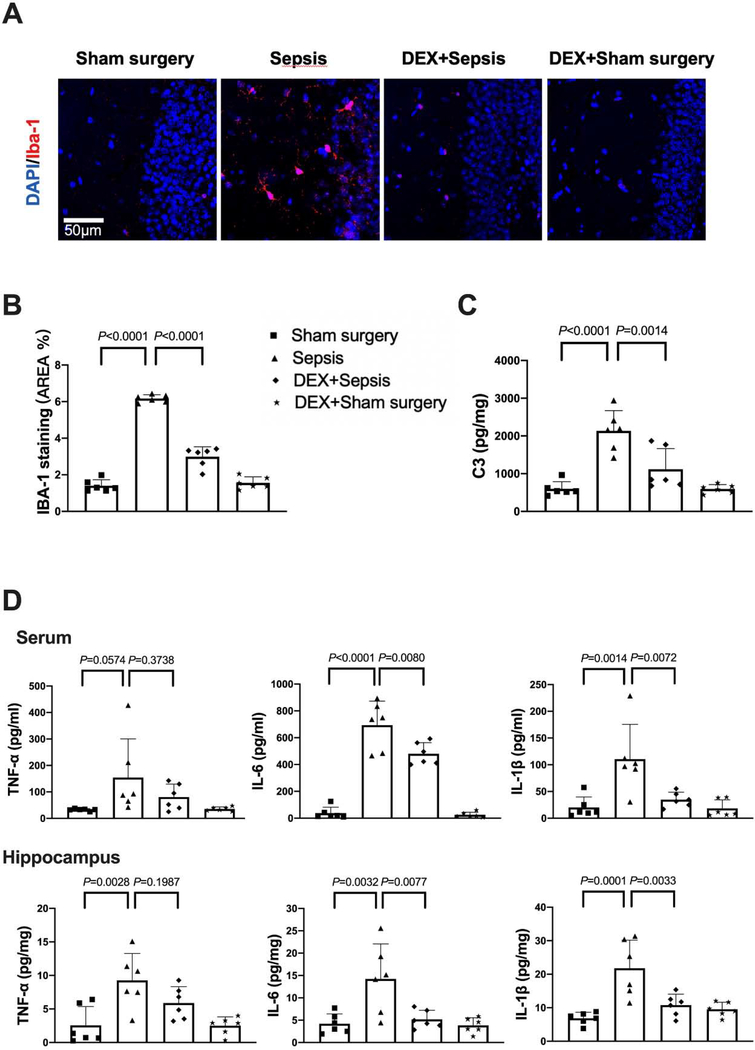
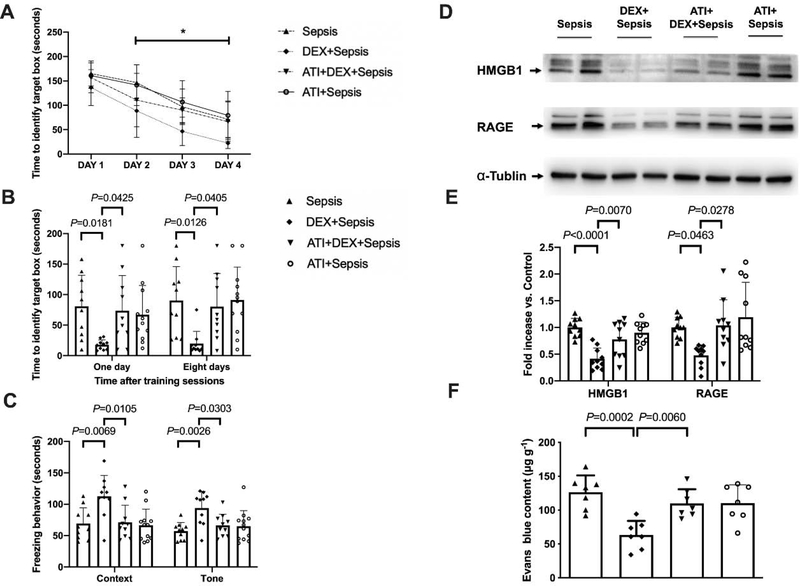
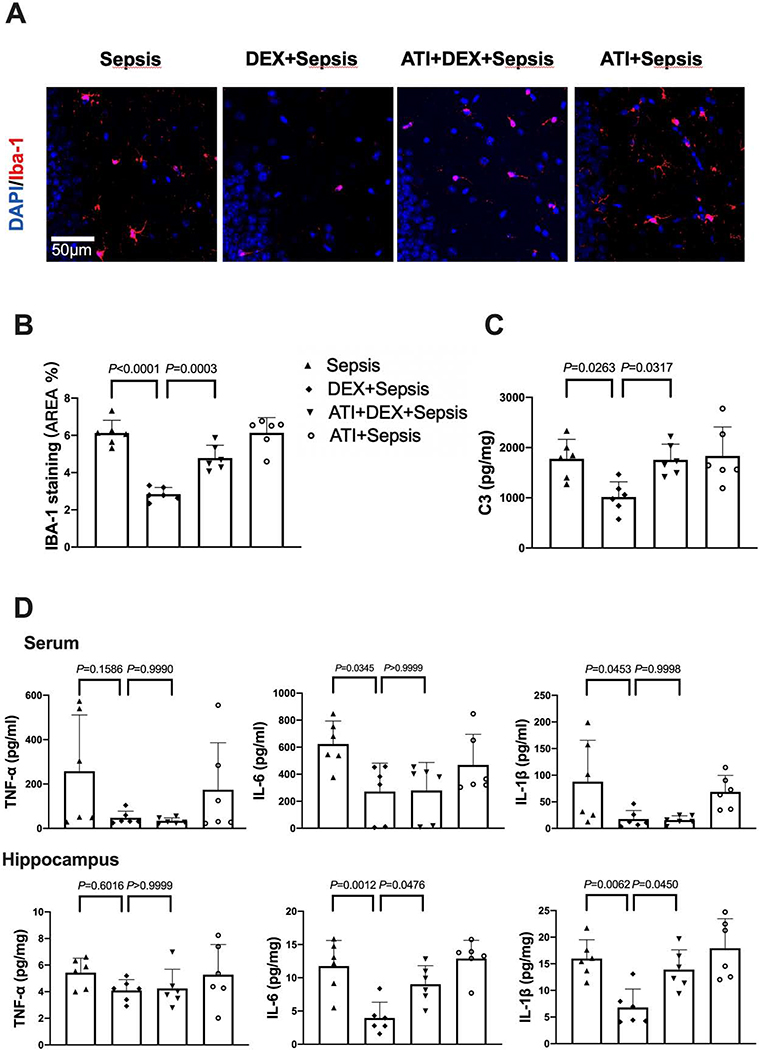
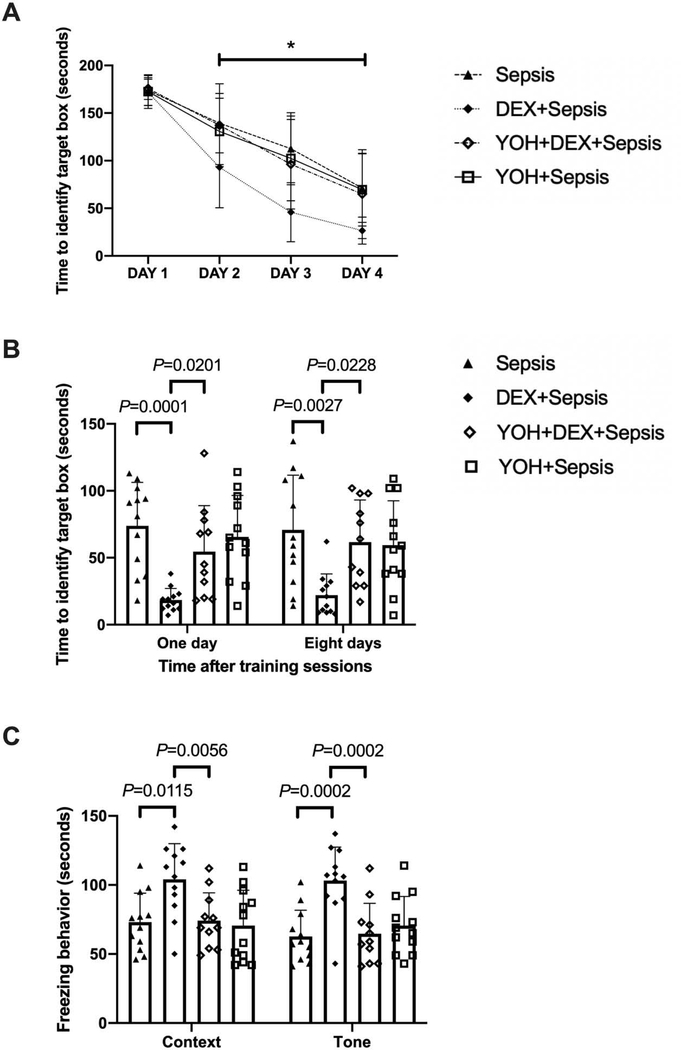
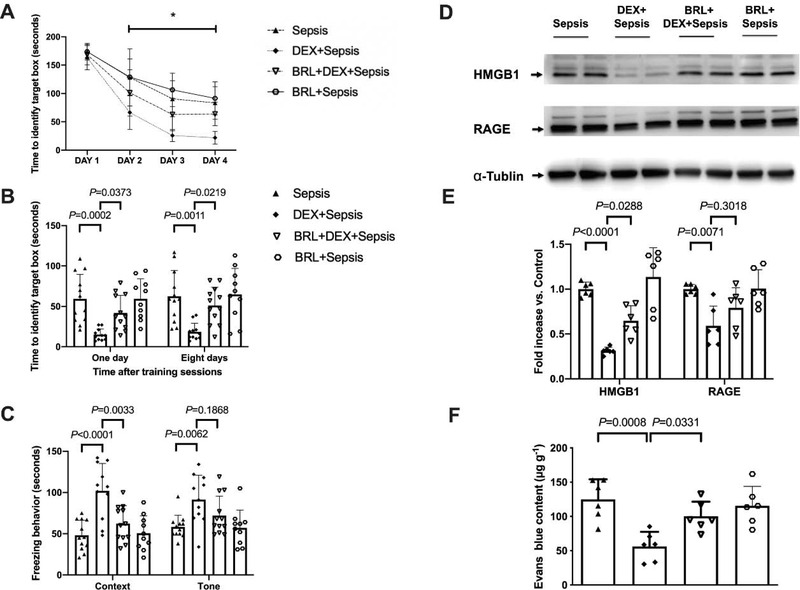
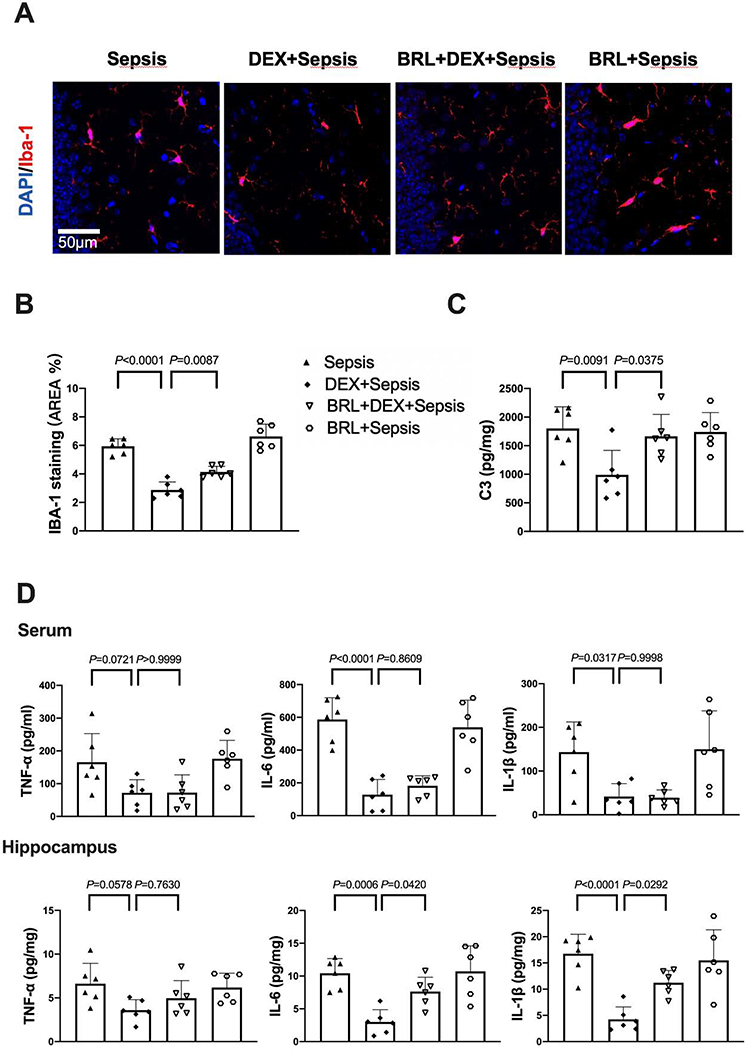
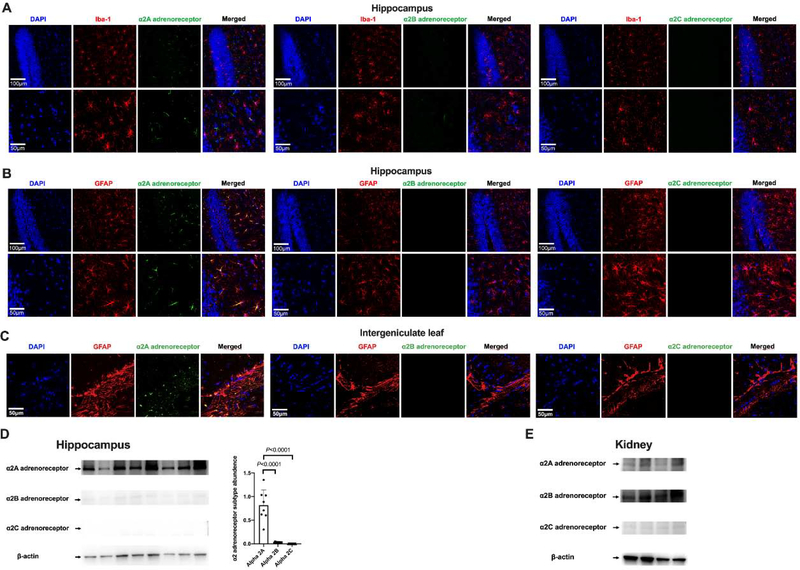
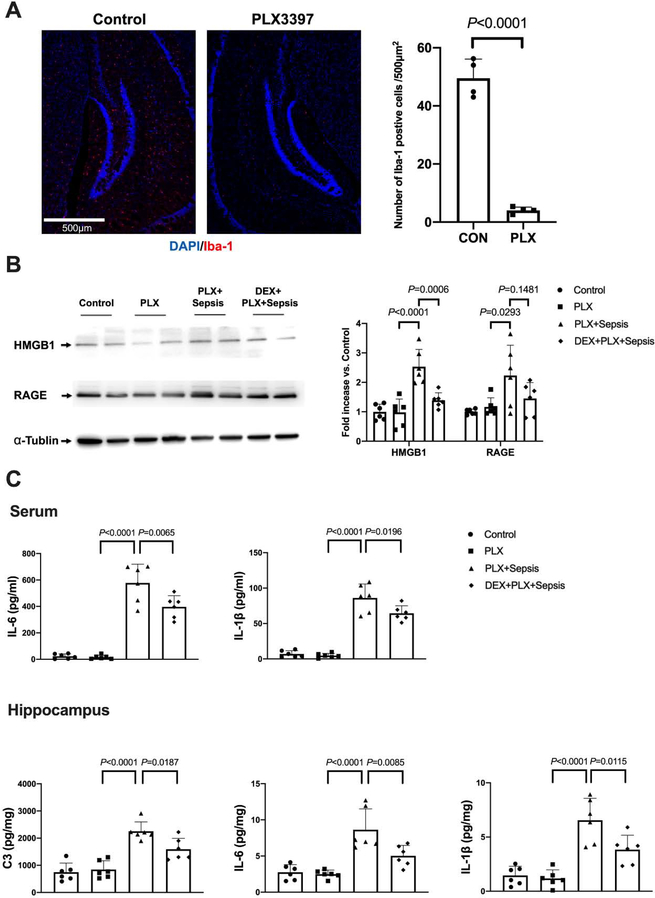
Sepsis-associated encephalopathy (SAE) is a significant clinical issue that is associated with increased mortality and cost of health care. Dexmedetomidine, an α2 adrenoceptor agonist that is used to provide sedation, has been shown to induce neuroprotection under various conditions. This study was designed to determine whether dexmedetomidine protects against SAE and whether α2 adrenoceptor plays a role in this protection. Six- to eight-week old CD-1 male mice were subjected to cecal ligation and puncture (CLP). They were treated with intraperitoneal injection of dexmedetomidine in the presence or absence of α2 adrenoceptor antagonists, atipamezole or yohimbine, or an α2A adrenoceptor antagonist, BRL-44408. Hippocampus and blood were harvested for measuring cytokines. Mice were subjected to Barnes maze and fear conditioning 14 days after CLP to evaluate their learning and memory. CLP significantly increased the proinflammatory cytokines including tumor necrosis factor α, interleukin (IL)-6 and IL-1β in the blood and hippocampus. CLP also increased the permeability of blood-brain barrier (BBB) and impaired learning and memory. These CLP detrimental effects were attenuated by dexmedetomidine. Intracerebroventricular application of atipamezole, yohimbine or BRL-44408 blocked the protection of dexmedetomidine on the brain but not on the systemic inflammation. Astrocytes but not microglia expressed α2A adrenoceptors. Microglial depletion did not abolish the protective effects of dexmedetomidine. These results suggest that dexmedetomidine reduces systemic inflammation, neuroinflammation, injury of BBB and cognitive dysfunction in septic mice. The protective effects of dexmedetomidine on the brain may be mediated by α2A adrenoceptors in the astrocytes.

Keywords: Astrocytes; Dexmedetomidine; Sepsis; Sepsis-associated encephalopathy; α2A adrenoceptor.


Conflict of interest statement

Competing interests: The authors declare no competing interests.

Figures

Fig. 1.
Fig. 1.
Diagram of experiments. (A) Mice were randomly allocated to 3 groups: control, sham surgery and sepsis groups. Blood and tissues were collected at 24 h after cecal ligation and puncture (CLP) or sham surgery. Fourteen days after CLP or sham surgery, Barnes maze and fear conditioning tests were used to determine the learning and memory function of mice. (B) Mice were randomly allocated to 4 groups: sham surgery, sepsis, dexmedetomidine + sham surgery, and dexmedetomidine + sepsis groups. Blood and tissues were collected at 24 h after CLP or sham surgery. Fourteen days after CLP or sham surgery, Barnes maze and fear conditioning tests were used to determine the learning and memory function of mice. (C) Mice were randomly allocated to 4 groups: sepsis, dexmedetomidine + sepsis, intracerebroventricular α2/α2A adrenoceptor antagonists + dexmedetomidine + sepsis and intracerebroventricular α2/α2A adrenoceptor antagonists + sepsis groups. The α2 adrenoceptor antagonist was atipamezole or yohimbine and α2A adrenoceptor antagonist was BRL-44408. Blood and tissues were collected at 24 h after CLP. Fourteen days after CLP or sham surgery, Barnes maze and fear conditioning tests were used to determine the learning and memory function of mice. (D) Mice were randomly allocated to 4 groups: control, PLX3397, PLX3397 + sepsis and dexmedetomidine + PLX3397 + sepsis groups. Blood and tissues were collected at 24 h after CLP. Since harvesting blood and tissues are terminal procedures, the animals for harvesting blood and tissues were a different cohort from those animals used in behavioral testing.
Fig. 2.
Fig. 2.
Sepsis impaired learning, memory and BBB integrity in mice. (A) Training sessions of Barnes maze. (B) Memory phase of Barnes maze. (C) Context- and tone-related fear conditioning test. (D) Representative Western blotting images of samples from the hippocampus. (E) Quantitative results of HMGB1 and RAGE in the hippocampus. (F) Quantification of Evans blue permeated into the hippocampus. All results are expressed as mean ± S.D. (n = 10 in each group for panels A to C; n = 7 in each group for Western blotting data; n = 6 in each group for Evans blue quantification data). Each animal data point in the bar graph is also presented. * P < 0.05 compared with the corresponding data on day 1.
Fig. 3.
Fig. 3.
Sepsis induced systemic inflammation and neuroinflammation. (A) Left panel: representative immunofluorescent images. Scale bar = 50 μm. Right panel: quantitative results of the percentage of Iba-1 positive area in the total area of the image (whole microscopic field) in the hippocampus. (B) Left panel: representative immunofluorescent images. Scale bar = 100 μm. Arrows indicate representative co-localization of C3 staining and GFAP staining. Right panel: quantitative results of C3 positive cell density. (C) C3 concentration in the hippocampus. (D) Concentrations of TNF-α, IL-6 and IL-1β in the serum and hippocampus. All results are expressed as mean ± S.D. (n = 6 in each group). Each animal data point in the bar graph is also presented.
Fig. 4.
Fig. 4.
Dexmedetomidine attenuated sepsis-impaired learning, memory and BBB integrity in mice. (A) Training sessions of Barnes maze. (B) Memory phase of Barnes maze. (C) Context- and tone-related fear conditioning test. (D) Representative Western blotting images of samples from the hippocampus. (E) Quantitative results of HMGB1 and RAGE in the hippocampus. (F) Quantification of Evans blue permeated into the hippocampus. All results are expressed as mean ± S.D. (n = 10 – 12 in each group for panels A to C; n = 8 in each group for Western blotting data; n = 10 in each group for Evans blue quantification data). Each animal data point in the bar graph is also presented. * P < 0.05 compared with the corresponding data on day 1. Dex: dexmedetomidine.
Fig. 5.
Fig. 5.
Dexmedetomidine attenuated sepsis-induced systemic inflammation and neuroinflammation. (A) Representative immunofluorescent images. Scale bar = 50 μm. (B) Quantitative results of the percentage of Iba-1 positive area in the total area of the image in the hippocampus. (C) C3 concentration in the hippocampus. (D) Concentrations of TNF-α, IL-6 and IL-1β in the serum and hippocampus. All results are expressed as mean ± S.D. (n = 6 in each group). Each animal data point in the bar graph is also presented. Dex: dexmedetomidine.
Fig. 6.
Fig. 6.
Intracerebroventricular α2 adrenoceptor antagonist (atipamezole) reduced dexmedetomidine protection on sepsis-impaired learning, memory and BBB integrity in mice. (A) Training sessions of Barnes maze. (B) Memory phase of Barnes maze. (C) Context- and tone-related fear conditioning test. (D) Representative Western blotting images of samples from the hippocampus. (E) Quantitative results of HMGB1 and RAGE in the hippocampus. (F) Quantification of Evans blue permeated into the hippocampus. All results are expressed as mean ± S.D. (n = 10 – 12 in each group for panels A to C; n = 10 in each group for Western blotting data; n = 7 in each group for Evans blue quantification data). Each data point in the bar graph is also presented. * P < 0.05 compared with the corresponding data on day 1. ATI: atipamezole, Dex: dexmedetomidine.
Fig. 7.
Fig. 7.
Intracerebroventricular α2 adrenoceptor antagonist (atipamezole) reduced dexmedetomidine protection on sepsis-induced systemic inflammation and neuroinflammation. (A) Representative immunofluorescent images. Scale bar = 100 μm in the upper panel and = 50 μm in the lower panel. (B) Quantitative results of the percentage of Iba-1 positive area in the total area of the image in the hippocampus. (C) C3 concentration in the hippocampus. (D) Concentrations of TNF-α, IL-6 and IL-1β in the serum and hippocampus. All results are expressed as mean ± S.D. (n = 6 in each group). Each animal data point in the bar graph is also presented. ATI: atipamezole, Dex: dexmedetomidine.
Fig. 8.
Fig. 8.
Intracerebroventricular α2 adrenoceptor antagonist (yohimbine) reduced dexmedetomidine protection on sepsis-impaired learning and memory in mice. (A) Training sessions of Barnes maze. (B) Memory phase of Barnes maze. (C) Context- and tone-related fear conditioning test. All results are expressed as mean ± S.D. (n = 11 – 12 in each group for panels A to C). Each data point in the bar graph is also presented. * P < 0.05 compared with the corresponding data on day 1. Dex: dexmedetomidine, Yoh: yohimbine.
Fig. 9.
Fig. 9.
Intracerebroventricular α2A adrenoceptor antagonist (BRL-44408) reduced dexmedetomidine protection on sepsis-impaired learning, memory and BBB integrity in mice. (A) Training sessions of Barnes maze. (B) Memory phase of Barnes maze. (C) Context- and tone-related fear conditioning test. (D) Representative Western blotting images of samples from the hippocampus. (E) Quantitative results of HMGB1 and RAGE in the hippocampus. (F) Quantification of Evans blue permeated into the hippocampus. All results are expressed as mean ± S.D. (n = 10 – 12 in each group for panels A to C; n = 6 in each group for Western blotting data; n = 6 in each group for Evans blue quantification data). Each animal data point in the bar graph is also presented. * P < 0.05 compared with the corresponding data on day 1. BRL: BRL-44408, Dex: dexmedetomidine.
Fig. 10.
Fig. 10.
Intracerebroventricular α2A adrenoceptor antagonist (BRL-44408) reduced dexmedetomidine protection on sepsis-induced systemic inflammation and neuroinflammation. (A) Representative immunofluorescent images. Scale bar = 100 μm in the upper panel and = 50 μm in the lower panel. (B) Quantitative results of the percentage of Iba-1 positive area in the total area of the image in the hippocampus. (C) C3 concentration in the hippocampus. (D) Concentrations of TNF-α, IL-6 and IL-1β in the serum and hippocampus. All results are expressed as mean ± S.D. (n = 6 in each group). Each animal data point in the bar graph is also presented. BRL: BRL-44408, Dex: dexmedetomidine.
Fig. 11.
Fig. 11.
Immunofluorescent staining and Western blotting analysis of α2 adrenoceptor subtypes in the brain and kidneys. (A) Co-localization of α2 adrenoceptor subtypes with Iba-1 in the hippocampus. (B) Co-localization α2 adrenoceptor subtypes with GFAP in the hippocampus. Scale bar = 100 μm in the upper panel and = 50 μm in the lower panel for panels A and B. (C) Co-localization α2 adrenoceptor subtypes with GFAP in the intergeniculate leaf. Scale bar = 50 μm. (D) Left panel: representative Western blotting images of samples from the hippocampus. Right panel: quantitative results of HMGB1 and RAGE in the hippocampus. Results are expressed as mean ± S.D. (n = 8 in each group). Each animal data point in the bar graph is also presented. (E) Representative Western blotting images of samples from the kidneys.
Fig. 12.
Fig. 12.
Dexmedetomidine remained to be effective to reduce systemic inflammation and neuroinflammation in septic mice depleted of microglia. (A) Presentation of microglial depletion by PLX3397. Left panel is representative images of Iba-1 immunostaining. Scale bar = 500 μm. Right panel is quantification of Iba-1 positive cells. (B) Representative Western blotting images. (C) Concentrations of IL-6 and IL-1β in the serum and concentrations of C3, IL-6 and IL-1β in the hippocampus. All results are expressed as mean ± S.D. (n = 4 for panel A; n = 6 in each group for all other panels). Each animal data point in the bar graph is also presented. PLX: PLX3397, Dex: dexmedetomidine.

References

    1. Allnoch L, Baumgartner W, Hansmann F, 2019. Impact of Astrocyte Depletion upon Inflammation and Demyelination in a Murine Animal Model of Multiple Sclerosis. Int J Mol Sci 20 (16), - PMC - PubMed
    1. Cao L, Li L, Lin D, Zuo Z, 2012. Isoflurane induces learning impairment that is mediated by interleukin 1beta in rodents. PLoS ONE 7 (12), e51431. - PMC - PubMed
    1. Clarke LE, Liddelow SA, Chakraborty C, Munch AE, Heiman M, Barres BA, 2018. Normal aging induces A1-like astrocyte reactivity. PNAS 115 (8), E1896–E1905. - PMC - PubMed
    1. Cobos-Puc LE, Aguayo-Morales H, Silva-Belmares Y, Gonzalez-Zavala MA, Centurion D, 2016. alpha2A-adrenoceptors, but not nitric oxide, mediate the peripheral cardiac sympatho-inhibition of moxonidine. Eur J Pharmacol 782 35–43. - PubMed
    1. Colonna M, Butovsky O, 2017. Microglia Function in the Central Nervous System During Health and Neurodegeneration. Annu Rev Immunol 35 441–468. - PMC - PubMed

Publication types