

Effects of COVID-19 lockdown on global air quality and health
- PMID: 33039885
- PMCID: PMC7525347
- DOI: 10.1016/j.scitotenv.2020.142533
Effects of COVID-19 lockdown on global air quality and health
Abstract
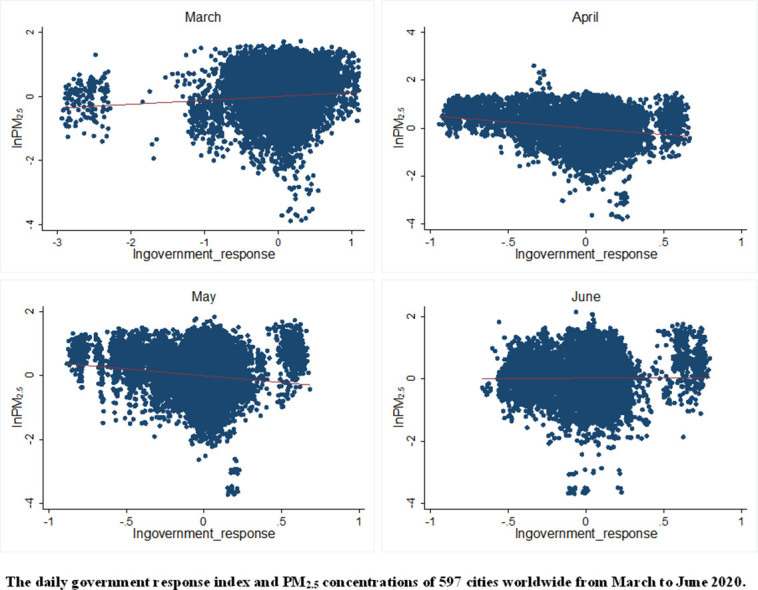
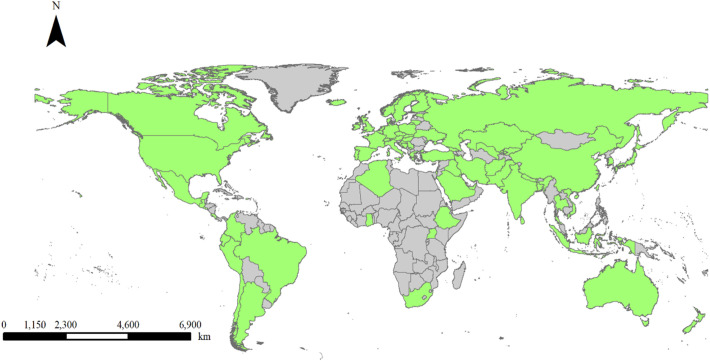
The COVID-19 pandemic has put much of the world into lockdown, as one unintended upside to this response, the air quality has been widely reported to have improved worldwide. Existing studies examine the environmental effect of lockdowns at a city- or country-level, few examines it from a global perspective. Using a novel COVID-19 government response tracker dataset, combining the daily air pollution data and weather data across 597 major cities worldwide between January 1, 2020, and July 5, 2020, this study quantifies the causal impacts of 8 types of lockdown measures on changes of a range of individual pollutants based on a difference-in-differences design. The results show that the NO2 air quality index value falls more precipitously (23-37%) relative to the pre-lockdown period, followed by PM10 (14-20%), SO2 (2-20%), PM2.5 (7-16%), and CO (7-11%), but the O3 increases 10-27%. Furthermore, intra/intercity travel restrictions have a better performance in curbing air pollution. These results are robust to a set of alternative specifications, including different panel sizes, independent variables, estimation strategies. The heterogeneity analysis in terms of different types of cities shows that the lockdown effects are more remarkable in cities from lower-income, more industrialized, and populous countries. We also do a back-of-the-envelope calculation of the subsequent health benefits following such improvement, and the expected averted premature deaths due to air pollution declines are around 99,270 to 146,649 among 76 countries and regions involved in this study during the COVID-19 lockdown. These findings underscore the importance of continuous air pollution control strategies to protect human health and reduce the associated social welfare loss both during and after the COVID-19 pandemic.
Keywords: Air pollution; COVID-19; Difference-in-differences analysis; Health benefits; Lockdown.
Copyright © 2020 Elsevier B.V. All rights reserved.
Conflict of interest statement
Declaration of competing interest The authors declare that they have no known competing financial interests or personal relationships that could have appeared to influence the work reported in this paper.
Figures


References
-
- Beaudoin J., Lin Lawell C.-Y.C. Is public transit's “green” reputation deserved?: evaluating the effects of transit supply on air quality. [Working paper] 2016. http://www.des.ucdavis.edu/faculty/Lin/transit_airquality_paper.pdf
-
- Callaway B., Sant’Anna P.H.C. Difference-in-differences with multiple time periods. SSRN. 2018 doi: 10.2139/ssrn.3148250. - DOI
-
- Centers for Disease Control and Prevention (CDC) Symptoms of coronavirus. 2020. https://www.cdc.gov/coronavirus/2019-ncov/about/symptoms.html
-
- Cole M., Elliott R., Liu B. Discussion Papers from Department of Economics, University of Birmingham; 2020. The Impact of the Wuhan Covid-19 Lockdown on Air Pollution and Health: A Machine Learning and Augmented Synthetic Control Approach.https://econpapers.repec.org/paper/birbirmec/20-09.htm - PMC - PubMed
MeSH terms
Substances
LinkOut - more resources
Full Text Sources
Other Literature Sources
Medical
