. 2021 Jan 29;36(21):5139-5144.
doi: 10.1093/bioinformatics/btaa640.

Efficient dynamic variation graphs

Affiliations

Efficient dynamic variation graphs

Jordan M Eizenga et al. Bioinformatics. .

Abstract

Motivation: Pangenomics is a growing field within computational genomics. Many pangenomic analyses use bidirected sequence graphs as their core data model. However, implementing and correctly using this data model can be difficult, and the scale of pangenomic datasets can be challenging to work at. These challenges have impeded progress in this field.

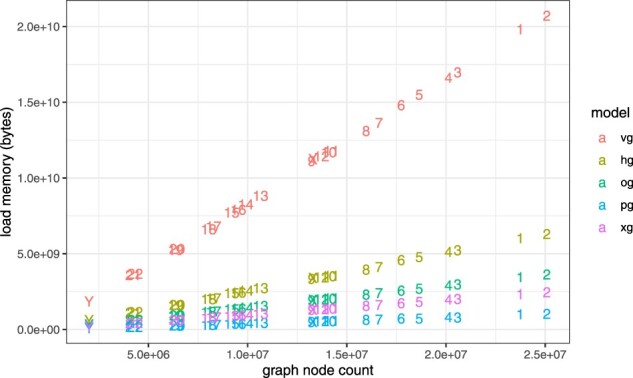
Results: Here, we present a stack of two C++ libraries, libbdsg and libhandlegraph, which use a simple, field-proven interface, designed to expose elementary features of these graphs while preventing common graph manipulation mistakes. The libraries also provide a Python binding. Using a diverse collection of pangenome graphs, we demonstrate that these tools allow for efficient construction and manipulation of large genome graphs with dense variation. For instance, the speed and memory usage are up to an order of magnitude better than the prior graph implementation in the VG toolkit, which has now transitioned to using libbdsg's implementations.

Availability and implementation: libhandlegraph and libbdsg are available under an MIT License from https://github.com/vgteam/libhandlegraph and https://github.com/vgteam/libbdsg.


Figures

Fig. 1.
Fig. 1.
Entities in the bidirected sequence graph. Top: a variation graph showing nodes (yellow rectangles), each of which contain a forward and reverse strand (red solid and dashed rectangles, respectively). Strands show the node identifier, the direction (+ or –) and the sequence of the strand. Note that reverse strands show the reverse complement sequence of the forward strand. All edges are shown as connections between nodes, with forward-to-forward edges denoted by solid lines, and reverse-to-reverse edges denoted by dashed lines. Two edges that invert from forward to reverse and reverse to forward are shown with dotted lines. Edges run from the strand at their beginning to that at their end, as indicated by the arrowhead. Bottom: an illustration of four paths. Each has a name, and can be referenced by a handle, which are omitted for brevity. Each path is shown in its natural direction as a series of connected steps that refer to strands in the graph. The first two paths differ by a SNP, with one passing through 2+:T, and the other through 3+:G. The third path is the reverse complement of the first. The fourth is the same as the first, but contains an inversion, passing through 5-:AATC rather than 5+:GATT. (Color version of this figure is available at Bioinformatics online.)
Fig. 2.
Fig. 2.
Performance on a graph of structural variants from the HGSVC. Abbreviations used here and in subsequent figures and tables: vg, VG; hg, HashGraph; og, ODGI; pg, PackedGraph; xg, XG. All four new graph implementations compare favorably to VG. PackedGraph tends to be the most memory efficient, HashGraph tends to be the fastest, and ODGI is balanced in between. XG provides good performance on both memory usage and speed, but it is static
Fig. 3.
Fig. 3.
Memory requirements for model construction and loading. Memory costs versus graph sequence size for the graph collection, colored by HandleGraph model. The memory requirements for graph construction tend to be higher than those for loading the graph model. All methods show fixed overheads of several megabytes, seen in the flat tail to the left of both plots. Outside of this region, all methods show roughly linear scaling in both build and load costs per input base pair. The relative differences in memory costs appear to be stable between different methods across many orders of magnitude in graph size. (Color version of this figure is available at Bioinformatics online.)
Fig. 4.
Fig. 4.
Graph element enumeration performance. Iteration performance for edges, nodes and path steps for the full graph collection, shown in terms of elements per second. HashGraph provides the highest performance for all element iteration types on smaller graphs, but this performance falls of with larger graphs, presumably due to scaling properties of the backing hash tables. The same pattern can be seen for VG, although the overall performance is worse. Although it has the worst edge iteration performance, PackedGraph provides good performance on node and path step iteration. The relative path encoding in ODGI yields poor performance on path iteration, and node decoding overheads appear to reduce its node iteration performance, but it has good graph topology traversal performance, perhaps due to cache efficiency of the edge encoding. XG provides excellent iteration performance in all cases
Fig. 5.
Fig. 5.
Load memory versus node count for chromosome graphs built from 1000 Genomes Project variants and GRCh37. For each method, memory requirements are more strongly correlated with the number of nodes in the graph (R2=0.998) than with the graph sequence length (R2=0.986). Although the memory requirements are dominated by graph sequence size, node count will increase with variant density. Methods generally incur an overhead for each node that is larger than the sequence length. Linear scales clarify that the absolute difference in performance between VG and the other methods is substantial

References

    1. Brehm W. (2019) Hash tables with pseudorandom global order. INFOCOMP J. Comput. Sci., 18, 20–25.
    1. Chaisson M.J. et al. (2019) Multi-platform discovery of haplotype-resolved structural variation in human genomes. Nat. Commun., 10, 1784. - PMC - PubMed
    1. Computational Pan-Genomics Consortium. (2016) Computational pan-genomics: status, promises and challenges. Brief. Bioinf., 19, 118–135. - PMC - PubMed
    1. Crysnanto D., Pausch H. (2019) Sequence read mapping and variant discovery from bovine breed-specific augmented reference graphs. 10.1101/2019.12.20.882423. - DOI - PMC - PubMed
    1. Garg S. et al. (2018) A graph-based approach to diploid genome assembly. Bioinformatics, 34, i105–i114. - PMC - PubMed

Publication types