. 2021 Jan;15(1):167-194.
doi: 10.1002/1878-0261.12822. Epub 2020 Nov 19.

EBP2, a novel NPM-ALK-interacting protein in the nucleolus, contributes to the proliferation of ALCL cells by regulating tumor suppressor p53

Affiliations

EBP2, a novel NPM-ALK-interacting protein in the nucleolus, contributes to the proliferation of ALCL cells by regulating tumor suppressor p53

Yuki Uchihara et al. Mol Oncol. 2021 Jan.

Abstract

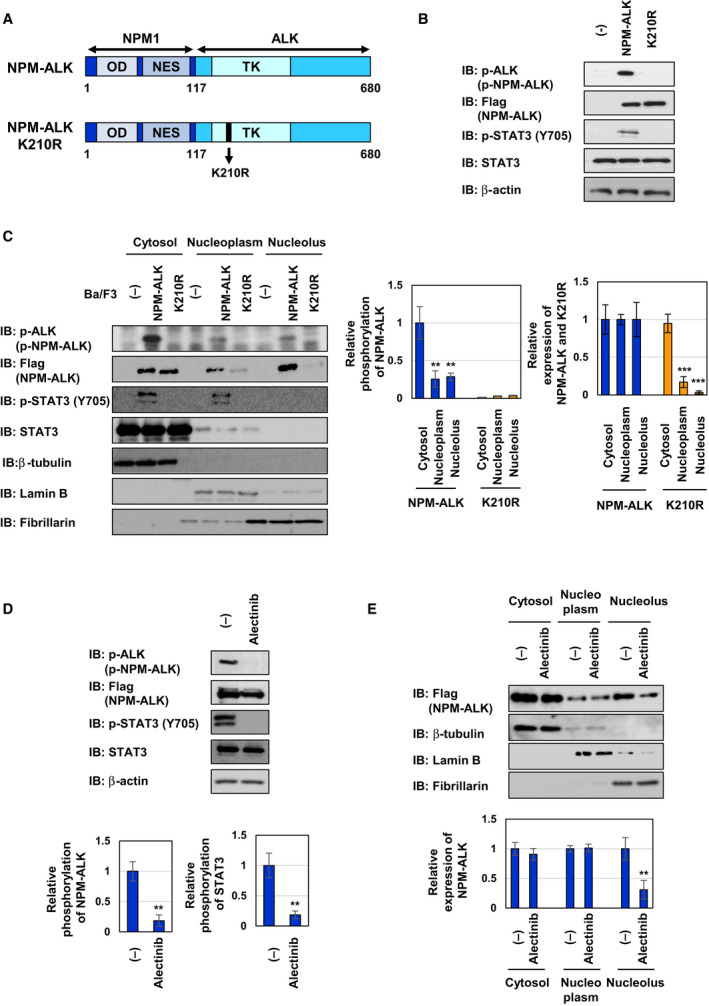
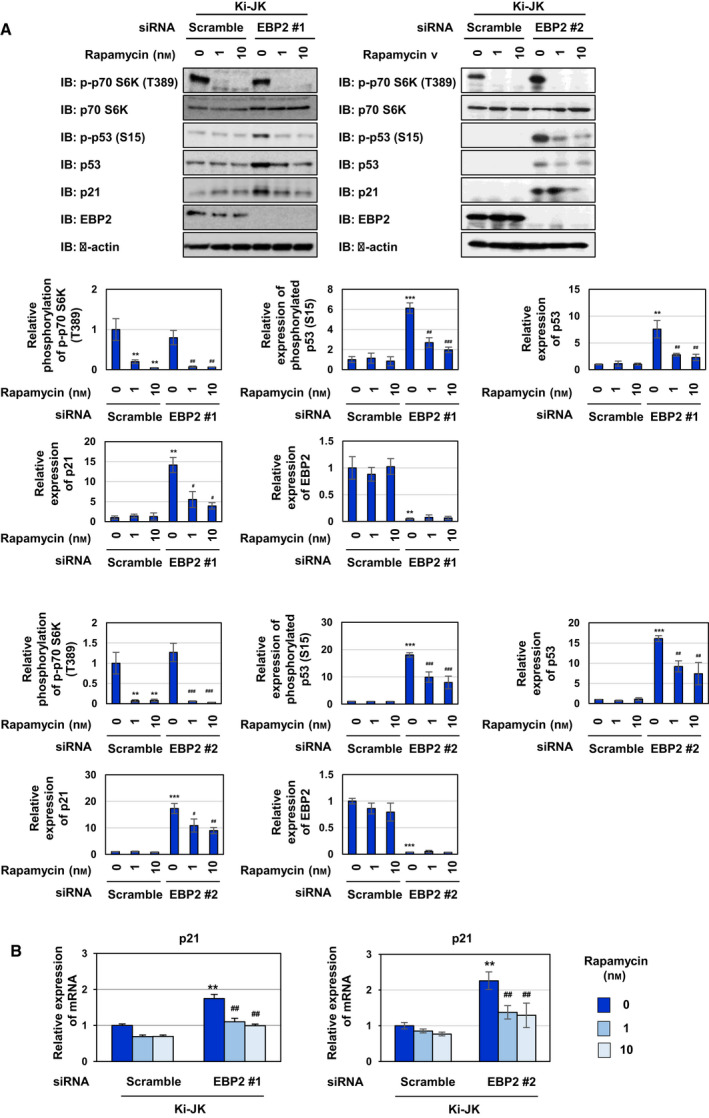
The oncogenic fusion protein nucleophosmin-anaplastic lymphoma kinase (NPM-ALK), found in anaplastic large-cell lymphoma (ALCL), localizes to the cytosol, nucleoplasm, and nucleolus. However, the relationship between its localization and transforming activity remains unclear. We herein demonstrated that NPM-ALK localized to the nucleolus by binding to nucleophosmin 1 (NPM1), a nucleolar protein that exhibits shuttling activity between the nucleolus and cytoplasm, in a manner that was dependent on its kinase activity. In the nucleolus, NPM-ALK interacted with Epstein-Barr virus nuclear antigen 1-binding protein 2 (EBP2), which is involved in rRNA biosynthesis. Moreover, enforced expression of NPM-ALK induced tyrosine phosphorylation of EBP2. Knockdown of EBP2 promoted the activation of the tumor suppressor p53, leading to G0 /G1 -phase cell cycle arrest in Ba/F3 cells transformed by NPM-ALK and ALCL patient-derived Ki-JK cells, but not ALCL patient-derived SUDH-L1 cells harboring p53 gene mutation. In Ba/F3 cells transformed by NPM-ALK and Ki-JK cells, p53 activation induced by knockdown of EBP2 was significantly inhibited by Akt inhibitor GDC-0068, mTORC1 inhibitor rapamycin, and knockdown of Raptor, an essential component of mTORC1. These results suggest that the knockdown of EBP2 triggered p53 activation through the Akt-mTORC1 pathway in NPM-ALK-positive cells. Collectively, the present results revealed the critical repressive mechanism of p53 activity by EBP2 and provide a novel therapeutic strategy for the treatment of ALCL.

Keywords: Akt; EBP2; NPM-ALK; mTORC1; nucleolus; p53.


Conflict of interest statement

The authors declare no conflict of interest.

Figures

Fig. 1
Fig. 1
The kinase activity of NPM‐ALK is required for its nucleolar localization. (A) Structure of NPM‐ALK and its kinase dead mutant K210R. (B, C) Ba/F3 cells were infected with an empty virus (−) and expressed NPM‐ALK and its kinase dead mutant K210R by retroviral infection. These cells were named as control Ba/F3 cells (−), Ba/F3‐NPM‐ALK, and Ba/F3‐K210R, respectively. Whole‐cell lysates (B) and cytosolic, nucleoplasmic, and nucleolar fractions (C) were prepared. (D, E) Ba/F3‐NPM‐ALK were treated with alectinib (0.25 μm) for 4 h. Whole‐cell lysates (D) and cytosolic, nucleoplasmic, and nucleolar fractions (E) were prepared. (B–E) Immunoblotting was performed using an anti‐phospho‐ALK (Tyr1604), anti‐Flag, anti‐phospho‐STAT3 (Tyr705), anti‐STAT3, anti‐β‐actin, anti‐β‐tubulin, anti‐lamin B, or anti‐fibrillarin antibody. The relative phosphorylation or expression levels of NPM‐ALK and STAT3 are shown in the graphs. Results represent the mean ± SD of three independent experiments. **P < 0.01, ***P < 0.001 significantly different from the control group.
Fig. 2
Fig. 2
NPM1 is required for the nuclear localization of NPM‐ALK. (A) Cell lysates were prepared from control Ba/F3 cells (−), Ba/F3‐NPM‐ALK, and Ba/F3‐K210R and were then immunoprecipitated with an anti‐Flag antibody. Immunoprecipitates and whole‐cell lysates were immunoblotted with an anti‐NPM1, anti‐Flag, or anti‐β‐actin antibody. (B) HEK293T cells were transiently transfected with an empty vector (−) or plasmids bearing NPM‐ALK, its kinase dead mutant K210R or Flag‐tagged NPM1. Cell lysates were immunoprecipitated with an anti‐Flag antibody. Immunoprecipitates and whole‐cell lysates were immunoblotted with an anti‐ALK, anti‐Flag, or anti‐β‐actin antibody. (C, D) NPM1−/−/p53−/−MEF and p53−/−MEF were infected with an empty virus (−) and expressed NPM‐ALK and its kinase dead mutant K210R by retroviral infection. (C) Whole‐cell lysates were prepared and immunoblotted with an anti‐phospho‐ALK (Tyr1604), anti‐Flag, anti‐NPM1, or anti‐β‐actin antibody. The relative phosphorylation levels of NPM‐ALK and its kinase dead mutant K210R are shown in the graph. Results represent the mean ± SD of three independent experiments. (D) Cytosolic, nucleoplasmic, and nucleolar fractions of transduced NPM1−/−/p53−/−MEF and p53−/−MEF were prepared and immunoblotted with an anti‐Flag, anti‐β‐tubulin, anti‐Lamin B, or anti‐Fibrillarin antibody. C, Np, and No indicate the cytosolic fraction, nucleoplasmic fraction, and nucleolar fraction, respectively. The relative expression levels of NPM‐ALK and its kinase dead mutant K210R are shown in the graphs. Results represent the mean ± SD of three independent experiments. **P < 0.01 significantly different from the control group. (E) NPM1−/−/p53−/−MEF and NPM1−/−/p53−/−MEF expressing NPM‐ALK and NPM1−/−/p53−/−MEF expressing the kinase dead mutant of NPM‐ALK K210R were infected with an empty virus (−) and expressed NPM1 by retroviral infection. Cytosolic, nucleoplasmic, and nucleolar fractions from transduced MEF were prepared and immunoblotted with an anti‐Flag, anti‐NPM1, anti‐β‐tubulin, anti‐Lamin B, or anti‐Fibrillarin antibody. C, Np, and No indicate the cytosolic, nucleoplasmic, and nucleolar fractions, respectively. The relative expression levels of NPM‐ALK and its kinase dead mutant K210R are shown in the graphs. Results represent the mean ± SD of three independent experiments.** indicates P < 0.01.
Fig. 3
Fig. 3
NPM‐ALK interacts with EBP2 in the nucleolus and induces tyrosine phosphorylation. (A) Scheme of the experimental procedure for the identification of nucleolar NPM‐ALK binding partners. (B) Cytosolic, nucleoplasmic, and nucleolar fractions were prepared from control Ba/F3 cells (−), Ba/F3‐NPM‐ALK, and Ba/F3‐K210R. Each fraction was analyzed by immunoblotting with an anti‐Flag, anti‐DDX21, anti‐EBP2, anti‐β‐tubulin, anti‐Lamin B, or anti‐Fibrillarin antibody. The relative expression levels of NPM‐ALK, its kinase dead mutant K210R, EBP2, and DDX21 are shown in the graphs. Results represent the mean ± SD of three independent experiments. ** indicates P < 0.01. (C) Nucleolar fractions were prepared from control Ba/F3 cells (−), Ba/F3‐NPM‐ALK, and Ba/F3‐K210R. Nucleolar fractions were immunoprecipitated with an anti‐Flag antibody and immunoprecipitates were eluted with lysis buffer containing the Flag peptide. Eluted samples and nucleolar lysates were immunoblotted with an anti‐DDX21, anti‐EBP2, or anti‐Flag antibody. (D) Control Ba/F3 cells (−), Ba/F3‐NPM‐ALK, and Ba/F3‐K210R were treated with 0.5 mmpervanadate for 30 min. Cell lysates were prepared and immunoprecipitated with control beads or an anti‐phospho‐tyrosine (pY) antibody. Immunoprecipitates were immunoblotted with an anti‐EBP2, anti‐DDX21, or anti‐phospho‐tyrosine (pY) antibody. The relative phosphorylation levels of EBP2 and DDX21 are shown in the graphs. Results represent the mean ± SD of three independent experiments. **P < 0.01, ***P < 0.001 significantly different from the control group of Ba/F3 cells.
Fig. 4
Fig. 4
Knockdown of EBP2 inhibits 28S rRNA biogenesis in Ba/F3 cells expressing NPM‐ALK. (A) Control Ba/F3 cells (−), Ba/F3‐NPM‐ALK, and Ba/F3‐K210R cells were metabolically labeled with [3H]‐uridine for 4 h. RNA was isolated and analyzed by agarose gel electrophoresis and fluorography (upper). Methylene blue staining was performed (bottom). (B, C) Control Ba/F3 cells (−), Ba/F3‐NPM‐ALK, and Ba/F3‐K210R were transfected with control scrambled siRNA and two kinds of siRNA targeting EBP2 (EBP2 siRNA #1, or EBP2 siRNA #2) and then incubated for 20 h. (B) Whole‐cell lysates were prepared and immunoblotted with an anti‐EBP2 antibody or anti‐β‐actin antibody. The relative expression levels of EBP2 and DDX21 are shown in the graphs. Results represent the mean ± SD of three independent experiments. *P < 0.05, **P < 0.001 significantly different from the control group of Ba/F3 cells transfected with scrambled siRNA.## P < 0.01 significantly different from the group of Ba/F3‐ NPM‐ALK transfected with scrambled siRNA.§§ P < 0.01 significantly different from the group of Ba/F3‐K210R transfected with scrambled siRNA. (C) Cells were metabolically labeled with [3H]‐uridine for 4 h. Total RNA was isolated and analyzed by agarose gel electrophoresis and fluorography (upper). Methylene blue staining was performed (bottom). Quantification data of synthesized 28S rRNA and 18S rRNA were shown in the graph, with values from control Ba/F3 cells transfected with scrambled siRNA being set to 1 (n = 3). **P < 0.01 significantly different from the group of control Ba/F3 cells (−) transfected with scrambled siRNA.## P < 0.01 significantly different from the group of Ba/F3‐NPM‐ALK transfected with scrambled siRNA.
Fig. 5
Fig. 5
Knockdown of EBP2 induces G0/G1‐phase cell cycle arrest through p53 activation in Ba/F3 cells expressing NPM‐ALK. Control Ba/F3 cells (−), Ba/F3‐NPM‐ALK, and Ba/F3‐K210R were transfected with control scrambled siRNA, two kinds of siRNA targeting EBP2 (EBP2 siRNA #1 or EBP2 siRNA #2) and two kinds of siRNA targeting DDX21 (DDX21 siRNA #1 or DDX21 siRNA #2), and were then incubated for 20 h. (A, B) Cells (5 × 104 cells/100 μL) were cultured for 24 h and the proliferation rate was measured using the WST‐1 assay (n = 4). Error bars represent the SD of the mean. **P < 0.01 significantly different from the group of control Ba/F3 cells transfected with scrambled siRNA.## P < 0.01 significantly different from the group of Ba/F3‐NPM‐ALK transfected with scrambled siRNA. (C, D) Cells were fixed, treated with propidium iodide, and subjected to a flow cytometric analysis. The ratios of cells in the S phase, G0/G1phase, and G2/M phase were graphed. Data were expressed as means ± SD (n = 3). **P < 0.01 significantly different from the group of control Ba/F3 cells transfected with scrambled siRNA.## P < 0.01 significantly different from the group of Ba/F3‐NPM‐ALK transfected with scrambled siRNA. (E) Whole‐cell lysates were immunoblotted with an anti‐phospho‐p53 (Ser15), anti‐p53, anti‐p21, anti‐EBP2, or anti‐β‐actin antibody. The relative phosphorylation or expression levels of p53 and p21 are shown in the graphs. Results represent the mean ± SD of three independent experiments.### P < 0.001 significantly different from the control group of Ba/F3‐NPM‐ALK transfected with scrambled siRNA. (F) Total RNA was prepared and the expression ofp21andp53mRNA was analyzed by quantitative real‐time PCR (n = 3).Rpl13amRNA was analyzed as an internal control. Error bars represent the SD of the mean. **P < 0.01 significantly different from the group of control Ba/F3 cells transfected with scrambled siRNA.## P < 0.01 significantly different from the group of Ba/F3‐NPM‐ALK transfected with scrambled siRNA.
Fig. 6
Fig. 6
Knockdown of EBP2 enhances phosphorylation of Akt at S473 in Ba/F3 cells expressing NPM‐ALK. Control Ba/F3 cells (−), Ba/F3‐NPM‐ALK, and Ba/F3‐K210R were transfected with control scrambled siRNA and two kinds of siRNA targeting EBP2 (EBP2 siRNA #1 or EBP2 siRNA #2). Twenty hours after transfection, whole‐cell lysates were prepared and immunoblotted with an anti‐Flag, anti‐phospho‐STAT3 (Tyr705), anti‐STAT3, anti‐phospho‐Akt (Thr308), anti‐phospho‐Akt (Ser473), anti‐Akt, or anti‐β‐actin antibody. The relative phosphorylation levels of STAT3 and Akt are shown in the graphs. Results represent the mean ± SD of three independent experiments. *P < 0.05, ***P < 0.001 significantly different from the control group of Ba/F3 cells transfected with scrambled siRNA.# P < 0.05,## P < 0.01 significantly different from the group of Ba/F3‐NPM‐ALK transfected with scrambled siRNA.
Fig. 7
Fig. 7
Knockdown of EBP2 activates p53 through Akt in Ba/F3 cells expressing NPM‐ALK. Ba/F3‐NPM‐ALK was transfected with control scrambled siRNA and two kinds of siRNA targeting EBP2 (EBP2 siRNA #1 or EBP2 siRNA #2). Fourteen hours after transfection, cells were treated with GDC‐0068 (2.5 and 5 μm) for 6 h. (A) Whole‐cell lysates were immunoblotted with an anti‐phospho‐Akt (Ser473), anti‐Akt, anti‐phospho‐p53 (Ser15), anti‐p53, anti‐p21, anti‐EBP2, or anti‐β‐actin antibody. The relative phosphorylation or expression levels of Akt, p53, p21, and EBP2 are shown in the graphs. Results represent the mean ± SD of three independent experiments. *P < 0.05, **P < 0.01, ***P < 0.001 significantly different from the control group of Ba/F3‐NPM‐ALK transfected with scrambled siRNA.# P < 0.05,## P < 0.01,### P < 0.001 significantly different from the group of Ba/F3‐NPM‐ALK transfected with EBP2 siRNA #1 or EBP2 siRNA #2. (B) Total RNA was prepared and the expression ofp21mRNA was analyzed by quantitative real‐time PCR (n = 3).Rpl13amRNA was analyzed as an internal control. Error bars represent the SD of the mean. *P < 0.05; ***P < 0.001 significantly different from the group of Ba/F3‐NPM‐ALK transfected with scrambled siRNA.# P < 0.05 significantly different from the group of Ba/F3‐NPM‐ALK transfected with EBP2 siRNA #1 or EBP2 siRNA #2.
Fig. 8
Fig. 8
The EBP2 knockdown‐induced p53 activation is inhibited by Rapamycin in Ba/F3 cells expressing NPM‐ALK. Ba/F3‐NPM‐ALK was transfected with control scrambled siRNA and two kinds of siRNA targeting EBP2 (EBP2 siRNA #1 or EBP2 siRNA #2). Fourteen hours after transfection, cells were treated with rapamycin (1.25 and 2.5 nm) for 6 h. (A) Whole‐cell lysates were immunoblotted with an anti‐phospho‐p70 S6 kinase (Thr389), anti‐p70 S6 kinas, anti‐phospho‐Akt (Ser473), anti‐Akt, anti‐phospho‐p53 (Ser15), anti‐p53, anti‐p21, anti‐EBP2, or anti‐β‐actin antibody. The relative phosphorylation or expression levels of p70 S6K, Akt, p53, p21, and EBP2 are shown in the graphs. Results represent the mean ± SD of three independent experiments. **P < 0.01, ***P < 0.001 significantly different from the control group of Ba/F3‐NPM‐ALK transfected with scrambled siRNA.# P < 0.05,## P < 0.01,### P < 0.01 significantly different from the group of Ba/F3‐NPM‐ALK transfected with EBP2 siRNA #1 or EBP2 siRNA #2. (B) Total RNA was prepared and the expression ofp21mRNA was analyzed by quantitative real‐time PCR (n = 3).Rpl13amRNA was analyzed as an internal control. Error bars represent the SD of the mean. **P < 0.01; ***P < 0.001 significantly different from the group of Ba/F3‐NPM‐ALK transfected with scrambled siRNA.## P < 0.01 significantly different from the group of Ba/F3‐NPM‐ALK transfected with EBP2 siRNA #1 or EBP2 siRNA #2.
Fig. 9
Fig. 9
Knockdown of EBP2 activates p53 through the Akt‐mTORC1 pathway in Ba/F3 cells expressing NPM‐ALK. Ba/F3‐NPM‐ALK were transfected with scrambled siRNA and/or two kinds of siRNA targeting EBP2 (EBP2 siRNA #1 or EBP2 siRNA #2) and/or two kinds of siRNA targeting Raptor (Raptor siRNA #1 or Raptor siRNA #2), and then incubated for 20 h. (A) Whole‐cell lysates were immunoblotted with an anti‐Raptor, anti‐phospho‐Akt (Ser473), anti‐Akt, anti‐phospho‐p53 (Ser15), anti‐p53, anti‐p21, anti‐EBP2, or anti‐β‐actin antibody. The relative phosphorylation or expression levels of Raptor, Akt, p53, p21, and EBP2 are shown in the graphs. Results represent the mean ± SD of three independent experiments. **P < 0.01, ***P < 0.001 significantly different from the control group of Ba/F3‐NPM‐ALK transfected with scrambled siRNA.# P < 0.05,## P < 0.01,### P < 0.001 significantly different from the group of Ba/F3‐NPM‐ALK transfected with EBP2 siRNA #1 or EBP2 siRNA #2. (B) Total RNA was prepared and the expression ofp21mRNA was analyzed by quantitative real‐time PCR (n = 3).Rpl13amRNA was analyzed as an internal control. Error bars represent the SD of the mean. *P < 0.05, ***P < 0.001 significantly different from the group of Ba/F3‐NPM‐ALK transfected with scrambled siRNA.# P < 0.05,## P < 0.01 significantly different from the group of Ba/F3‐ NPM‐ALK transfected with EBP2 siRNA #1 or EBP2 siRNA #2.
Fig. 10
Fig. 10
Nucleolar NPM‐ALK interacts with EBP2 and knockdown of EBP2 induced G0/G1‐phase cell cycle arrest in ALCL patient‐derived Ki‐JK cells. (A) Cytoplasmic and nuclear fractions from Ki‐JK cells and SUDH‐L1 cells were prepared and immunoprecipitated with control IgG or an anti‐ALK antibody. These prepared samples were analyzed by immunoblotting with an anti‐EBP2 or anti‐ALK antibody. (B) A nucleolar fraction was prepared from Ki‐JK cells and SUDH‐L1, and immunoprecipitated with control IgG or an anti‐ALK antibody. The nucleolar lysates and immunoprecipitates were immunoblotted with an anti‐EBP2 or anti‐ALK antibody. (C) Ki‐JK cells and SUDH‐L1 cells were transfected with scrambled siRNA and two kinds of siRNA targeting EBP2 (EBP2 siRNA #1 or EBP2 siRNA #2) and then incubated for 24 h. Cells (2.5 × 104 cells/100 μL) were counted and cultured for 48 h. Cell proliferation was measured using the WST‐1 assay (n = 4). Error bars represent the SD of the mean. **P < 0.01 significantly different from the group of Ki‐JK cells transfected with scrambled siRNA. (D) Ki‐JK cells and SUDH‐L1 cells were transfected with scrambled siRNA, EBP2 siRNA #1, or EBP2 siRNA #2, and then incubated for 72 h. Cells were fixed, treated with propidium iodide, and subjected to a flow cytometric analysis. The ratios of cells in the G0/G1phase, S phase, and G2/M phase were graphed. Data were expressed as the mean ± SD (n = 3). **P < 0.01 significantly different from the group of Ki‐JK cells transfected with scrambled siRNA.
Fig. 11
Fig. 11
Knockdown of EBP2 activates p53 in ALCL patient‐derived Ki‐JK cells. Ki‐JK cells and SUDH‐L1 cells were transfected with scrambled siRNA, EBP2 siRNA #1, or EBP2 siRNA #2, and then incubated for 72 h. (A, B) Whole‐cell lysates were immunoblotted with an anti‐phospho‐Akt (Ser473), anti‐Akt, anti‐phospho‐p53 (Ser15), anti‐p53, anti‐p21, anti‐EBP2, or anti‐β‐actin antibody. The relative phosphorylation or expression levels of Akt, p53, p21, and EBP2 are shown in the graphs. Results represent the mean ± SD of three independent experiments. *P < 0.05, ***P < 0.001 significantly different from the control group of Ki‐JK cells or SUDH‐L1 cells transfected with scrambled siRNA. (C) Total RNA was prepared and the expression ofp21mRNA was analyzed by quantitative real‐time PCR (n = 3).Rpl13amRNA was analyzed as an internal control. Error bars represent the SD of the mean. *P < 0.05; **P < 0.01 significantly different from the group of Ki‐JK cells transfected with scrambled siRNA.
Fig. 12
Fig. 12
Knockdown of EBP2 activates p53 through Akt in ALCL patient‐derived Ki‐JK cells. Ki‐JK cells were transfected with scrambled siRNA, EBP2 siRNA #1, or EBP2 siRNA #2. Twenty‐four hours after transfection, cells were treated with GDC‐0068 (2.5 and 5 μm) for 48 h. (A) Whole‐cell lysates were immunoblotted with an anti‐phospho‐Akt (Ser473), anti‐Akt, anti‐phospho‐p53 (Ser15), anti‐p53, anti‐p21, anti‐EBP2, or anti‐β‐actin antibody. The relative phosphorylation or expression levels of Akt, p53, p21 and EBP2 are shown in the graphs. Results represent the mean ± SD of three independent experiments. **P < 0.01, ***P < 0.001 significantly different from the control group of Ki‐JK cells transfected with scrambled siRNA.# P < 0.05,## P < 0.01,### P < 0.001 significantly different from the control group of Ki‐JK cells transfected with EBP2 siRNA #1 or EBP2 siRNA #2. (B) Total RNA was prepared, and the expression ofp21mRNA was analyzed by quantitative real‐time PCR (n = 3).Rpl13amRNA was analyzed as an internal control. Error bars represent the SD of the mean. **P < 0.01, ***P < 0.001 significantly different from the group of Ki‐JK cells transfected with scrambled siRNA.## P < 0.01 significantly different from the group of Ba/F3‐NPM‐ALK transfected with EBP2 siRNA #1 or EBP2 siRNA #2.
Fig. 13
Fig. 13
Knockdown of EBP2 activates p53 through mTORC1 pathway in ALCL patient‐derived Ki‐JK cells. Ki‐JK cells were transfected with scrambled siRNA, EBP2 siRNA #1, or EBP2 siRNA #2. Twenty‐four hours after transfection, cells were treated with rapamycin (1 and 10 nm) for 48 h. (A) Whole‐cell lysates were immunoblotted with an anti‐phospho‐p70 S6 kinase (Thr389), anti‐p70 S6 kinase, anti‐phospho‐p53 (Ser15), anti‐p53, anti‐p21, anti‐EBP2, or anti‐β‐actin antibody. The relative phosphorylation or expression levels of p70 S6 kinase, p53, p21, and EBP2 are shown in the graphs. Results represent the mean ± SD of three independent experiments. **P < 0.01, ***P < 0.001 significantly different from the control group of Ki‐JK cells transfected with scrambled siRNA.# P < 0.05,## P < 0.01,### P < 0.001 significantly different from the control group of Ki‐JK cells transfected with EBP2 siRNA #1 or EBP2 siRNA #2. (B) Total RNA was prepared and the expression ofp21mRNA was analyzed by quantitative real‐time PCR (n = 3).Rpl13amRNA was analyzed as an internal control. Error bars represent the SD of the mean. **P < 0.01 significantly different from the group of Ki‐JK cells transfected with scrambled siRNA.## P < 0.01 significantly different from the group of Ba/F3‐NPM‐ALK transfected with EBP2 siRNA #1 or EBP2 siRNA #2.
Fig. 14
Fig. 14
NPM‐ALK inactivates p53 by negatively regulating the activation of the Akt‐mTORC1 pathway through an interaction with EBP2 in the nucleolus. NPM‐ALK is localized in the cytosol, nucleoplasm, and nucleolus. NPM‐ALK interacts with NPM1 in a manner that is dependent on its kinase activity and is localized in the nucleolus. In the nucleolus, NPM‐ALK interacts with EBP2, which is partially involved in NPM‐ALK‐induced 28S rRNA biogenesis. Furthermore, NPM‐ALK negatively regulates p53 activity through the Akt‐mTORC1 pathway by interacting with EBP2.

References

    1. Palmer RH, Vernersson E, Grabbe C & Hallberg B (2009) Anaplastic lymphoma kinase: signalling in development and disease. Biochem J 420, 345–361. - PMC - PubMed
    1. Mano H (2012) ALKoma: a cancer subtype with a shared target. Cancer Discov 2, 495–502. - PubMed
    1. Hallberg B & Palmer RH (2013) Mechanistic insight into ALK receptor tyrosine kinase in human cancer biology. Nat Rev Cancer 13, 685–700. - PubMed
    1. Medeiros LJ & Elenitoba‐Johnson KSJ (2007) Anaplastic large cell lymphoma. Am J Clin Pathol 127, 707–722. - PubMed
    1. Lawrence B, Perez‐Atayde A, Hibbard MK, Rubin BP, Dal Cin P, Pinkus JL, Pinkus GS, Xiao S, Yi ES, Fletcher CDM et al (2000) TPM3‐ALK and TPM4‐ALK oncogenes in inflammatory myofibroblastic tumors. Am J Pathol 157, 377–384. - PMC - PubMed

Publication types

MeSH terms