. 2021 Mar:181:138-149.
doi: 10.1016/j.matcom.2020.09.029. Epub 2020 Oct 3.

COVID-19 pandemic and chaos theory

Affiliations

COVID-19 pandemic and chaos theory

O Postavaru et al. Math Comput Simul. 2021 Mar.

Abstract

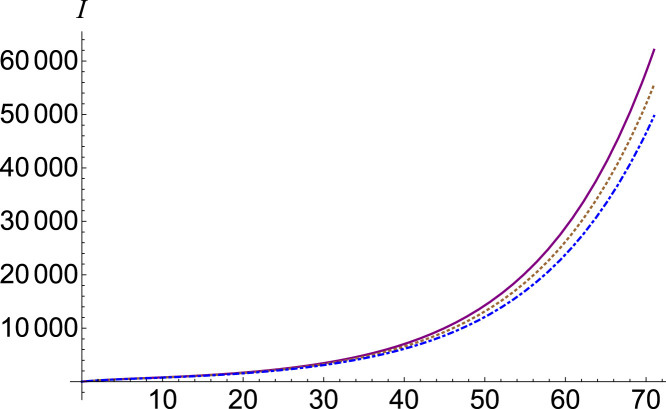
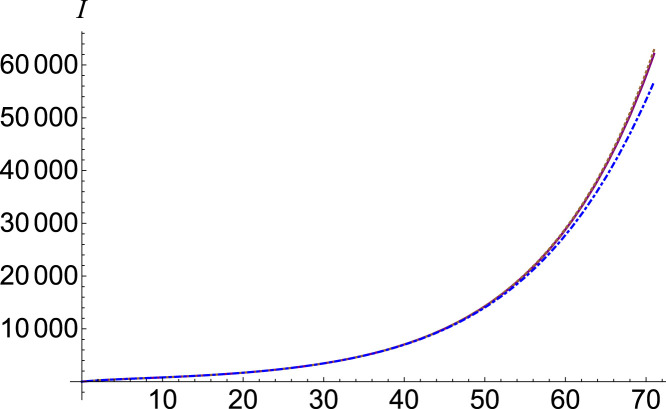
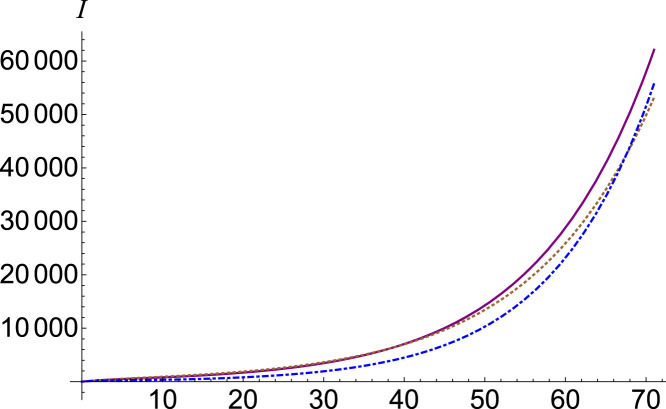
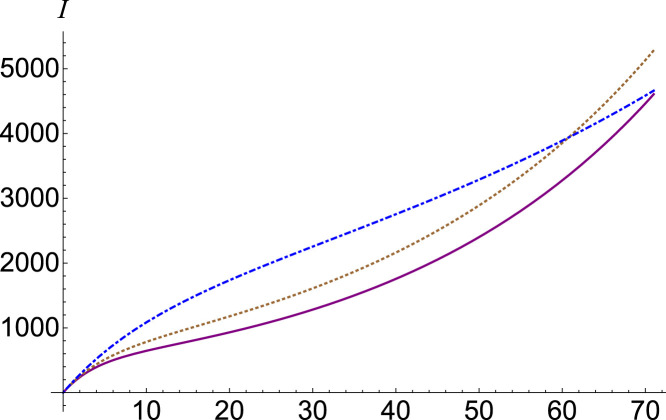
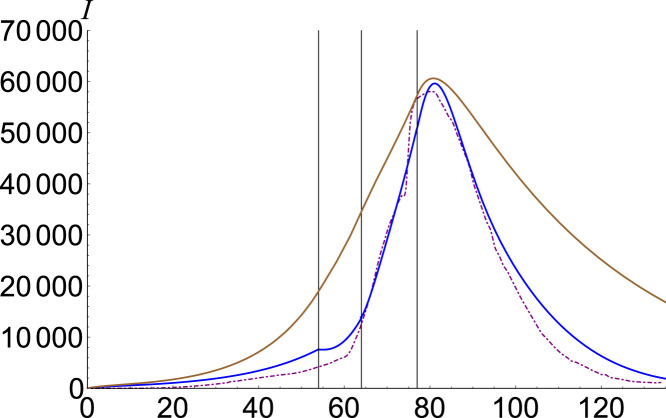
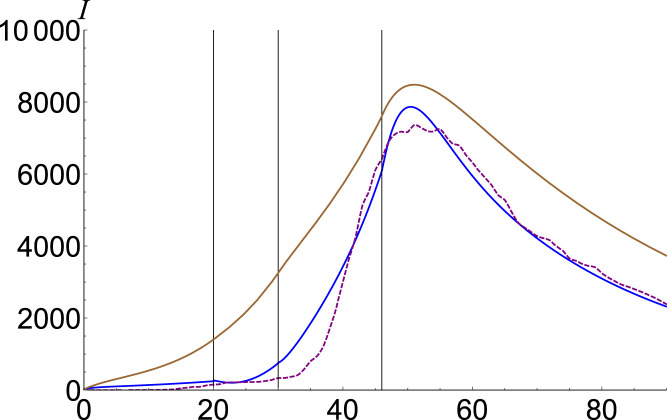
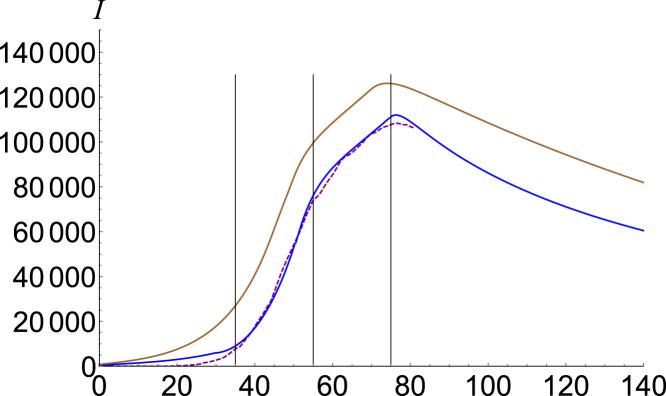
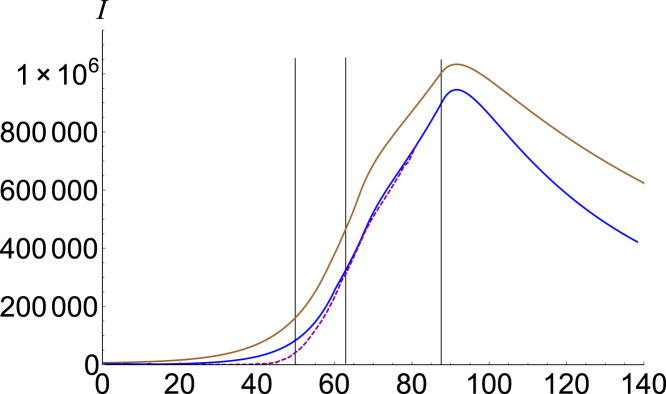
The dynamics of COVID-19 is investigated with regard to complex contributions of the omitted factors. For this purpose, we use a fractional order SEIR model which allows us to calculate the number of infections considering the chaotic contributions into susceptible, exposed, infectious and removed number of individuals. We check our model on Wuhan, China-2019 and South Korea underlying the importance of the chaotic contribution, and then we extend it to Italy and the USA. Results are of great guiding significance to promote evidence-based decisions and policy.

Keywords: Bernoulli polynomials; Block-pulse; Caputo derivative; Epidemic models.


Figures

Fig. 1
Fig. 1
Infected number I, c=λ=1 (purple, continuous), c=λ=0.99 (brown, dotted) and c=λ=0.98 (blue, dot-dashed).
Fig. 2
Fig. 2
Infected number I, a=θ=1 (purple, continuous), a=θ=0.1 (brown, dotted) and a=θ=1.8 (blue, dot-dashed).
Fig. 3
Fig. 3
Infected number I, b=η=1 (purple, continuous), b=η=0.9 (brown, dotted) and b=η=1.3 (blue, dot-dashed).
Fig. 4
Fig. 4
Infected number I, b=η=1 (purple, continuous), b=η=0.9 (brown, dotted) and b=η=0.5 (blue, dot-dashed), for R0=1.8.
Fig. 5
Fig. 5
Infected number I for China. Data is plotted with purple, SEIR solution with brown, and the fractional model c1=λ1=0.9, c2=λ2=1.3, c3=λ3=1.35, c4=λ4=1.15 and b4=η4=1.3 with blue.(For interpretation of the references to color in this figure legend, the reader is referred to the web version of this article.)
Fig. 6
Fig. 6
Infected number I for South Korea. Data is plotted with purple, SEIR solution with brown, and the fractional model c1=λ1=0.7, c2=λ2=1.2, c3=λ3=1.35, c4=λ4=1.05 and b4=η4=1.2 with blue.(For interpretation of the references to color in this figure legend, the reader is referred to the web version of this article.)
Fig. 7
Fig. 7
Infected number I for Italy. Data is plotted with purple, SEIR solution with brown, and the fractional model c1=λ1=0.9, c2=λ2=1.25, c3=λ3=1.3, c4=λ4=1.1 and b4=η4=1.25 with blue.(For interpretation of the references to color in this figure legend, the reader is referred to the web version of this article.)
Fig. 8
Fig. 8
Infected number I for USA. Data is plotted with purple, SEIR solution with brown, and the fractional model c1=λ1=0.9, c2=λ2=1.15, c3=λ3=1.2, c4=λ4=1 and b4=η4=1.15 with blue.(For interpretation of the references to color in this figure legend, the reader is referred to the web version of this article.)

References

    1. Chen S., Chang C., Liao C. Predictive models of control strategies involved in containing indoor airborne infections. Indoor Air. 2006;16(6):469–481. - PubMed
    1. Chen N., Zhou M., Dong X., Qu J., Gong F., Han Y., Qiu Y., Wang J., Liu Y., Wei Y. Epidemiological and clinical characteristics of 99 cases of 2019 novel coronavirus pneumonia in Wuhan, China: a descriptive study. Lancet. 2020;395(10223):507–513. - PMC - PubMed
    1. Chowell G., Hengartner N.W., Castillo-Chavez C., Fenimore P.W., Hyman J.M. The basic reproductive number of Ebola and the effects of public health measures: the cases of Congo and Uganda. J. Theoret. Biol. 2004;229(1):119–126. - PubMed
    1. Chowell G., Nishiura H., Bettencourt L.M. Comparative estimation of the reproduction number for pandemic influenza from daily case notification data. J. R. Soc. Interface. 2007;4(12):155–166. - PMC - PubMed
    1. Fang H., Chen J., Hu J. 2005 IEEE Engineering in Medicine and Biology 27th Annual Conference. IEEE; 2006. Modelling the SARS epidemic by a lattice-based Monte-Carlo simulation; pp. 7470–7473. - PubMed

LinkOut - more resources