

doi: 10.1080/0889311x.2019.1692341.
Epub 2019 Dec 10.
Characterizing pathological imperfections in macromolecular crystals: lattice disorders and modulations
Affiliations
- PMID: 33041501
- PMCID: PMC7546027
- DOI: 10.1080/0889311x.2019.1692341
Item in Clipboard
Characterizing pathological imperfections in macromolecular crystals: lattice disorders and modulations
Crystallogr Rev.
2020.
No abstract available
Figures

Sketch of the reflections observed for imidazole bound methemoglobin crystals [16]. Reproduced with permission of the International Union of Crystallography.

Schematic of the unit cell packing for the normal crystals (a) and the crystals with LTD defect (b) showing two possible positions of the lattice translocation [16]. Reproduced with permission of the International Union of Crystallography.
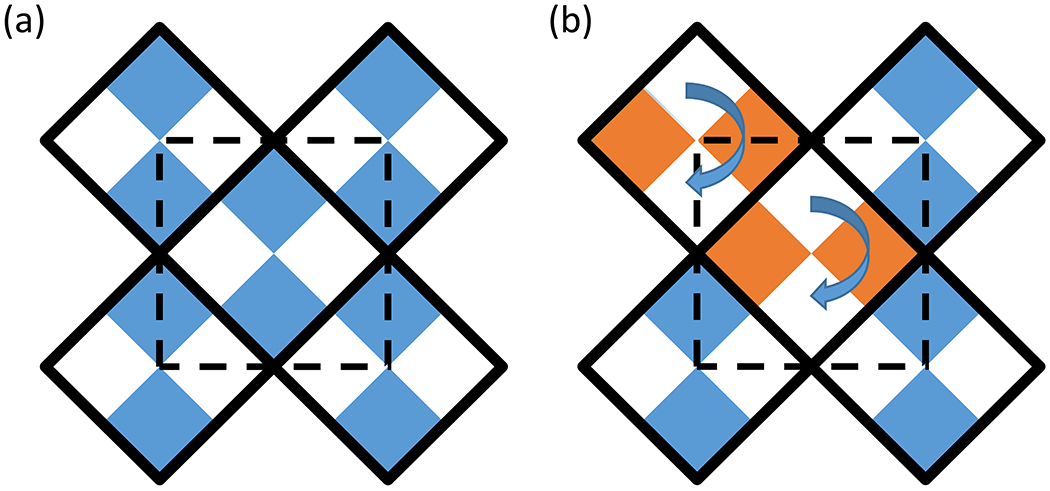
ROD schematic where the solid square lines with four colored squares inside of them represent a heterotetramer made of two different monomers and the dashed line represents the unit cell of the crystal. (a) the ideal crystal lattice (b) rotational order–disorder incorporation into the lattice.

ROD diffraction pattern of rsTagRFP [46]. Reproduced with permission of the International Union of Crystallography.

L test plot showing lines for a twin distribution and nontwin and the actual data [46]. Reproduced with permission of the International Union of Crystallography.

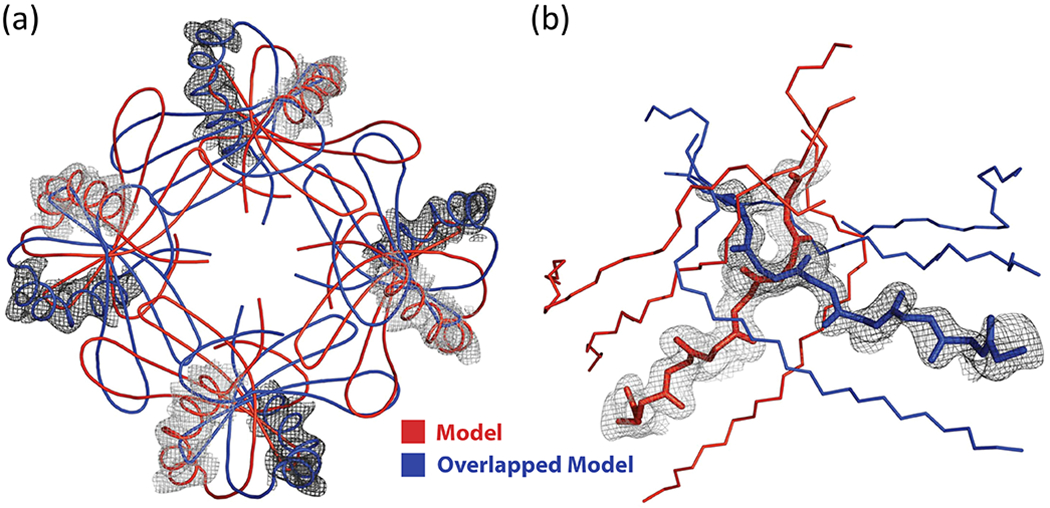
rsTagRFP model showing all of the symmetry-related chains colored by tetramer [46] from the side (a) and the top (b). Reproduced with permission of the International Union of Crystallography.

Refinement Results (a) omit map (green) with overlapping models inserted and (b) models with the overlapping density coloured by model [46]. Reproduced with permission of the International Union of Crystallography.

Stefin B diffraction pattern [47]. Reproduced with permission of the International Union of Crystallography.

Cumulative intensity test plot for the Stefin B reflections. The solid line represents the case for twinned data. The “x” line nontwinned and the dots the reflection data that was observed for stefin B [47]. Reproduced with permission of the International Union of Crystallography.

Stefin B model showing ROD layer every 5th tetramer in the stack [47]. Reproduced with permission of the International Union of Crystallography.
Stefin B OMIT electron density maps around the overlapped regions with models overlaid [47]. Reproduced with permission of the International Union of Crystallography.

Example of an LTD defect. The layers assemble left to right reliably. In the top to bottom stacking of the layers, it is possible for random layers to be shifted to the left or right occupying one of two possible positions (denoted by different colors).
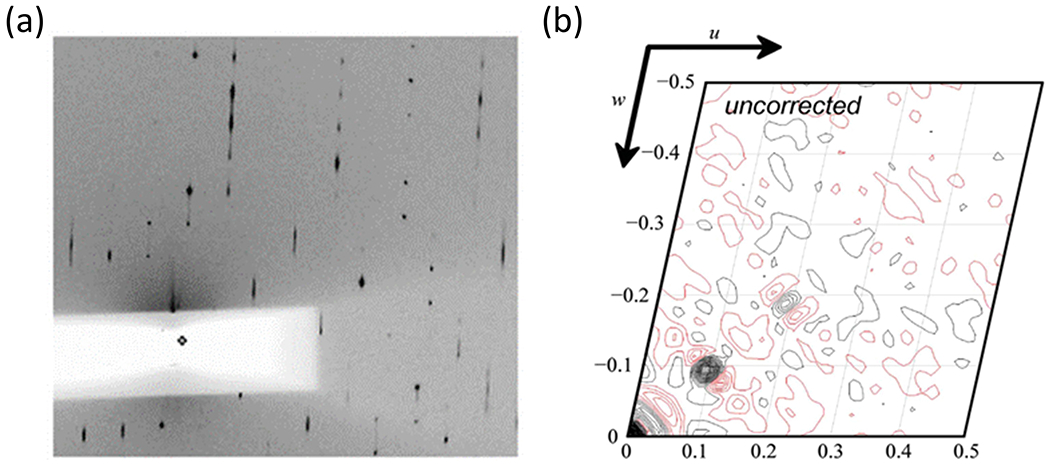
LTD example showing (a) diffraction pattern with sharp and streaky reflections and (b) Patterson map with strong off origin peaks at a spacing that cannot be tNCS [44]. Reproduced with permission of the International Union of Crystallography.

LEDGF Patterson map as Function of k fraction (a) Native (a) k=0.17 (c) k=0.35 (d) LTD Patterson Peak vs Ghost LTD Patterson Peak due to the correction as a function of k fraction [44]. Reproduced with permission of the International Union of Crystallography.

LEDGF complex diffraction from two Samples. (a) Minor LTD that was not visible in the diffraction pattern (b) More severe LTD that was easily seen in the diffraction pattern (c) layer averaged intensity for reflections that satisfy the h-1 condition (for example, all the intensity of all of the reflections where h-1 = −10 was about ~4300 for one crystal and 1800 for the other crystal) [44]. Reproduced with permission of the International Union of Crystallography.

LTD Intensity Correction as a function of k for two samples (a) Visible LTD in the diffraction pattern (Figure 15(b) and (b) no LTD in the diffraction pattern (Fig. 15(a)) [44]. Reproduced with permission of the International Union of Crystallography.

CRMP-4 diffraction pattern showing streaky diffuse reflections interspersed with strong sharp reflections [88]. Reproduced with permission of the International Union of Crystallography.

CRMP-4 original intensities versus corrected intensities using different LTD correction approaches [88]. Reproduced with permission of the International Union of Crystallography.

CRMP-4 electron density (a) uncorrected showing LTD ghost density (dashed lines showing the translation to ghost helices) and then LTD corrected (reduced density for the ghost helices) with (b) cosine function, (c) Wang’s Patterson flattening, and (d) DIGS [88]. Reproduced with permission of the International Union of Crystallography.

Hyp-1-ANS mean reflection intensity versus index l [56]. Reproduced with permission of the International Union of Crystallography.

Patterson Map Section [37] with u=0 [56]. Reproduced with permission of the International Union of Crystallography.

28 Molecules in the Hyp-1-ANS asymmetric unit cell [56]. Reproduced with permission of the International Union of Crystallography.

FBPase Schematic showing the active (a) and inactive AMP bound form (b) [89]. Reproduced with permission of the International Union of Crystallography.

Patterson Map of FBPase [89]. Peaks coordinates are (u,v,w) where the u dimension is coming out of the page for positive u. Reproduced with permission of the International Union of Crystallography.

Reflection statistics for twin analysis. (a) Cumulative intensity distribution of acentric reflection where black dashed line is for the twinned case and the other dashed line is for the untwinned case and the solid line represents the actual data. (b) L-test where the black dashed line is for the twinned case, the dashed line is for the untwinned case and the x’s represent the data. Both approaches indicate that the data are untwinned [89]. Reproduced with permission of the International Union of Crystallography.

Possible molecular replacement solutions for FBPase with AMP bound showing how all of the solutions are related to each other through (a) P41212 and (b) alt P41212, with alt P41212 in grey overlaid on the (c) P43212, (d) P4122 and (e) P4322 solutions [89]. Reproduced with permission of the International Union of Crystallography.

Example of how a one dimensional displacement modulation can be applied to (a) periodic unit cells to produce a (b) commensurate modulation or a (c) incommensurate modulation [49] . Reproduced with permission of the International Union of Crystallography.

Incommensurate diffraction pattern schematic showing how a modulated diffraction pattern can be indexed using higher dimensions, in this case four (h, k , l, m). Depending on the age of an incommensurate publication it may represent the information as shown in the historical convention or the new convention.

Superspace diagram showing how higher dimensional space can return periodicity to real space displacements that appear to be random in 3D space (R) [71]. The atomic modulation function (AMF) in the as4 direction translates along the as1 direction (related to the q-vector) to produce atomic positions (black dots) in real space where the AMF intersects real space. The AMF is periodic and because of equivalent positions, the entirety of the displacement throughout all of 3D space can be captured in 4D space by looking at only one period of the AMF as shown in the zoomed-in region. Reproduced with permission of the International Union of Crystallography.

Incommensurately modulated diffraction pattern from a profilin:actin crystal shown with mains in highlighted by circles and satellites on either side of the mains (not circled) for most of the reflections.

Profilin:Actin complex. (a) Cartoon representation of PA with profilin labelled P and actin labelled with its subdomains A1 –A4. (b) Unpublished profilin:actin average structure refinement with the orientation shown the same as in part a showing poor density (2Fo-Fc at 2.0 sigma) for the model in regions A2 and A4 of actin.

Center of mass displacements for Profilin and Actin in superspace.

Hyp-1-ANS reflection intensity plot as a function of l index [55]. Reproduced with permission of the International Union of Crystallography

Superspace indexing for two of the main reflections. The first one shows the main (L=3 where in the supercell it was L=21) and lower order satellites highlighted with green circles. The width of the circle is related to the order of the reflection (thickest main to thinnest 3rd order satellite). The second (L=2) is shown in red. Reflections with black circles represent satellites or mains that do not belong to either L=2 or L=3 main reflections (Adapted from [55]). Reproduced with permission of the International Union of Crystallography.

Required reordering of cells to view the atomic displacements in superspace for a 3/7 commensurate modulation (Adapted from [55]). Reproduced with permission of the International Union of Crystallography.

Hyp-1-ANS center of mass displacements in superspace showing three periods of the modulation functions and the associated archetype functions to the right.

NAL indexed incommensurately modulated diffraction image created with Precession in EVAL15 (Main reflections and satellites are highlighted with circles) [54].
References
-
- Helliwell JR. Macromolecular crystal twinning, lattice disorders and multiple crystals. Crystallogr Rev. 2008;14(3):189–250.
-
- Parsons S Introduction to twinning. Acta Cryst. 2003;D59:1995–2003. - PubMed
-
- Yeates TO. Detecting and overcoming crystal twinning. Methods Enzymol. 1997;276:344–358. - PubMed
-
- Yeates TO, Fam BC. Protein crystals and their evil twins. Structure. 1999;7(2):R25–9. - PubMed
Grants and funding
LinkOut - more resources
Full Text Sources