. 2020 Sep 16:11:552211.
doi: 10.3389/fphar.2020.552211. eCollection 2020.

Bis-Quinolinium Cyclophane Blockers of SK Potassium Channels Are Antagonists of M3 Muscarinic Acetylcholine Receptors

Affiliations

Bis-Quinolinium Cyclophane Blockers of SK Potassium Channels Are Antagonists of M3 Muscarinic Acetylcholine Receptors

Vladislav Bugay et al. Front Pharmacol. .

Abstract

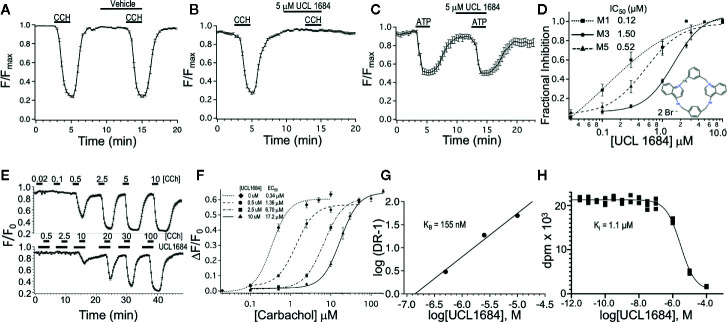
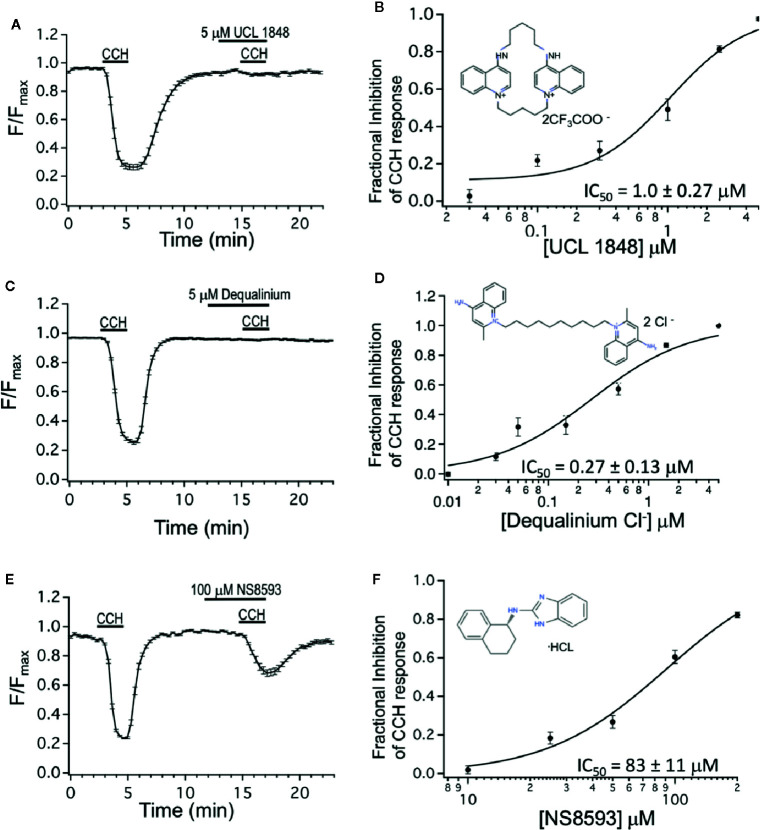
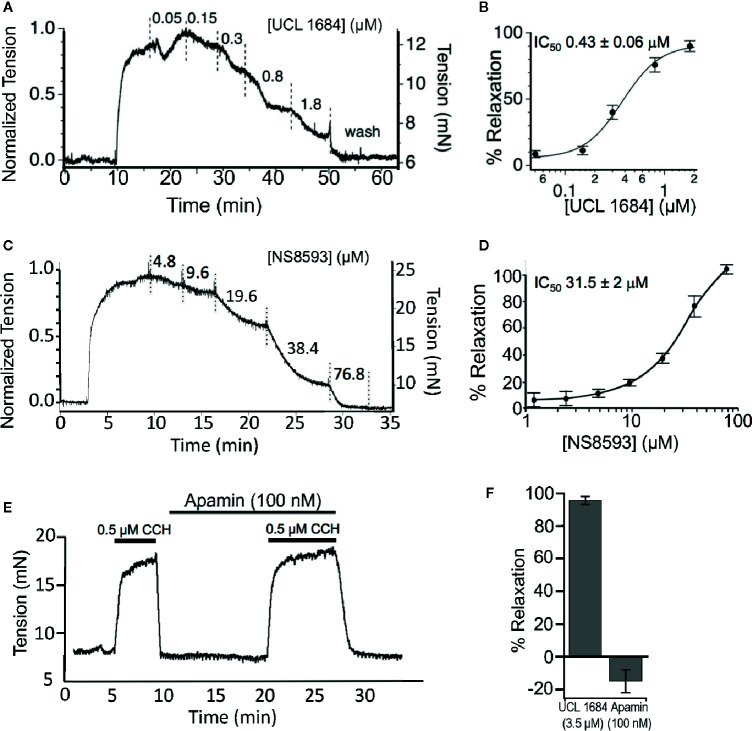
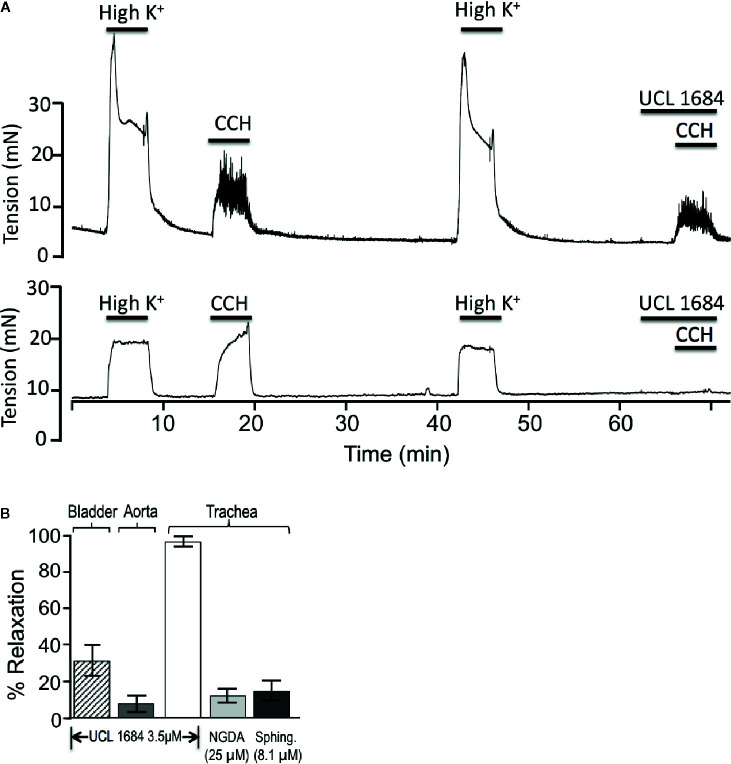
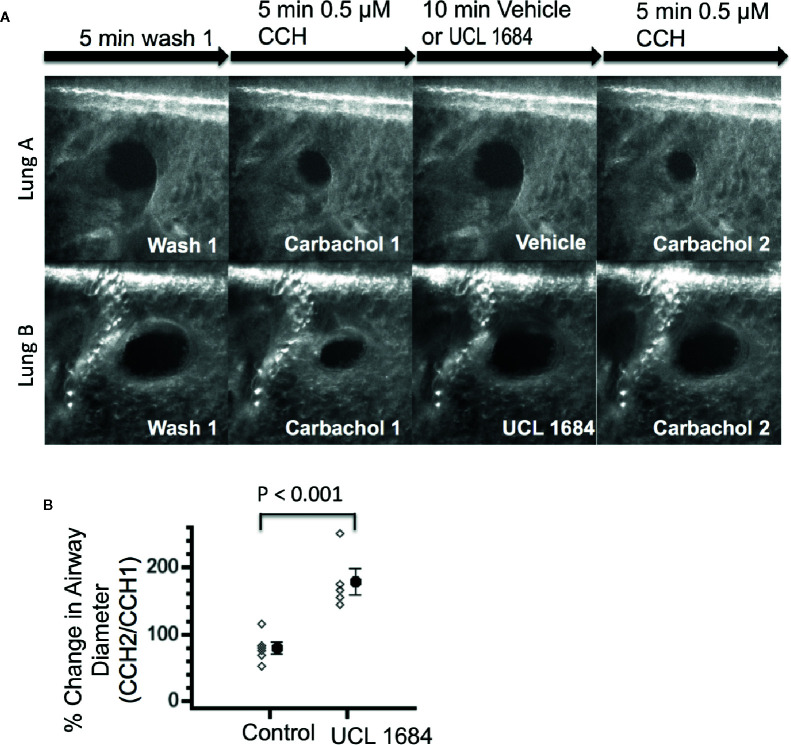
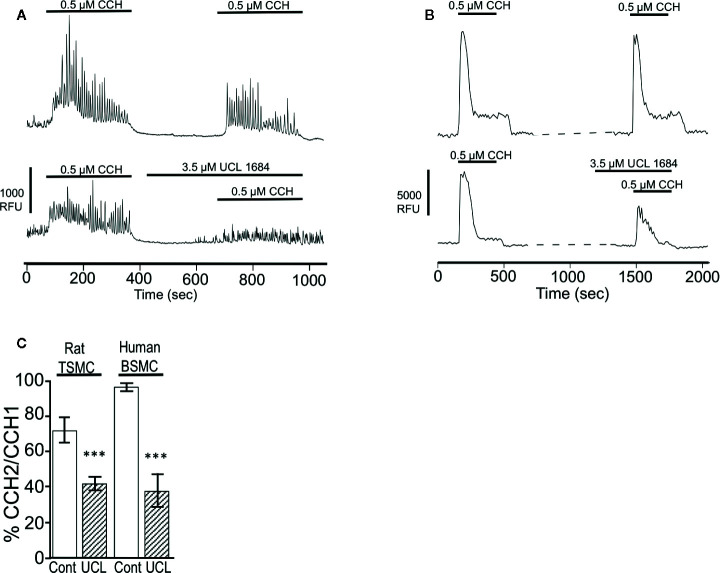
Dequalinium is used as an antimicrobial compound for oral health and other microbial infections. Derivatives of dequalinium, the bis-quinolinium cyclophanes UCL 1684 and UCL 1848, are high affinity SK potassium channel antagonists. Here we investigated these compounds as M3 muscarinic receptor (mACHR) antagonists. We used the R-CEPIAer endoplasmic reticulum calcium reporter to functionally assay for Gq-coupled receptor signaling, and investigated the bis-quinolinium cyclophanes as antagonists of M3 mACHR activation in transfected CHO cells. Given mACHR roles in airway smooth muscle (ASM) contractility, we also tested the ability of UCL 1684 to relax ASM. We find that these compounds antagonized M3 mACHRs with an IC50 of 0.27 μM for dequalinium chloride, 1.5 μM for UCL 1684 and 1.0 μM for UCL 1848. UCL 1684 also antagonized M1 (IC50 0.12 μM) and M5 (IC50 0.52 μM) mACHR responses. UCL 1684 was determined to be a competitive antagonist at M3 receptors as it increased the EC50 for carbachol without a reduction in the maximum response. The Ki for UCL1684 determined from competition binding experiments was 909 nM. UCL 1684 reduced carbachol-evoked ASM contractions (>90%, IC50 0.43 μM), and calcium mobilization in rodent and human lung ASM cells. We conclude that dequalinium and bis-quinolinium cyclophanes antagonized M3 mACHR activation at sub- to low micromolar concentrations, with UCL 1684 acting as an ASM relaxant. Caution should be taken when using these compounds to block SK potassium channels, as inhibition of mACHRs may be a side-effect if excessive concentrations are used.

Keywords: SK channel; UCL 1684; airway smooth muscle; contraction; dequalinium; muscarinic receptor.


Figures

Figure 1
Figure 1
UCL 1684 is an antagonists for muscarinic acetylcholine receptors, but not purinergic receptors. (A) R-CEPIAer response to repeated 0.5 μM carbachol administration before and after vehicle (0.1% DMSO). R-CEPIAer fluorescence is normalized to maximal fluorescence (F/Fmax). Data is plotted for mean ± standard error of the mean. Fractional inhibition of second CCH response with vehicle was 0.0004 ± 0.018 of first response for N = 30 cells. (B) Same as in A except that 5 μM of UCL 1684 was applied preceding and during the second 0.5 μM carbachol administration. Fractional inhibition by UCL 1684 was 0.99 ± 0.011 for N = 30 cells. (C) R-CEPIAer response to repeated 1 μM ATP administration to CHO cells co-transfected with the human P2Y1 purinergic receptor. The second ATP administration included 5 μM UCL 1684. Fractional inhibition by UCL 1684 was 0.067 ± 0.06 for N = 20 cells. (D) R-CEPIAer dose-response to 0.5 μM CCH with increasing doses of UCL 1684. Data is plotted as mean fractional inhibition of 0.5 μM CCH response as a function of UCL 1684 concentrations. Inset is the molecular structure of UCL 1684 (from (Campos Rosa et al., 1996). Fitting of the inhibition curves to a Hill equation indicated IC50 and slope values of the following: M1 receptor 0.12 ± 0.18 μM, slope 0.67 ± 0.5, N=55–61; M3 receptor 1.5 ± 0.14 μM, slope 1.8 ± 0.29, N=28–30; M5 receptor 0.52 ± 0.05 μM, slope 1.4 ± 0.17, N=58. (E) R-CEPIAer response in M3 mACHR expressing cells to increasing carbachol administration in the absence (above) and presence (below) of 10 μM UCL 1684. Data is plotted as mean ± s.e.m. for N =19 for control, and N=21 for 10 μM UCL 1684. (F) ΔF/F0 R-CEPIAer response M3 mACHR expressing cells as in (E), were plotted for increasing carbachol concentrations alone (diamond, EC50 0.34 ± 0.06, slope 2.0 ± 0.65, N=19), or carbachol with UCL1684: 0.5 μM (circle, EC50 1.36 ± 0.26, slope 1.9 ± 0.45, N=20), 2.5 μM (square, EC50 6.70 ± 0.47, slope 1.8 ± 0.18, N=20) and 10 μM (triangle, EC50 17.2 ± 0.90, slope 1.9 ± 0.20, N=21). (G) Schild analysis of M3 receptor inhibition by UCL1684. EC50 values from F were used to plot log of Dose Ratio -1, (DR, carbachol EC50 value in the presence/EC50 absence of UCL1684) as a function of log of UCL1684 concentration. Linear regression fitting yielded a slope of 0.94, y-intercept of 6.4, and a theoretical X-intercept yielding a pKi of 6.8 (K i of 155 nM). (H) A representative binding experiment using M3 mACHR-expressing CHO cell membranes (25 ug) incubated with 0.9 nM [3H]-NMS and indicated concentrations of UCL1684 (as described in Methods). The experiment shown indicated a pKi of 5.95 (Ki 1.1 μM). The average pKi was 6.04 ± 0.04 (909 nM, Mean ± SEM, n=3 separate experiments).
Figure 2
Figure 2
Dequalinium compounds are M3 muscarinic receptor blockers. (A) R-CEPIAer response to repeated 0.5 μM carbachol administration with 5 μM of UCL 1848 that was applied 3 min preceding and during the second 0.5 μM carbachol administration. Fractional inhibition to UCL 1848 was 0.98 ± 0.01 for N = 32 cells. (B) Mean fractional inhibition of 0.5 μM CCH response as a function of UCL 1848 concentration (N = 20–32 cells per dose). Inset is the molecular structure of UCL 1848 (Chen, Galanakis et al., 2000). Fitting of data to a Hill equation revealed an IC50 of 1.0 ± 0.27 μM, slope 1.47 ± 0.46. (C) R-CEPIAer response to repeated 0.5 μM carbachol administration with 5 μM of dequalinium chloride that was applied 3 min preceding and during the second 0.5 μM carbachol administration. Fractional inhibition to dequalinium was 0.99 ± 0.003 for N = 42 cells. (D) Mean fractional inhibition of 0.5 μM CCH in response as a function of dequalinium chloride concentration (n=15–42 cells per dose). Inset is the molecular structure of dequalinium chloride (Chen et al., 2000). Fitting of data to a Hill equation revealed an IC50 of 0.27 ± 0.13 μM, slope 0.90 ± 0.29. (E) R-CEPIAer response to repeated 0.5 μM carbachol administration with 100 μM of NS8593 applied 3 min preceding and during the second 0.5 μM CCH administration. Fractional inhibition to NS8593 was 0.60 ± 0.03 for N = 30 cells. (F) Mean fractional inhibition of 0.5 μM CCH response as a function of NS8593 concentration (N=30–34 cells per dose). Inset is the molecular structure of NS8593 (Sorensen et al., 2008). Fitting of data to a Hill equation revealed an IC50 of 83 ± 11 μM, slope 1.7 ± 0.35. All dose-response experiments were conducted with 0.5 μM carbachol concentration.
Figure 3
Figure 3
UCL 1684 relaxes cholinergic evoked airway smooth muscle contractions. (A) Example isometric tension measurement of mouse trachea. The trachea was precontracted with 0.5 μM carbachol and cumulative increasing concentrations of UCL 1684 was applied to the bath at approximately 5-min intervals (or until tensions approached steady state levels). (B) Average response from N = 5 tracheas. The IC50 was estimated to be 0.43 ± 0.06 μM, slope 1.7 ± 0.32 using a Hill function to the average response. (C) An example cumulative dose-relaxation response to increasing concentrations of NS8593. (D) Average response from N = 4–8 tracheas (depending on dose). The IC50 was estimated to be 31.5 ± 2.0 μM, slope 1.3 ± 0.22 using a Hill function to the average response. (E) Example contraction in response to 0.5 μM carbachol, without and with wash-in of 100 nM of Apamin. (F) Summary comparisons of relaxation to 0.5 μM carbachol using single doses of 3.5 μM UCL 1684 (95.4 ± 2.4, N=6), and 100 nM Apamin (−15 ± 7, N=4).
Figure 4
Figure 4
UCL 1684 potently relaxes airway smooth muscle, but has weak effects on bladder and vascular muscle. (A) Sample tracings of bladder (above) and trachea (below) response to 3.5 μM UCL 1684. Shown are repetitive contractile responses to high potassium stimulation (67 mM K+ PSS solution) and 0.5 μM carbachol. The second carbachol response was preceded by addition of UCL 1684, which had moderate effects on bladder, but completely prevented trachea contraction response. (B) Summary 3.5 μM UCL 1684 relaxation response (as above) of bladder (diagonal hatch, 31.4 ± 8.4, N=6), aorta precontracted to 300 nM phenylephrine (7.8 ± 4.3, N=3), and trachea (white, 95.4 ± 2.4, N=6). Trachea was also tested for relaxation response to TrpM channel blockers nordihydroguaiaretic acid (NGDA, light gray, 12.4 ± 8.5, N=8), and d-erthyro-sphingosine (Sphing., dark gray, 14.9 ± 6.0, N=8).
Figure 5
Figure 5
UCL 1684 causes relaxation of mouse lung lower airways. (A) Example of reproducible bronchoconstriction in response to repeated exposure of 0.5 μM carbachol (top row). Identical experiments with additional superfusion of 3.5 μM UCL 1684 preceding second carbachol challenge (bottom row) indicates that UCL 1684 prevents bronchoconstriction. (B) Summary data of bronchial diameter during second carbachol challenge normalized to first challenge (in percentage) was 79.0 ± 8.5, N=6 for control, and 178.3 ± 19.0, N=5 for UCL 1684 treated. P < 0.001 in Student’s t-test.
Figure 6
Figure 6
UCL 1684 causes a reduction of cholinergic-evoked calcium release. (A) Representative cytoplasmic calcium response of acutely isolated rat tracheal smooth muscle cells to repetitive 0.5 μM carbachol application without (upper panel) and with 3.5 μM UCL 1684 preceding second carbachol challenge (bottom panel). (B) Representative cytoplasmic calcium response of human bronchial smooth muscle cells to repetitive 0.5 μM carbachol application without (upper panel) and with 3.5 μM UCL 1684 preceding second carbachol challenge (bottom panel). (C) Summary data from A and B. Data is the average percent change of calcium response (integral) to repeated carbachol treatment without (white column) and with UCL 1684 (hashed column) preceding the second challenge. Measurements were from tracheal smooth muscle cells (TSMC, as in A) and human bronchial smooth muscle cells (BSMC, as in B). Rat TSMC control was 0.72 ± 0.07, N=27, UCL 1684 treated was 0.42 ± 0.04, N=40, P < 0.001. Human BSMC control was 0.97 ± 0.03, N=25, UCL 1684 treated was 0.38 ± 0.10, N=16, P < 0.0001. Comparisons were analyzed using a paired Student’s t-test.

Similar articles

Cited by

References

    1. Ariel A., Altraja A., Belevskiy A., Boros P. W., Danila E., Flezar M., et al. (2018). Inhaled therapies in patients with moderate COPD in clinical practice: current thinking. Int. J. Chron. Obstruct. Pulmon. Dis. 13, 45–56. 10.2147/COPD.S145573 - DOI - PMC - PubMed
    1. Arunlakshana O., Schild H. O. (1959). Some quantitative uses of drug antagonists. Br. J. Pharmacol. Chemother. 14 (1), 48–58. 10.1111/j.1476-5381.1959.tb00928.x - DOI - PMC - PubMed
    1. Babbs M., Collier H. O., Austin W. C., Potter M. D., Taylor E. P. (1956). Salts of decamethylene-bis-4-aminoquinaldinium (dequadin); a new antimicrobial agent. J. Pharm. Pharmacol. 8 (2), 110–119. 10.1111/j.2042-7158.1956.tb12138.x - DOI - PubMed
    1. Bae Y., Jung M. K., Song S. J., Green E. S., Lee S., Park H. S., et al. (2017). Functional nanosome for enhanced mitochondria-targeted gene delivery and expression. Mitochondrion 37, 27–40. 10.1016/j.mito.2017.06.005 - DOI - PubMed
    1. Benton D. C., Garbarg M., Moss G. W. (2013). The relationship between functional inhibition and binding for K(Ca)2 channel blockers. PLoS One 8 (9), e73328. 10.1371/journal.pone.0073328 - DOI - PMC - PubMed