. 2020 Sep 15:11:557796.
doi: 10.3389/fphys.2020.557796. eCollection 2020.

Using Electrical Impedance Myography as a Biomarker of Muscle Deconditioning in Rats Exposed to Micro- and Partial-Gravity Analogs

Affiliations

Using Electrical Impedance Myography as a Biomarker of Muscle Deconditioning in Rats Exposed to Micro- and Partial-Gravity Analogs

Carson Semple et al. Front Physiol. .

Abstract

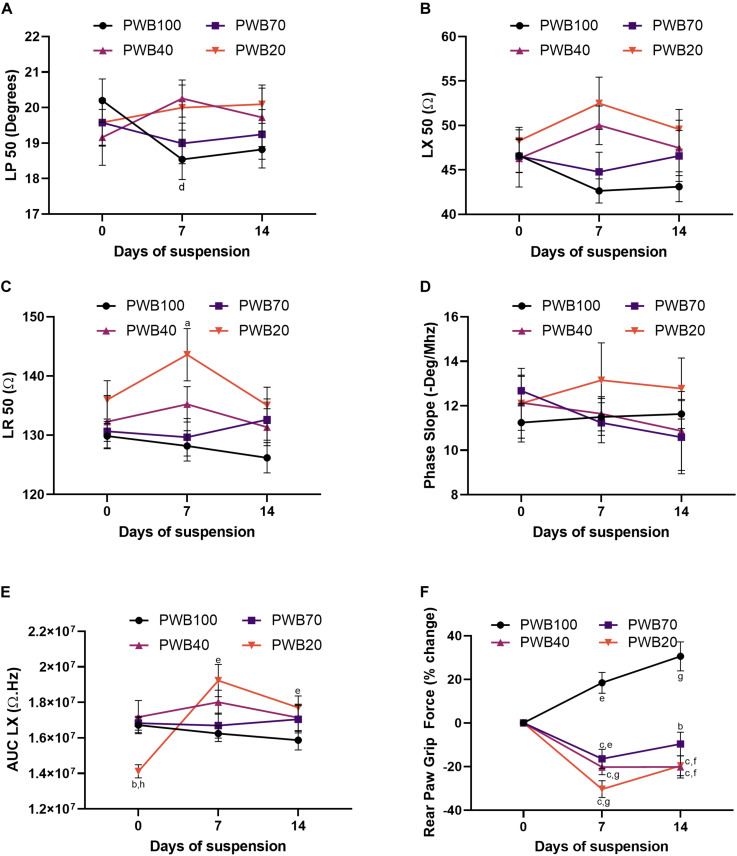
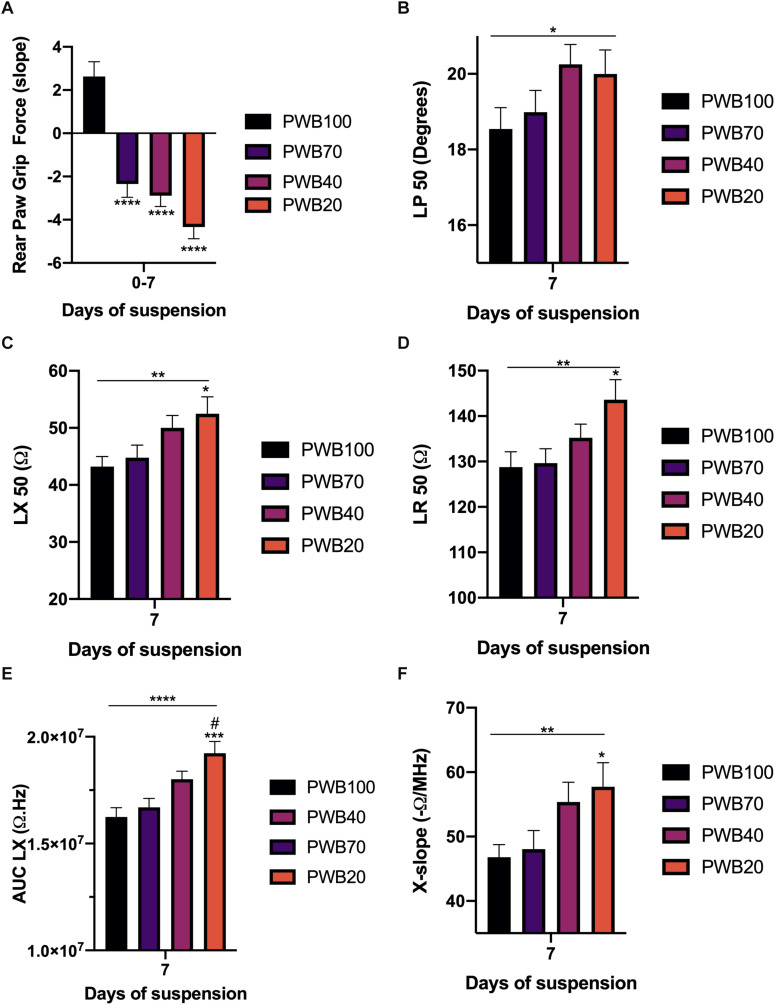
As astronauts prepare to undertake new extra-terrestrial missions, innovative diagnostic tools are needed to better assess muscle deconditioning during periods of weightlessness and partial gravity. Electrical impedance myography (EIM) has been used to detect muscle deconditioning in rodents exposed to microgravity during spaceflight or using the standard ground-based model of hindlimb unloading via tail suspension (HU). Here, we used EIM to assess muscle changes in animals exposed to two new models: hindlimb suspension using a pelvic harness (HLS) and a partial weight-bearing (PWB) model that mimics partial gravity (including Lunar and Martian gravities). We also used a simple needle array electrode in lieu of surface or ex vivo EIM approaches previously employed. Our HLS results confirmed earlier findings obtained after spaceflight and tail suspension. Indeed, one EIM measure (i.e., phase-slope) that was previously reported as highly sensitive, was significantly decreased after HLS (day 0: 14.60 ± 0.97, day 7: 11.03 ± 0.81, and day 14: 10.13 ± 0.55 | Deg/MHz|, p < 0.0001), and was associated with a significant decrease in muscle grip force. Although EIM parameters such as 50 kHz phase, reactance, and resistance remained variable over 14 days in PWB animals, we identified major PWB-dependent effects at 7 days. Moreover, the data at both 7 and 14 days correlated to previously observed changes in rear paw grip force using the same PWB model. In conclusion, our data suggest that EIM has the potential to serve as biomarker of muscle deconditioning during exposure to both micro- and partial- gravity during future human space exploration.

Keywords: EIM; ground-based; hindlimb unloading; impedance; muscle; partial weight-bearing; rats; spaceflight.


Figures

FIGURE 1
FIGURE 1
HLS induces a decrease in muscle force and alters EIM values and parameters. Evolution of EIM values at 50 kHz during 14 days of exposure to HLS including longitudinal phase (LP, A), longitudinal reactance (LX, B), and longitudinal resistance (LR, C). Calculated parameters based on multifrequency analysis including phase-slope (P-slope, D) and area under curve of the reactance (LX AUC, E). Change in rear paw grip force (RPGF) during 14 days of exposure to HLS (F). All results are displayed as mean ± SEM with n = 28. Data were analyzed using a 1-way repeated measures ANOVA and followed by Tukey’s post hoc tests. Results of Tukey’s tests are displayed on the graph as **, ***, ****p < 0.01, p < 0.001, p < 0.0001 vs. day 0, respectively and as ##p < 0.01 vs. day 7.
FIGURE 2
FIGURE 2
PWB induces a decrease in muscle force which is not seen in traditional EIM values and parameters. Evolution of EIM values at 50 kHz during 14 days of exposure to HLS including longitudinal phase (LP, A), longitudinal reactance (LX, B) and longitudinal resistance (LR, C), n = 7–16 per group. Calculated parameters based on multifrequency analysis including phase-slope (P-slope, D) and area under curve of the reactance (LX AUC, E), n = 7–16 per group. Change in rear paw grip force (RPGF) during 14 days of exposure to PWB (F), n = 24–39 per group. All results are displayed as mean ± SEM. Data were analyzed using a 2-way repeated measures ANOVA and followed by Tukey’s post hoc tests. Results of Tukey’s tests are displayed on the graph as a, b, c: p < 0.05, p < 0.001, p < 0.0001 vs. PWB100, respectively; d, e, f, g: p < 0.05, p < 0.01, p < 0.001, p < 0.0001 vs. day 0, respectively; and h: p < 0.001 vs. PWB70. Details of the ANOVA analysis can be found in the Supplementary Table 2.
FIGURE 3
FIGURE 3
The strongest muscle deconditioning occurs during the first week of PWB and is associated with significant alterations in EIM values and parameters. Slope for the change in rear paw grip force during the first week of exposure to PWB (A). 50 kHz EIM values at 7 days of exposure to PWB including longitudinal phase (LP, B), longitudinal reactance (LX, C), and longitudinal resistance (LR, D). Calculated parameters at 7 days of exposure to PWB including area under curve of the reactance (LX AUC, E) and reactance-slope (X-slope, F). All results are displayed as mean ± SEM with n = 7–16 per group except for panel A (n = 35–39 per group). Data were analyzed using a 2-way repeated measures ANOVA and followed by Tukey’s post hoc tests. Results of Tukey’s tests are displayed on the graph as *, **, ***, ****: p < 0.05, p < 0.01, p < 0.001, p < 0.0001 vs. PWB 100, respectively; #: p < 0.05 vs. PWB70. Lines represent the results of the linear post hoc test across all groups. Detailed statistics of the ANOVA can be found in Supplementary Table 2.
FIGURE 4
FIGURE 4
EIM variability is correlated to functional changes in grip force in rats exposed to PWB. Correlations between evolution of EIM parameters and the slope of the change in rear paw grip force during the 1st and 2nd week of exposure to PWB. EIM values include longitudinal resistance at 50 kHz (LR 50, A), longitudinal reactance at 50 kHz (LX 50, B), and the calculated parameters of reactance-slope (X-slope, C), and phase-slope (P-slope, D). Results were analyzed with Spearman correlations and the r coefficients are displayed on the graph. N = 8 per group, *, **p < 0.05 and p < 0.01, δp < 0.10. A negative RPGF slope represents a decrease in RPGF. A positive weekly change in EIM represents an increase in value.

References

    1. Baldwin K. M. (1996). Effect of spaceflight on the functional, biochemical, and metabolic properties of skeletal muscle. Med. Sci. Sports Exerc. 28 983–987. 10.1097/00005768-199608000-00008 - DOI - PubMed
    1. Bloomfield S. A. (1997). Changes in musculoskeletal structure and function with prolonged bed rest. Med. Sci. Sports Exerc. 29 197–206. 10.1097/00005768-199702000-00006 - DOI - PubMed
    1. Chowdhury P., Long A., Harris G., Soulsby M. E., Dobretsov M. (2013). Animal model of simulated microgravity: a comparative study of hindlimb unloading via tail versus pelvic suspension. Physiol. Rep. 1:e00012. 10.1002/phy2.12 - DOI - PMC - PubMed
    1. Clark-Matott J., Nagy J. A., Sanchez B., Taylor R., Riveros D., Abraham N. A., et al. (2019). Altered muscle electrical tissue properties in a mouse model of premature aging. Muscle Nerve 60 801–810. 10.1002/mus.26714 - DOI - PMC - PubMed
    1. Desplanches D. (1997). Structural and functional adaptations of skeletal muscle to weightlessness. Int. J. Sport. Med. Suppl. 18 S259–S264. 10.1055/s-2007-972722 - DOI - PubMed