

Pancreatic Alpha-Cells Contribute Together With Beta-Cells to CXCL10 Expression in Type 1 Diabetes
- PMID: 33042009
- PMCID: PMC7523508
- DOI: 10.3389/fendo.2020.00630
Pancreatic Alpha-Cells Contribute Together With Beta-Cells to CXCL10 Expression in Type 1 Diabetes
Abstract
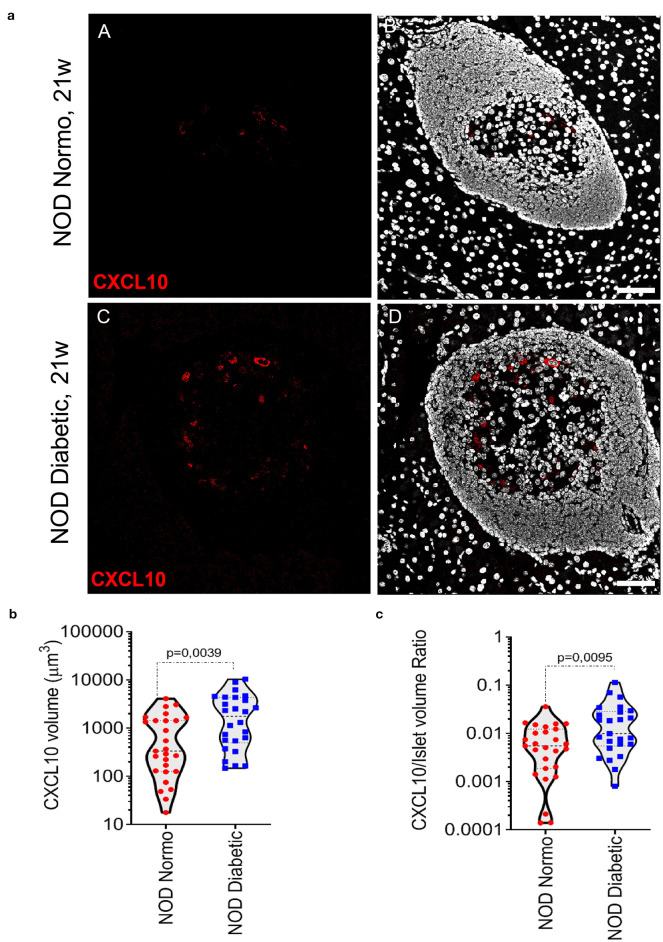
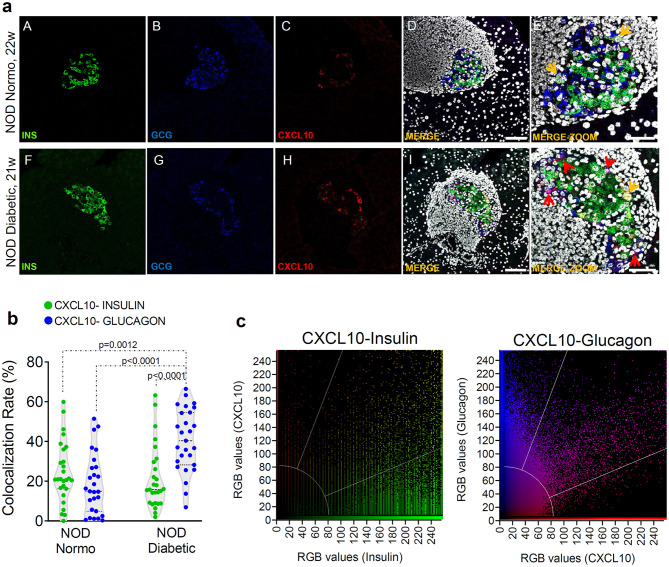
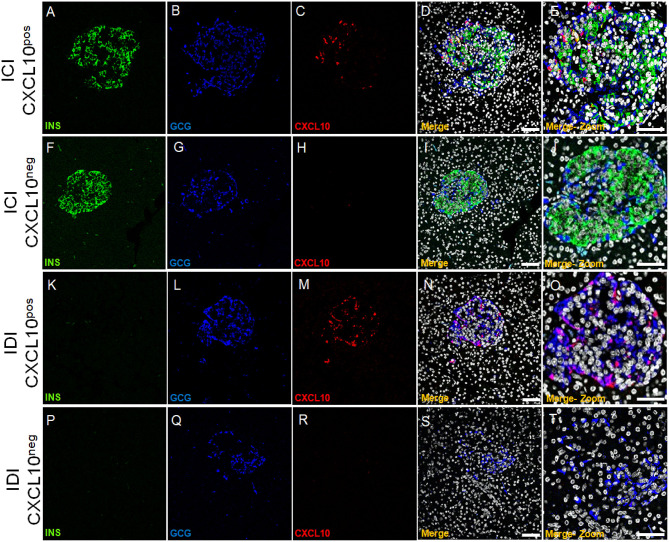
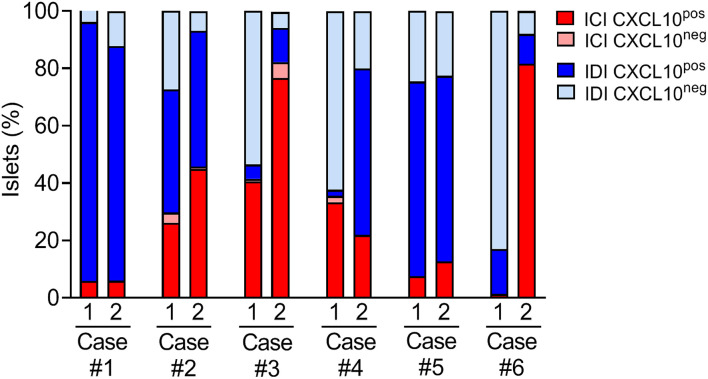
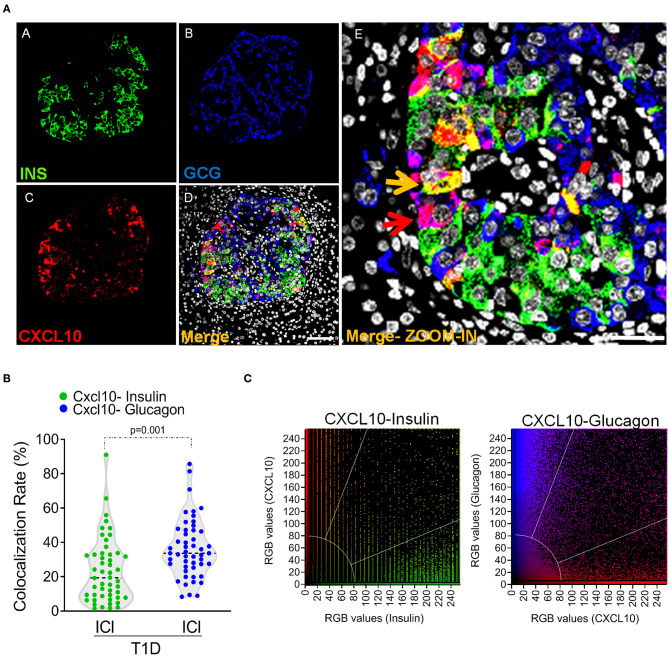
C-X-C Motif Chemokine Ligand 10 (CXCL10) is a pro-inflammatory chemokine specifically recognized by the ligand receptor CXCR3 which is mostly expressed in T-lymphocytes. Although CXCL10 expression and secretion have been widely associated to pancreatic islets both in non-obese diabetic (NOD) mice and in human type 1 diabetic (T1D) donors, the specific expression pattern among pancreatic endocrine cell subtypes has not been clarified yet. Therefore, the purpose of this study was to shed light on the pancreatic islet expression of CXCL10 in NOD, in C57Bl/6J and in NOD-SCID mice as well as in human T1D pancreata from new-onset T1D patients (DiViD study) compared to non-diabetic multiorgan donors from the INNODIA European Network for Pancreatic Organ Donors with Diabetes (EUnPOD). CXCL10 was expressed in pancreatic islets of normoglycaemic and new-onset diabetic NOD mice but not in C57Bl/6J and NOD-SCID mice. CXCL10 expression was increased in pancreatic islets of new-onset diabetic NOD mice compared to normoglycaemic NOD mice. In NOD mice, CXCL10 colocalized both with insulin and glucagon. Interestingly, CXCL10-glucagon colocalization rate was significantly increased in diabetic vs. normoglycaemic NOD mouse islets, indicating an increased expression of CXCL10 also in alpha-cells. CXCL10 was expressed in pancreatic islets of T1D patients but not in non-diabetic donors. The analysis of the expression pattern of CXCL10 in human T1D pancreata from DiViD study, revealed an increased colocalization rate with glucagon compared to insulin. Of note, CXCL10 was also expressed in alpha-cells residing in insulin-deficient islets (IDI), suggesting that CXCL10 expression in alpha cells is not driven by residual beta-cells and therefore may represent an independent phenomenon. In conclusion, we show that in T1D CXCL10 is expressed by alpha-cells both in NOD mice and in T1D patients, thus pointing to an additional novel role for alpha-cells in T1D pathogenesis and progression.
Keywords: CXCL10; alpha-cells; chemokines; pancreas; type 1 diabetes.
Copyright © 2020 Nigi, Brusco, Grieco, Licata, Krogvold, Marselli, Gysemans, Overbergh, Marchetti, Mathieu, Dahl Jørgensen, Sebastiani and Dotta.
Figures
Similar articles
-
Increased Expression of Viral Sensor MDA5 in Pancreatic Islets and in Hormone-Negative Endocrine Cells in Recent Onset Type 1 Diabetic Donors.Front Immunol. 2022 Mar 11;13:833141. doi: 10.3389/fimmu.2022.833141. eCollection 2022. Front Immunol. 2022. PMID: 35359976 Free PMC article.
-
Loss of insulin-expressing extra-islet cells in type 1 diabetes is accompanied with increased number of glucagon-expressing extra-islet cells.Virchows Arch. 2025 Apr;486(4):687-695. doi: 10.1007/s00428-024-03842-4. Epub 2024 Jun 26. Virchows Arch. 2025. PMID: 38922355 Free PMC article.
-
Changes in expression of P2X7 receptors in NOD mouse pancreas during the development of diabetes.Autoimmunity. 2007 Mar;40(2):108-16. doi: 10.1080/08916930601118841. Autoimmunity. 2007. PMID: 17364502
-
Chemokines as Drivers of the Autoimmune Destruction in Type 1 Diabetes: Opportunity for Therapeutic Intervention in Consideration of an Optimal Treatment Schedule.Front Endocrinol (Lausanne). 2020 Oct 19;11:591083. doi: 10.3389/fendo.2020.591083. eCollection 2020. Front Endocrinol (Lausanne). 2020. PMID: 33193102 Free PMC article. Review.
-
Pancreatic α-cells - The unsung heroes in islet function.Semin Cell Dev Biol. 2020 Jul;103:41-50. doi: 10.1016/j.semcdb.2020.01.006. Epub 2020 Jan 24. Semin Cell Dev Biol. 2020. PMID: 31983511 Review.
Cited by
-
Network approach reveals preferential T-cell and macrophage association with α-linked β-cells in early stage of insulitis in NOD mice.Front Netw Physiol. 2024 Jun 24;4:1393397. doi: 10.3389/fnetp.2024.1393397. eCollection 2024. Front Netw Physiol. 2024. PMID: 38979061 Free PMC article.
-
Chemokines in Type 1 Diabetes Mellitus.Front Immunol. 2022 Feb 15;12:690082. doi: 10.3389/fimmu.2021.690082. eCollection 2021. Front Immunol. 2022. PMID: 35242125 Free PMC article.
-
The Role of Chemokines in Obesity and Exercise-Induced Weight Loss.Biomolecules. 2024 Sep 4;14(9):1121. doi: 10.3390/biom14091121. Biomolecules. 2024. PMID: 39334887 Free PMC article. Review.
-
Decoding the Significance of Alpha Cell Function in the Pathophysiology of Type 1 Diabetes.Cells. 2024 Nov 19;13(22):1914. doi: 10.3390/cells13221914. Cells. 2024. PMID: 39594662 Free PMC article. Review.
-
Alpha cell dysfunction in type 1 diabetes is independent of a senescence program.Front Endocrinol (Lausanne). 2022 Oct 7;13:932516. doi: 10.3389/fendo.2022.932516. eCollection 2022. Front Endocrinol (Lausanne). 2022. PMID: 36277717 Free PMC article.
References
Publication types
MeSH terms
Substances
LinkOut - more resources
Full Text Sources
Other Literature Sources
Medical