

Monitoring of Nitrification in Chloraminated Drinking Water Distribution Systems With Microbiome Bioindicators Using Supervised Machine Learning
- PMID: 33042076
- PMCID: PMC7526508
- DOI: 10.3389/fmicb.2020.571009
Monitoring of Nitrification in Chloraminated Drinking Water Distribution Systems With Microbiome Bioindicators Using Supervised Machine Learning
Abstract
Many drinking water utilities in the United States using chloramine as disinfectant treatment in their drinking water distribution systems (DWDS) have experienced nitrification episodes, which detrimentally impact the water quality. Identification of potential predictors of nitrification in DWDS may be used to optimize current nitrification monitoring plans and ultimately helps to safeguard drinking water and public health. In this study, we explored the water microbiome from a chloraminated DWDS simulator operated through successive operational schemes of stable and nitrification events and utilized the 16S rRNA gene dataset to generate high-resolution taxonomic profiles for bioindicator discovery. Analysis of the microbiome revealed both an enrichment and depletion of various bacterial populations associated with nitrification. A supervised machine learning approach (naïve Bayes classifier) trained with bioindicator profiles (membership and structure) were used to classify water samples. Performance of each model was examined using the area under the curve (AUC) from the receiver-operating characteristic (ROC) and precision-recall (PR) curves. The ROC- and PR-AUC gradually increased to 0.778 and 0.775 when genus-level membership (i.e., presence and absence) was used in the model and increased significantly using structure (i.e., distribution) dataset (AUCs = 1.000, p < 0.01). Community structure significantly improved the predictive ability of the model beyond that of membership only regardless of the type of data (sequence- or taxonomy-based model) we used to represent the microbiome. In comparison, an ATP-based model (bulk biomass) generated a lower AUCs of 0.477 and 0.553 (ROC and PR, respectively), which is equivalent to a random classification. A combination of eight bioindicators was able to correctly classify 85% of instances (nitrification or stable events) with an AUC of 0.825 (sensitivity: 0.729, specificity: 0.894) on a full-scale DWDS test set. Abiotic-based model using total Chlorine/NH2Cl and NH3 generated AUCs of 0.740 and 0.861 (ROC and PR, respectively), corresponding to a sensitivity of 0.250 and a specificity of 0.957. The AUCs increased to > 0.946 with the addition of NO2 - concentration, which is indicative of nitrification in the DWDS. This research provides evidence of the feasibility of using bioindicators to predict operational failures in the system (e.g., nitrification).
Keywords: bioindicators; machine learning; microbiome; nitrification; receiver-operating characteristic.
Copyright © 2020 Gomez-Alvarez and Revetta.
Figures
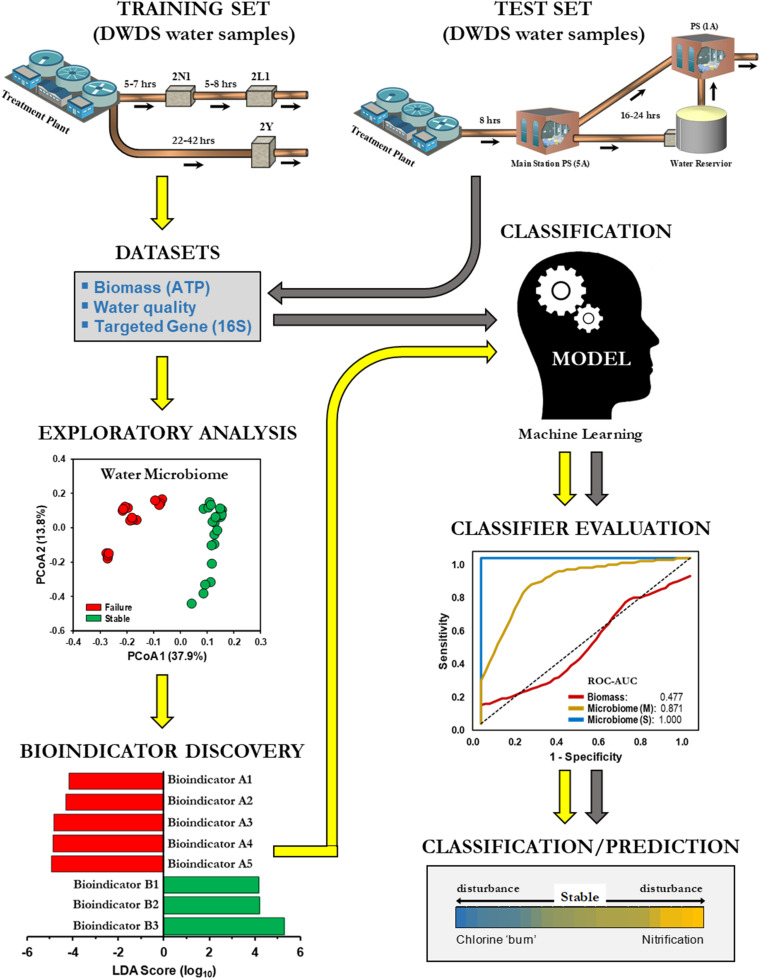
 ) and test (
 ) datasets.
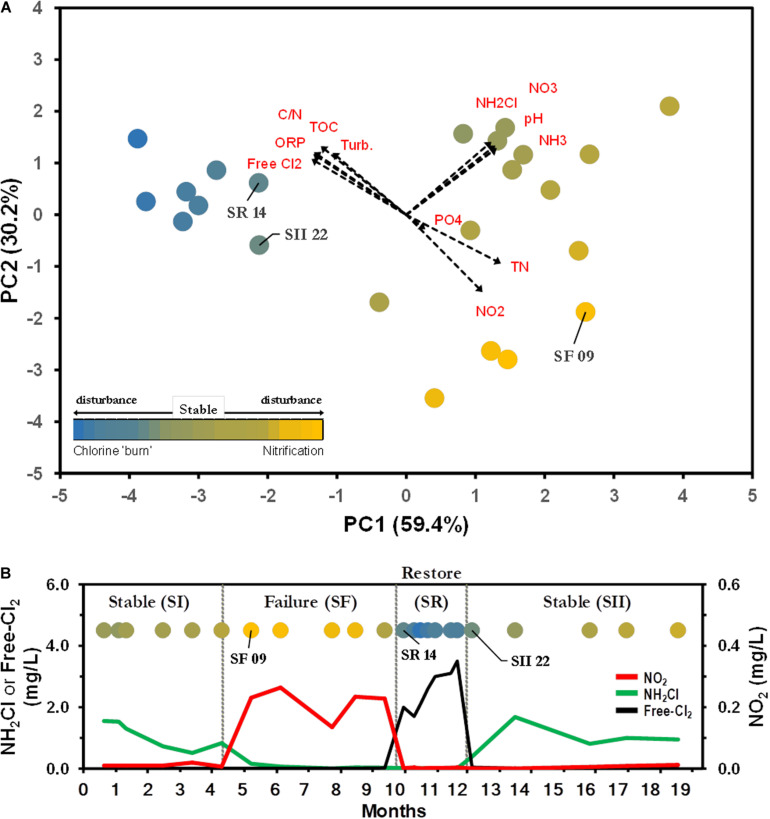
 ), SF (
 ), SR (
 ). Water quality values are listed in Supplementary Table S1. (B) The simulator was operated through four successive operational schemes; a stable period (SI) where chloramine residual (
 ) is maintained to a failure period (SF) where no chloramine residual is maintained as a result of nitrification (
 ), followed by a ‘chlorine burn’ (SR) by switching disinfectant from chloramine to free chlorine () and switching back to chloramine resuming normal operation (SII).
 ), Failure (SF,
  ). (B) Identification of statistically significant genus-level assigned OTU bioindicators using linear discriminative analysis (LDA) effect size (LEfSe) analyses (LDA score > 4.0, p < 0.0001). Negative LDA scores are enriched in SF while positive LDA scores are enriched in SS events. (C) Receiver operating characteristic (ROC) and (D) Precision-recall (PR) curves with area under the curve (AUC) values and 95% confidence intervals in parenthesis for predictive model comparing biomass (ATP,
  ) and microbial bioindicators based on community membership [OTU (M), ] and structure OTU (S),
  ] data. Dashed lines indicate the null model. Samples: biomass, n = 32; OTU, n = 48.
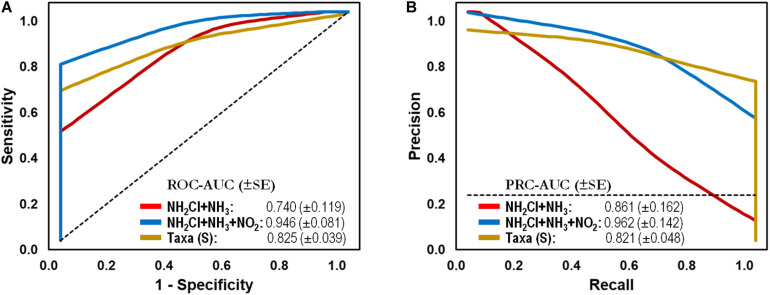 ) and water quality (parameters: NH2Cl + NH3,
  ; NH2Cl + NH3 + NO2–,
  ) data. Dashed lines indicate the null model. Samples: Failure, n = 48; Stable, n = 113.
Similar articles
-
Review of Nitrification Monitoring and Control Strategies in Drinking Water System.Int J Environ Res Public Health. 2022 Mar 28;19(7):4003. doi: 10.3390/ijerph19074003. Int J Environ Res Public Health. 2022. PMID: 35409686 Free PMC article. Review.
-
Comparison of the microbiomes of two drinking water distribution systems-with and without residual chloramine disinfection.Microbiome. 2019 Jun 7;7(1):87. doi: 10.1186/s40168-019-0707-5. Microbiome. 2019. PMID: 31174608 Free PMC article.
-
Nitrifying niche differentiation in biofilms from full-scale chloraminated drinking water distribution system.Water Res. 2020 Jun 1;176:115738. doi: 10.1016/j.watres.2020.115738. Epub 2020 Mar 22. Water Res. 2020. PMID: 32259683
-
On-going nitrification in chloraminated drinking water distribution system (DWDS) is conditioned by hydraulics and disinfection strategies.J Environ Sci (China). 2020 Oct;96:151-162. doi: 10.1016/j.jes.2020.04.028. Epub 2020 May 30. J Environ Sci (China). 2020. PMID: 32819689
-
An ignored and potential source of taste and odor (T&O) issues-biofilms in drinking water distribution system (DWDS).Appl Microbiol Biotechnol. 2017 May;101(9):3537-3550. doi: 10.1007/s00253-017-8223-7. Epub 2017 Mar 31. Appl Microbiol Biotechnol. 2017. PMID: 28364166 Review.
Cited by
-
Review of Nitrification Monitoring and Control Strategies in Drinking Water System.Int J Environ Res Public Health. 2022 Mar 28;19(7):4003. doi: 10.3390/ijerph19074003. Int J Environ Res Public Health. 2022. PMID: 35409686 Free PMC article. Review.
-
A comparative analysis employing a gene- and genome-centric metagenomic approach reveals changes in composition, function, and activity in waterworks with different treatment processes and source water in Finland.Water Res. 2023 Feb 1;229:119495. doi: 10.1016/j.watres.2022.119495. Epub 2022 Dec 14. Water Res. 2023. PMID: 37155494 Free PMC article.
-
It's a Long Way to the Tap: Microbiome and DNA-Based Omics at the Core of Drinking Water Quality.Int J Environ Res Public Health. 2022 Jun 28;19(13):7940. doi: 10.3390/ijerph19137940. Int J Environ Res Public Health. 2022. PMID: 35805598 Free PMC article. Review.
-
Prediction of Smoking Habits From Class-Imbalanced Saliva Microbiome Data Using Data Augmentation and Machine Learning.Front Microbiol. 2022 Jul 19;13:886201. doi: 10.3389/fmicb.2022.886201. eCollection 2022. Front Microbiol. 2022. PMID: 35928158 Free PMC article.
-
Biomni: A General-Purpose Biomedical AI Agent.bioRxiv [Preprint]. 2025 Jun 2:2025.05.30.656746. doi: 10.1101/2025.05.30.656746. bioRxiv. 2025. PMID: 40501924 Free PMC article. Preprint.
References
-
- Anderson M. J. (2001). A new method for non-parametric multivariate analysis of variance. Austral. Ecol. 26 32–46. 10.1111/j.1442-9993.2001.01070.pp.x - DOI
-
- Bartell S. M. (2006). Biomarkers, bioindicators, and ecological risk assessment-a brief review and evaluation. Environ. Bioind. 1 39–52.
-
- Bautista-de los Santos Q. M., Schroeder J. L., Sevillano-Rivera M. C., Sungthong R., Ijaz U. Z., Sloan W. T., et al. (2016). Emerging investigators series: microbial communities in full-scale drinking water distribution systems – a meta-analysis. Environ. Sci. 2 631–644. 10.1039/c6ew00030d - DOI
-
- Brodersen K. H., Ong C. S., Stephan K. E., Buhmann J. M. (2010). “The Binormal Assumption on Precision-Recall Curves,” in Proceedings of the 20th International Conference on Pattern Recognition, (Washington, DC: Institute of Electrical and Electronics Engineers; ), 4263–4266.
LinkOut - more resources
Full Text Sources
Research Materials