. 2020 Sep 17:11:2149.
doi: 10.3389/fimmu.2020.02149. eCollection 2020.

CXCL4 Links Inflammation and Fibrosis by Reprogramming Monocyte-Derived Dendritic Cells in vitro

Affiliations

CXCL4 Links Inflammation and Fibrosis by Reprogramming Monocyte-Derived Dendritic Cells in vitro

Sandra C Silva-Cardoso et al. Front Immunol. .

Abstract

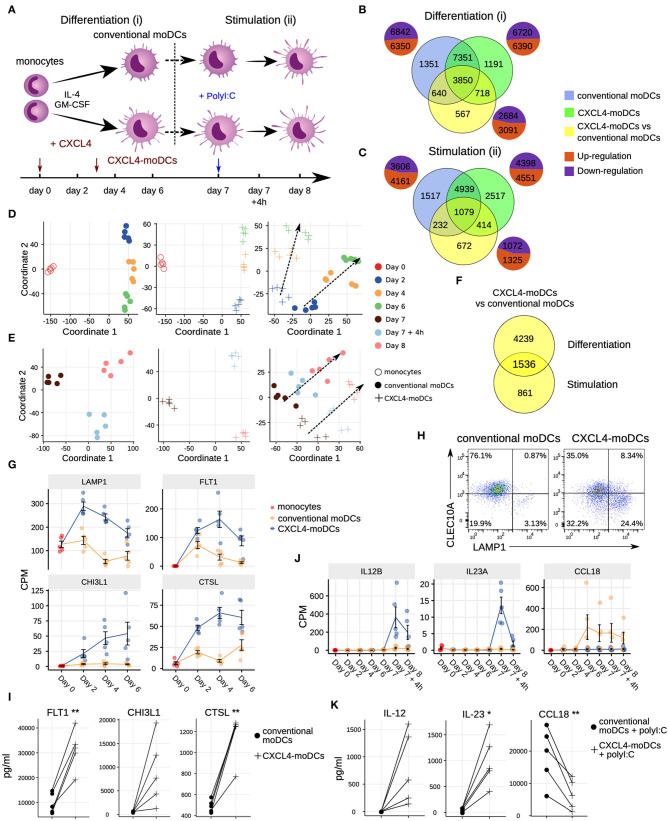
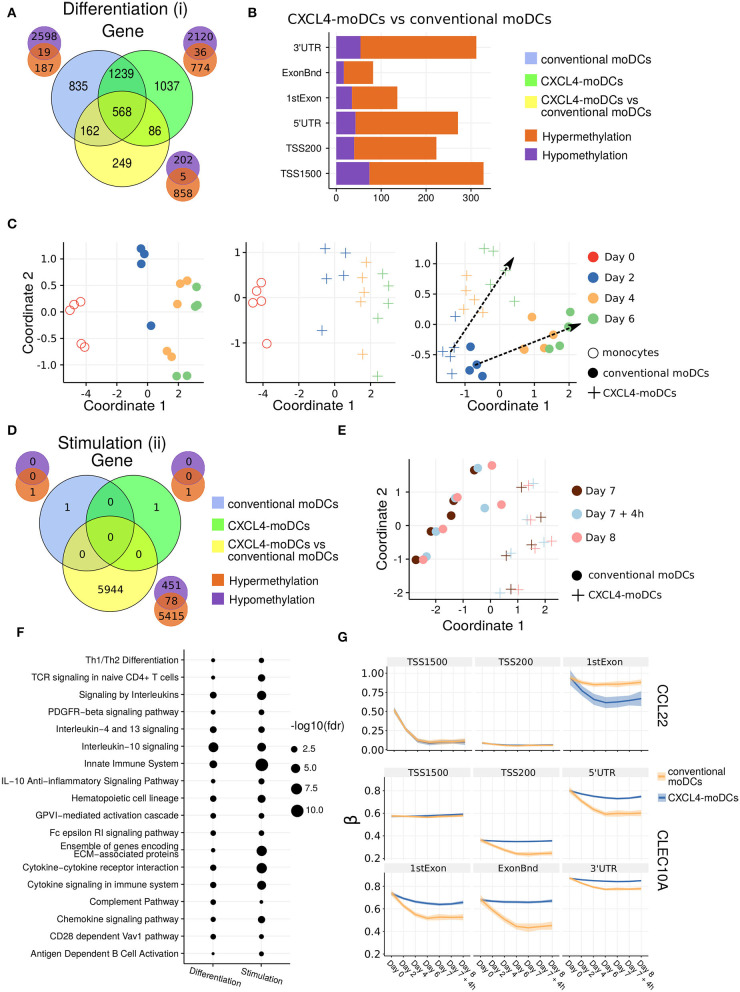
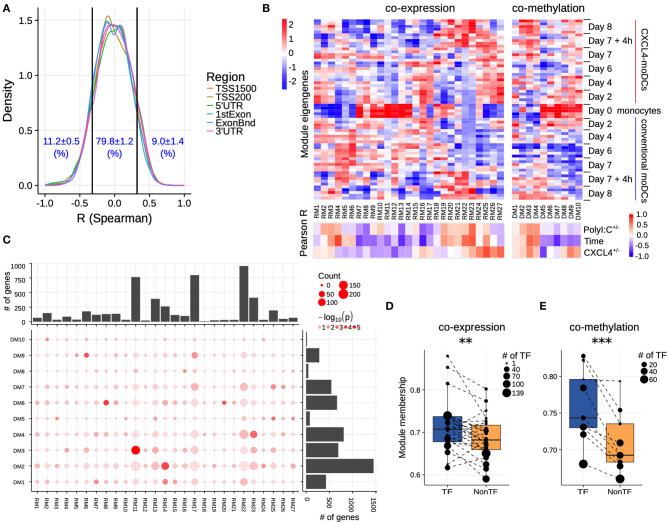
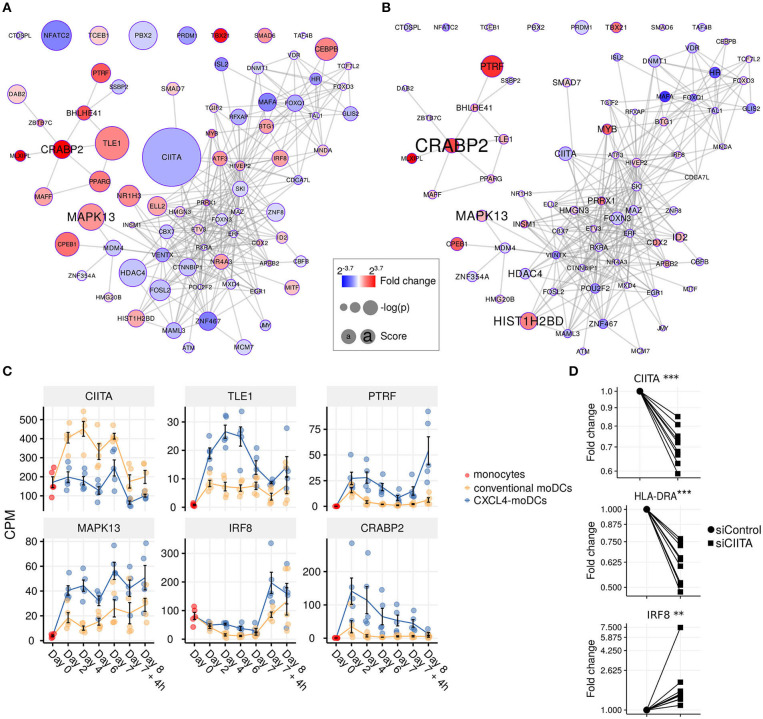
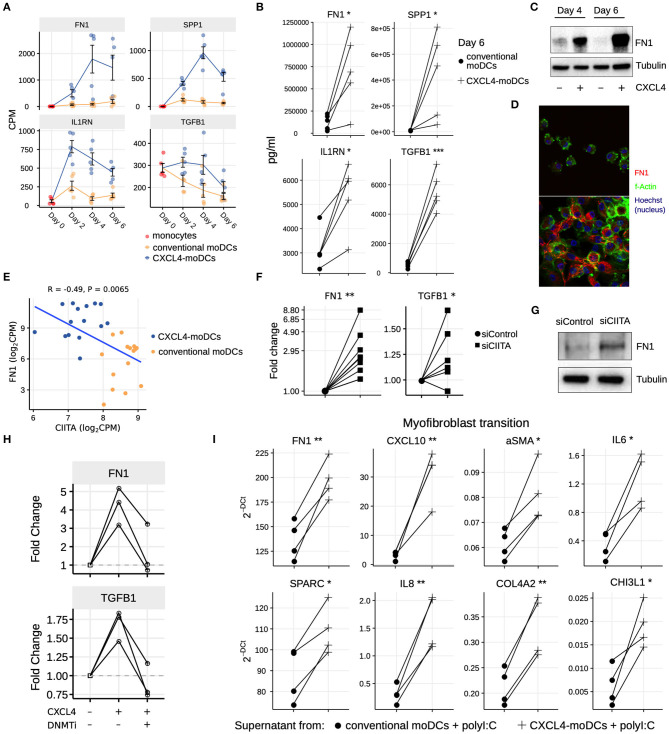
Fibrosis is a condition shared by numerous inflammatory diseases. Our incomplete understanding of the molecular mechanisms underlying fibrosis has severely hampered effective drug development. CXCL4 is associated with the onset and extent of fibrosis development in multiple inflammatory and fibrotic diseases. Here, we used monocyte-derived cells as a model system to study the effects of CXCL4 exposure on dendritic cell development by integrating 65 longitudinal and paired whole genome transcriptional and methylation profiles. Using data-driven gene regulatory network analyses, we demonstrate that CXCL4 dramatically alters the trajectory of monocyte differentiation, inducing a novel pro-inflammatory and pro-fibrotic phenotype mediated via key transcriptional regulators including CIITA. Importantly, these pro-inflammatory cells directly trigger a fibrotic cascade by producing extracellular matrix molecules and inducing myofibroblast differentiation. Inhibition of CIITA mimicked CXCL4 in inducing a pro-inflammatory and pro-fibrotic phenotype, validating the relevance of the gene regulatory network. Our study unveils that CXCL4 acts as a key secreted factor driving innate immune training and forming the long-sought link between inflammation and fibrosis.

Keywords: CXCL4; dendritic cells; fibrosis; gene regulatory networks; inflammation.


Figures

Figure 1
Figure 1
Transcriptomic programing of CXCL4-moDCs. (A) Schematic overview of the experimental setup: (i) differentiation of monocytes to conventional moDCs or CXCL4-moDCs; (ii) stimulation with polyI:C on day 7, for 4 h or 24 h. Overlap of differentially expressed genes (DEGs) during (B) differentiation and (C) after polyI:C stimulation of: monocytes into conventional moDCs (blue); monocytes into CXCL4-moDCs (green); and between CXCL4-moDCs and moDCs during differentiation (yellow). In (B,C) pie charts showing the number of upregulated (orange) and down-regulated (purple) genes. Multi-dimensional scaling (MDS) plot (D) differentiating and (E) stimulated conventional moDCs (left panel), CXCL4-moDCs (middle panel), and CXCL4-moDCs vs. conventional moDCs (right panel). In (D,E) dotted lines indicate trajectories over time. (F) Overlap of DEGs between CXCL4-moDCs and conventional moDCs, during differentiation and upon stimulation. Gene expression of example genes differential during (G) differentiation and (J) stimulation between CXCL4-moDCs and conventional moDCs. Validation of (H) protein expression (flow cytometry) and (I) cytokine production (Luminex) on day 6. (K) Validation of cytokine production (Luminex) on day 8. Gene expressions are shown as mean ± SEM. CPM, count per million. In panels (I,K), lines connect individual donors (n = 5). *P < 0.05; **P < 0.01, paired two-sided Student's t-test.
Figure 2
Figure 2
DNA methylation analysis of CXCL4-moDCs and conventional moDCs. (A) Overlap between differentially methylated genes (DMGs) found during differentiation similar to Figure 1B. A gene is considered differentially methylated if any region on the gene is differentially methylated. Smaller Venn diagram graphs display the overlap of hyper-methylated (orange) and hypo-methylated (purple) genes for each comparison. Note some genes are classified as both hyper-methylated and hypo-methylated based on different regions. (B) Distribution of differentially methylated regions (1,500 and 200 base pairs upstream of the transcription start site (TSS), 5' untranslated region (UTR), 1st exon, other exons (ExonBnd) and 3' UTR) between CXCL4-moDCs and conventional moDCs during differentiation. (C) MDS analysis using DMRs, similar to Figure 1D. (D) Overlap between DMGs found during stimulation similar to Figure 1C. (E) MDS analysis using all DMRs between CXCL4-moDCs and conventional moDCs during stimulation. (F) Top enriched pathways from DMGs between CXCL4-moDCs and conventional moDCs during differentiation and stimulation. (G) DNA methylation β values (see Methods) of CCL22 and CLEC10A. Lines represent mean β values and shading represents 95% confidence interval.
Figure 3
Figure 3
Co-expression and co-methylation networks. (A) Distribution of spearman correlation coefficients (R) between β values of each region and the corresponding gene expression for all genes that are differentially expressed and methylated. The cutoffs (two vertical lines at R = ±0.32) indicate significant correlation coefficients (p < 0.01). (B) The top heatmap shows expression/methylation eigengenes of co-expression (left) and co-methylation (right) modules. The bottom heatmap shows the Pearson correlation coefficients between sample traits (i.e., CXCL4+/−, time and polyI:C+/−), and co-expression (left) and co-methylation (right) module eigengenes. (C) Concordance of co-expression and co-methylation modules. The bottom left graph shows the number (circle size) and significance (color, p-value calculated by Fisher's exact test) of overlapping genes between co-expression and co-methylation modules. The bar plots show the total number of genes in the co-expression (top) or co-methylation (right) module. Module membership comparisons of transcriptional regulators (TF) and other genes (NonTF) in (D) co-expression and (E) co-methylation network. Each dot represents a module and the size denotes the number of TFs in the corresponding module. Modules that do not contain TFs were excluded in these analyses. **P < 0.01, ***P < 0.001, paired two-sided Student's t-test.
Figure 4
Figure 4
Transcription regulator enrichment highlights key TF candidates. Co-expression based key TF network during: (A) differentiation and (B) stimulation. Colors indicate fold change between CXCL4-moDCs and conventional moDCs. Red represents upregulation and blue represents downregulation. Circle size indicates –log10(p) for each comparison, where p is the p-value calculated during differential expression analysis; text size shows the RegEnrich score (see Methods). (C) Expression profile (mean±SEM) of key regulators. (D) Expression of CIITA, HLADRA, and IRF8 on day 6 measured by qPCR in moDCs obtained from monocytes transfected with silencer negative control siRNA (siControl) or silencer CIITA siRNA (siCIITA). qPCR data were normalized using mean expression of RPL32 and RPL13A. Fold change in y-axis (log2 scaled) is relative to the value obtained for siControl for each donor. Lines connect individual donors. *P < 0.05, ***P < 0.001, paired two-sided Student's t-test or two-sided Wilcoxon signed rank sum test (see Statistical Analyses in Materials and Methods).
Figure 5
Figure 5
CXCL4 induces production of ECM components in moDCs and fibroblasts. (A) Expression of genes implicated in ECM remodeling (mean±SEM). (B) Validation (luminex) of ECM protein production in CXCL4-moDCs and conventional moDCs on day 6. (C) Fibronectin (FN1) expression (tubulin as loading control) determined using Western blot on days 4 and 6 (representative of 5 independent experiments). (D) Fibronectin (red) synthesis determined using confocal imaging on day 6 (green: f-actin; and blue: nucleus staining using Hoechst). (E) Pearson correlation between gene expression of CIITA and FN1 during differentiation (i.e., on day 2, 4, and 6). (F) FN1 and TGFB1 expression measured by qPCR and (G) FN1 expression measured by western blot on day 6 moDCs obtained from monocytes transfected with siControl and siCIITA (see Figure S8D). (H) FN1 and TGFB1 expression measured by qPCR on day 3 in conventional moDCs, CXCL4-moDCs and CXCL4-moDCs exposed to DNMT inhibitor (100 nM 5-Aza-2′-deoxycytidine). (I) Expression of ECM genes measured using qPCR in healthy dermal fibroblasts (one representative donor; for others see Figure S9) co-cultured with supernatants from CXCL4-moDCs and moDCs that were stimulated for 24 h with polyI:C. qPCR data were normalized using mean expression of RPL32 and RPL13A. In panels (B,F,H,I) lines connect individual donors. *P < 0.05; **P < 0.01, ***P < 0.001, paired two-sided Student's t-test or two-sided Wilcoxon signed rank sum test (see Statistical Analyses in Materials and Methods).

References

    1. Rinkevich Y, Walmsley GG, Hu MS, Maan ZN, Newman AM, Drukker M, et al. . Identification and isolation of a dermal lineage with intrinsic fibrogenic potential. Science. (2015) 348:aaa2151. 10.1126/science.aaa2151 - DOI - PMC - PubMed
    1. Zeisberg M, Kalluri R. Cellular mechanisms of tissue fibrosis. 1. Common and organ-specific mechanisms associated with tissue fibrosis. Am J Physiol Cell Physiol. (2013) 304:C216–25. 10.1152/ajpcell.00328.2012 - DOI - PMC - PubMed
    1. Dowson C, Simpson N, Duffy L, O'Reilly S. Innate Immunity in Systemic Sclerosis. Curr Rheumatol Rep. (2017) 19:2. 10.1007/s11926-017-0630-3 - DOI - PubMed
    1. Wick G, Backovic A, Rabensteiner E, Plank N, Schwentner C, Sgonc R. The immunology of fibrosis: innate and adaptive responses. Trends Immunol. (2010) 31:110–9. 10.1016/j.it.2009.12.001 - DOI - PMC - PubMed
    1. Levine SP, Wohl H. Human platelet factor 4 - purification and characterization by affinity chromatography - purification of human platelet factor-4. J Biol Chem. (1976) 251:324–8. - PubMed

Publication types

MeSH terms