. 2020 Sep 16:11:556695.
doi: 10.3389/fimmu.2020.556695. eCollection 2020.

Postnatal Expansion, Maturation, and Functionality of MR1T Cells in Humans

Affiliations

Postnatal Expansion, Maturation, and Functionality of MR1T Cells in Humans

Gwendolyn M Swarbrick et al. Front Immunol. .

Abstract

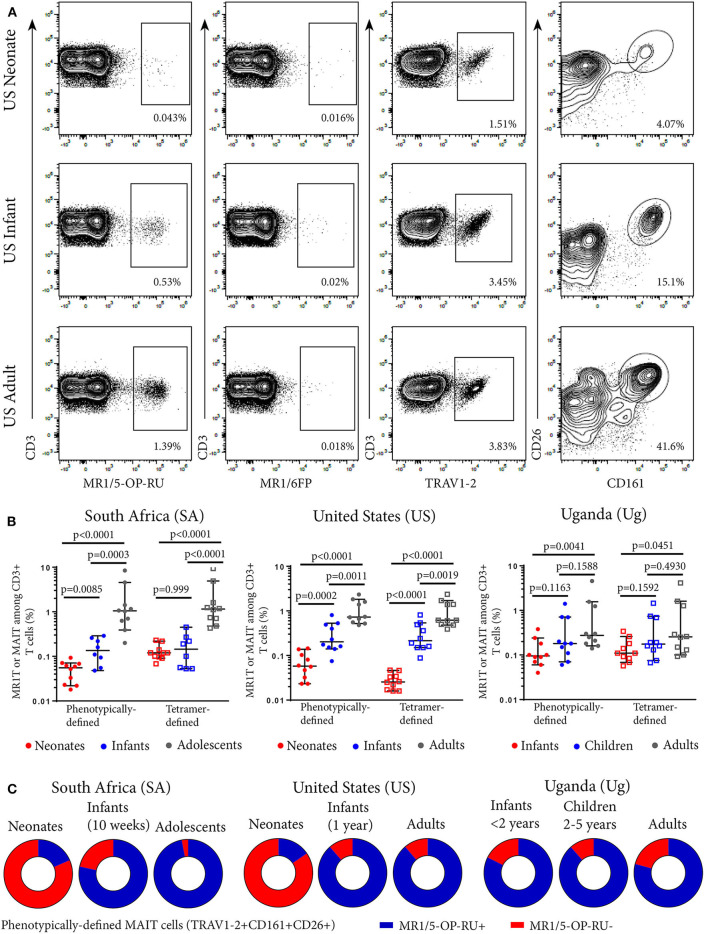
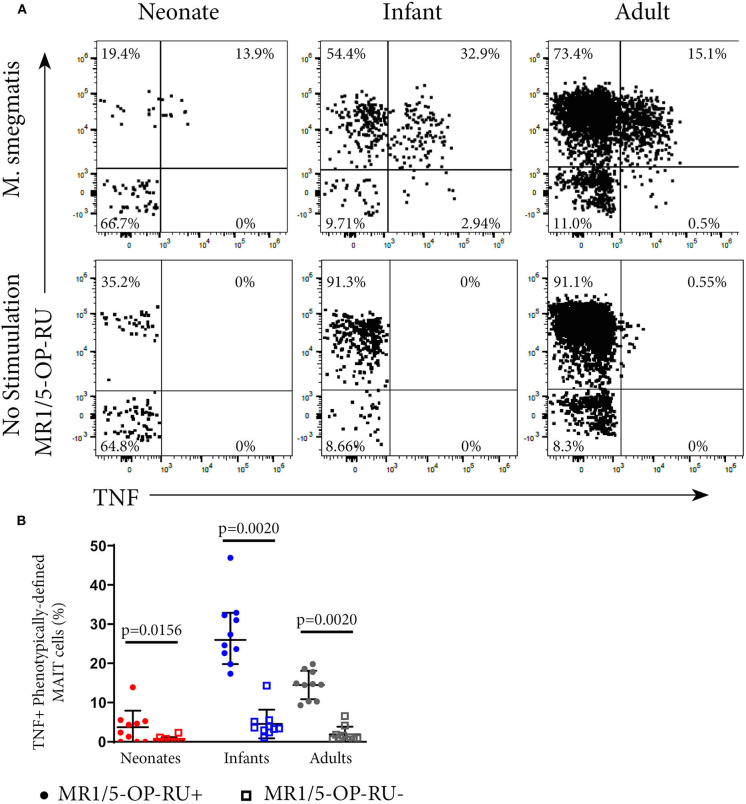
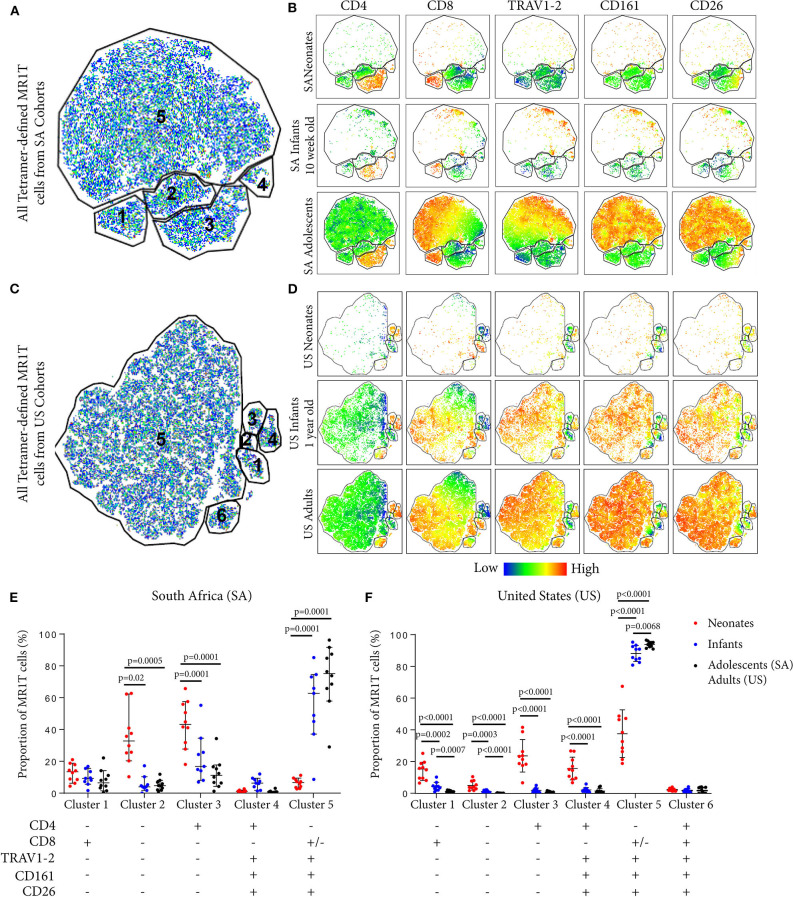
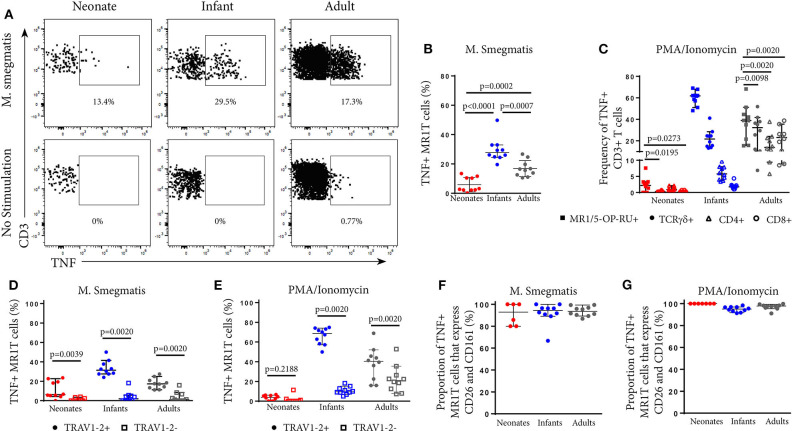
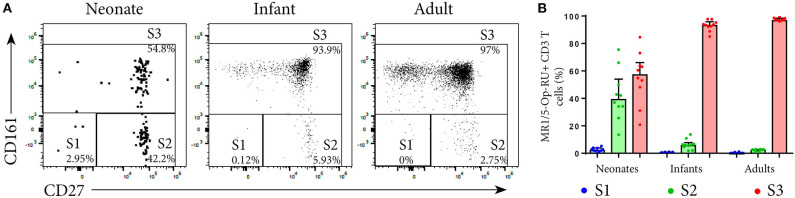
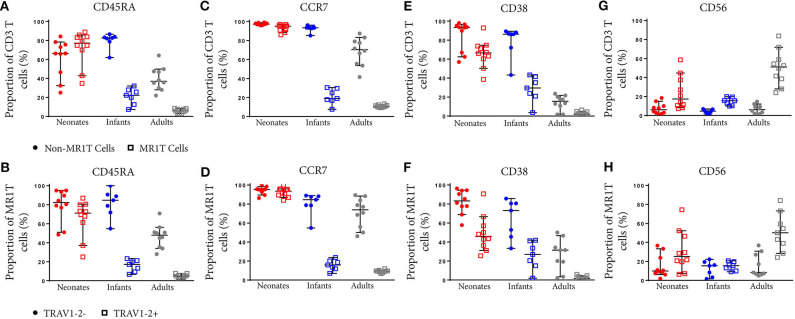
MR1-restricted T (MR1T) cells are defined by their recognition of metabolite antigens presented by the monomorphic MHC class 1-related molecule, MR1, the most highly conserved MHC class I related molecule in mammalian species. Mucosal-associated invariant T (MAIT) cells are the predominant subset of MR1T cells expressing an invariant TCR α-chain, TRAV1-2. These cells comprise a T cell subset that recognizes and mediates host immune responses to a broad array of microbial pathogens, including Mycobacterium tuberculosis. Here, we sought to characterize development of circulating human MR1T cells as defined by MR1-5-OP-RU tetramer labeling and of the TRAV1-2+ MAIT cells defined by expression of TRAV1-2 and high expression of CD26 and CD161 (TRAV1-2+CD161++CD26++ cells). We analyzed postnatal expansion, maturation, and functionality of peripheral blood MR1-5-OP-RU tetramer+ MR1T cells in cohorts from three different geographic settings with different tuberculosis (TB) vaccination practices, levels of exposure to and infection with M. tuberculosis. Early after birth, frequencies of MR1-5-OP-RU tetramer+ MR1T cells increased rapidly by several fold. This coincided with the transition from a predominantly CD4+ and TRAV1-2- population in neonates, to a predominantly TRAV1-2+CD161++CD26++ CD8+ population. We also observed that tetramer+ MR1T cells that expressed TNF upon mycobacterial stimulation were very low in neonates, but increased ~10-fold in the first year of life. These functional MR1T cells in all age groups were MR1-5-OP-RU tetramer+TRAV1-2+ and highly expressed CD161 and CD26, markers that appeared to signal phenotypic and functional maturation of this cell subset. This age-associated maturation was also marked by the loss of naïve T cell markers on tetramer+ TRAV1-2+ MR1T cells more rapidly than tetramer+TRAV1-2- MR1T cells and non-MR1T cells. These data suggest that neonates have infrequent populations of MR1T cells with diverse phenotypic attributes; and that exposure to the environment rapidly and preferentially expands the MR1-5-OP-RU tetramer+TRAV1-2+ population of MR1T cells, which becomes the predominant population of functional MR1T cells early during childhood.

Keywords: MAIT cells; human mucosal immunology; infant; innate T cells; tuberculosis.


Figures

Figure 1
Figure 1
Frequencies of tetramer-defined MR1T cell and phenotypically defined MAIT cell populations in peripheral blood from individuals of different ages. PBMC or CBMC were stained with a live/dead discriminator, antibodies to CD3, CD4, CD8, TRAV1-2, CD26, CD161, and either the MR1-5-OP-RU or MR1-6FP tetramers. Live, CD3+ lymphocytes were gated and the frequencies of MR1-5-OP-RU+ or TRAV1-2+CD161++CD26++ cells as a percentage of CD3+ lymphocytes were determined (gating strategy in Supplementary Figure 2). (A) Flow cytometry plots showing CD3+ T cell staining with MR1-5-OP-RU tetramer, MR1-6FP tetramer, TRAV1-2, or CD26/CD161 of samples from a representative US adult, infant, and neonate. (B) Frequencies of tetramer-defined (CD3+MR1-5-OP-RU+) and phenotypically-defined (CD3+TRAV1-2+ CD161++CD26++) MAIT cells in neonates, 10 week-old infants and adolescents from South Africa, neonates, 12 month-old infants and adults from the United States and infants (0-2 years old), children (2-5 years old) and adults from Uganda (all cohorts, n = 10). Mann-Whitney u-tests were used to test differences between groups. Horizontal lines depict the median and the error bars the 95% confidence interval. (C) Relative proportions of median phenotypically-defined (CD3+TRAV1-2+CD161++CD26++) MAIT cells that are MR1-5-OP-RU+ (Blue) and MR1-5-OP-RU (Red) for each age group at each site.
Figure 2
Figure 2
Functional analysis of MAIT cells in individuals of different ages. PBMC or CBMC from the US cohort were incubated overnight with M. smegmatis-infected A549 cells or uninfected A549 cells and then stained with the MR1-5-OP-RU or MR1-6FP tetramers, followed by staining with a live/dead discriminator and antibodies to TCRγδ, CD3, CD4, CD8, TRAV1-2, CD26, and CD161. ICS was then performed and the cells stained for TNF. (A) Dot plots showing representative co-staining of live, TCRγδCD3+TRAV1-2+CD161++CD26++ cells with MR1-5-OP-RU and TNF in M. smegmatis stimulated or unstimulated samples. The gating strategy is in Supplementary Figure 6. Examples of the TNF response in a neonate, infant, and adult are shown. (B) Frequencies of phenotypically-defined (CD3+TRAV1-2+CD161++CD26++) MAIT cells that are TNF+MR1-5-OP-RU+ or TNF+MR1-5-OP-RU are shown. Horizontal lines depict the median and the error bars the 95% confidence interval. Wilcoxon-rank sum was used to test differences within the same cohort.
Figure 3
Figure 3
Phenotypic diversity of MR1T cells in individuals of different ages. t-Distributed stochastic neighbor embedding (tSNE) plots showing MR1-5-OP-RU tetramer+CD3+ T cells (gating strategy in Supplementary Figure 2) from the South African (SA) or United States (US) cohorts (Table 1). Plots represent cells from 10 samples from each age group. (A) and (C) The five clusters identified in both sites are shown in (A) (SA) and (C) (US). (B) and (D) Dot plots colored by the relative expression level of each marker (CD4, CD8, TRAV1-2, CD161, or CD26) in tetramer-defined MR1T cells for each age group in (B) (SA) and (D) (US). Red = highest expression, blue = lowest expression. (E) and (F) The proportion of each cluster of tetramer-defined MR1T cells by age group is shown in (E) (SA) and (F) (US). Horizontal lines depict the median and the error bars the 95% confidence interval. Mann-Whitney u tests were used to test differences between groups.
Figure 4
Figure 4
Phenotypic analysis of functional MR1T cells at different ages. PBMC or CBMC from the US cohort were incubated overnight with M. smegmatis-infected A549 cells, uninfected A549 cells, or uninfected A549 cells and PMA/ionomycin. All cells were then stained with the MR1-5-OP-RU or MR1-6FP tetramers, followed by a live/dead discriminator and antibodies to TCRγδ, CD3, CD4, CD8, TRAV1-2, CD26, and CD161. ICS was then performed and the cells stained for TNF. Live, TCRγδCD3+MR1-5-OP-RU+ cells were gated and the TNF+ percentage determined in both the M. smegmatis stimulated and unstimulated conditions. The gating strategy is shown in Supplementary Figure 6. (A) Dot plots showing TNF expression by live, TCRγδMR1-5-OP-RU+ CD3+ cells in the same representative neonate, infant, and adult as Figure 2A. (B). Background subtracted frequencies of TNF+ MR1-5-OP-RU+ CD3+ cells in response to M. smegmatis-infected A549 cells as a percentage of total MR1-5-OP-RU+ CD3+ cells are shown. Mann-Whitney u-tests were used to test differences between groups. (C) Background subtracted frequencies of TNF+ cells to PMA/ionomycin among different T cell subpopulations, (1) MR1T cells (CD3+TCRγδMR1-5-OP-RU+ cells); (2) γδ T cells (CD3+TCR γδ+MR1-5-OP-RU cells); (3) CD8+ T cells (CD3+TCRγδMR1-5-OP-RUCD8+ cells); and (4) CD4+ T cells (CD3+TCRγδMR1-5-OP-RUCD4+ cells). Wilcoxon-rank sum was used to test differences within the same cohort. (D,E) Frequencies of TNF+TRAV1-2+ MR1-5-OP-RU+ CD3+ and TNF+TRAV1-2 MR1-5-OP-RU+ CD3+ cells in response to M. smegmatis infected A549 cells (D) or PMA/ionomycin stimulation (E) minus the background frequencies of TNF+TRAV1-2+/ MR1-5-OP-RU+ CD3+ cells. Wilcoxon-rank sum was used to test differences within the same cohort. (F,G) Frequencies of CD161++CD26++ cells of the TNF+TRAV1-2+MR1-5-OP-RU+CD3+ cells in response to M. smegmatis infected A549 cells (F) or PMA/ionomycin stimulation (G) are shown. The median and 95% confidence intervals are shown in each graph. When the 95% confidence intervals do not overlap between conditions, those conditions are considered statistically significant.
Figure 5
Figure 5
Analysis of MR1T cell development by measuring maturation markers. PBMC or CBMC from the US were stained as in Figure 1 with the addition of an antibody to CD27. Live, CD3+MR1-5-OP-RU+ cells (gating strategy in Supplementary Figure 2) were gated for the maturation pattern of S1, S2 and S3 described in (12). S1 = CD161CD27, S2 = CD161CD27+, S3 = CD161+CD27+/−. (A) Gating of MR1T cells for S1, S2, and S3 in a representative neonate, infant and adult. (B) Frequencies of S1, S2, and S3 MR1T cells as a percentage of CD3+ MR1-5-OP-RU+ cells are shown for U.S. neonates, infants and adults. Bars represent the median and the error bars the 95% confidence interval.
Figure 6
Figure 6
Comparative phenotypic analysis of MR1T and non-MR1T cells or TRAV1-2+ and TRAV1-2 MR1T cells at different ages. PBMC or CBMC from the US were stained as in Figure 1 with the addition of antibodies to either CD45RA (A,B), CCR7 (C,D), CD38 (E,F), or CD56 (G,H). The gating strategy is shown in Supplementary Figure 2 and examples of the staining of each marker is shown in Supplementary Figure 7. Frequencies of cells expressing each marker in non-MR1T cells (CD3+MR1-5-OP-RU) or MR1T cells (CD3+MR1-5-OP-RU+) in each age group (A,C,E,G). The frequency of each marker expressed in TRAV1-2+ or TRAV1-2 MR1T cells is shown in each age group (B,D,F,H). The median and 95% confidence intervals are shown in each graph. When the 95% confidence intervals do not overlap between conditions, those conditions are considered statistically significant.

Similar articles

Cited by

References

    1. Harriff MJ, McMurtrey C, Froyd CA, Jin HH, Cansler M, Null M, et al. . MR1 displays the microbial metabolome driving selective MR1-restricted T cell receptor usage. Sci Immunol. (2018) 3:eaao2556. 10.1126/sciimmunol.aao2556 - DOI - PMC - PubMed
    1. Godfrey DI, Koay HF, McCluskey J, Gherardin NA. The biology and functional importance of MAIT cells. Nat Immunol. (2019) 20:1110–28. 10.1038/s41590-019-0444-8 - DOI - PubMed
    1. Treiner E, Duban L, Bahram S, Radosavljevic M, Wanner V, Tilloy F, et al. . Selection of evolutionarily conserved mucosal-associated invariant T cells by MR1 (vol 422, pg 164, 2003). Nature. (2003) 423:1018. 10.1038/nature01700 - DOI - PubMed
    1. Martin E, Treiner E, Duban L, Guerri L, Laude H, Toly C, et al. . Stepwise development of MAIT cells in mouse and human. PLoS Biol. (2009) 7:525–36. 10.1371/journal.pbio.1000054 - DOI - PMC - PubMed
    1. Reantragoon R, Corbett AJ, Sakala IG, Gherardin NA, Furness JB, Chen ZJ, et al. . Antigen-loaded MR1 tetramers define T cell receptor heterogeneity in mucosal-associated invariant T cells. J Exp Med. (2013) 210:2305–20. 10.1084/jem.20130958 - DOI - PMC - PubMed

Publication types