. 2020 Sep 2;10(24):10993-11012.
doi: 10.7150/thno.43094. eCollection 2020.

CRISPR-Sunspot: Imaging of endogenous low-abundance RNA at the single-molecule level in live cells

Affiliations

CRISPR-Sunspot: Imaging of endogenous low-abundance RNA at the single-molecule level in live cells

Ning-He Sun et al. Theranostics. .

Abstract

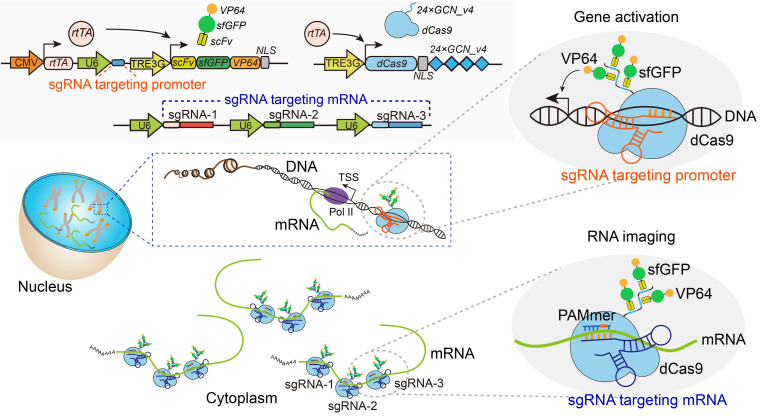
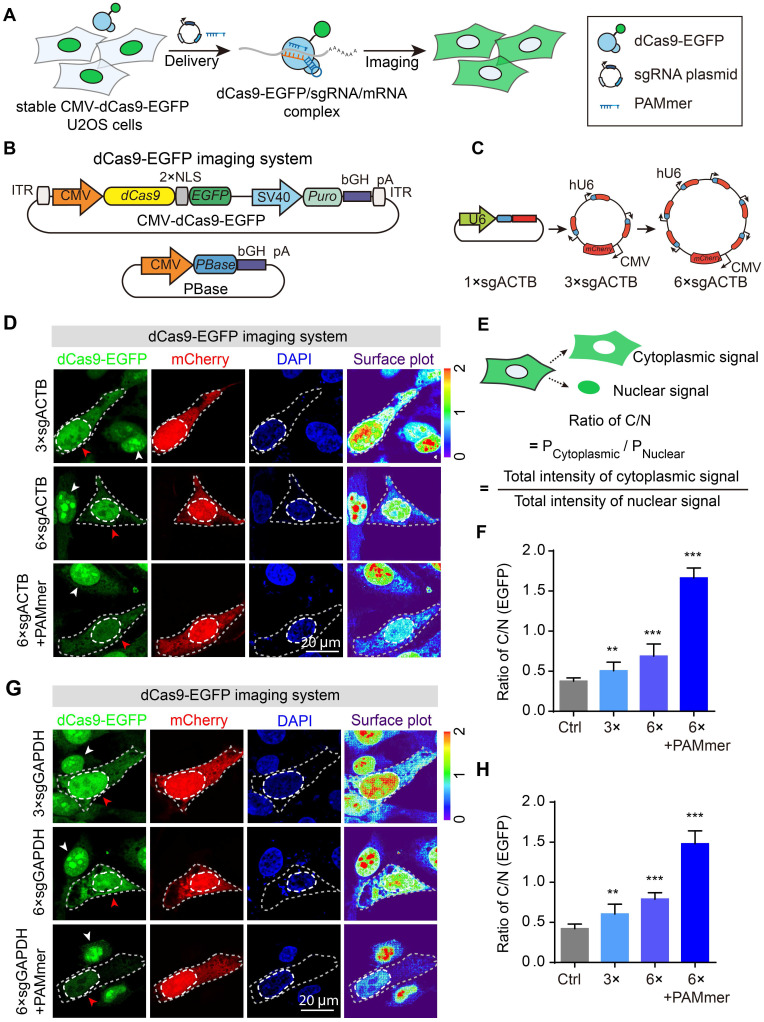
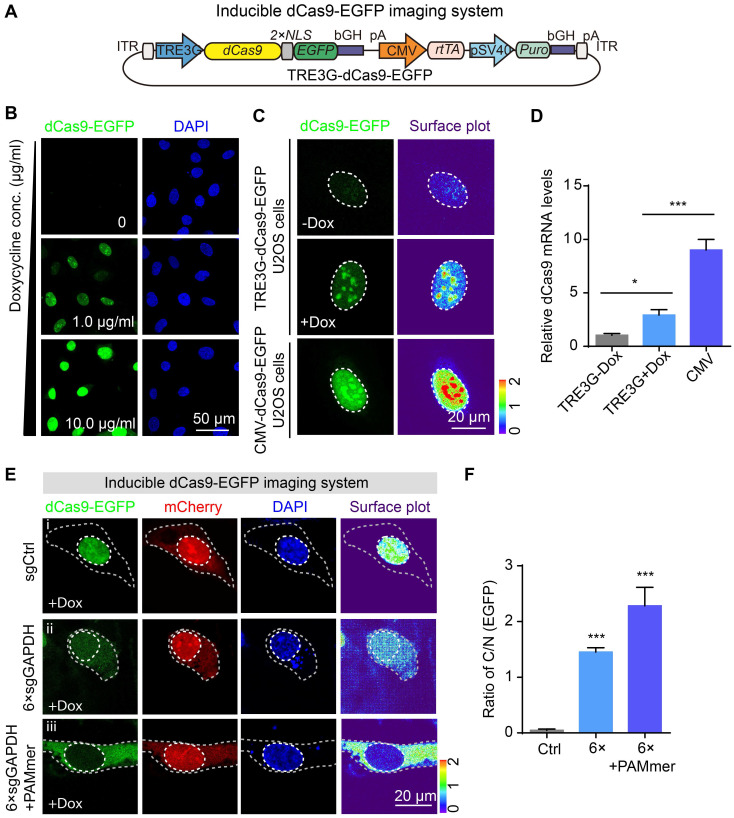
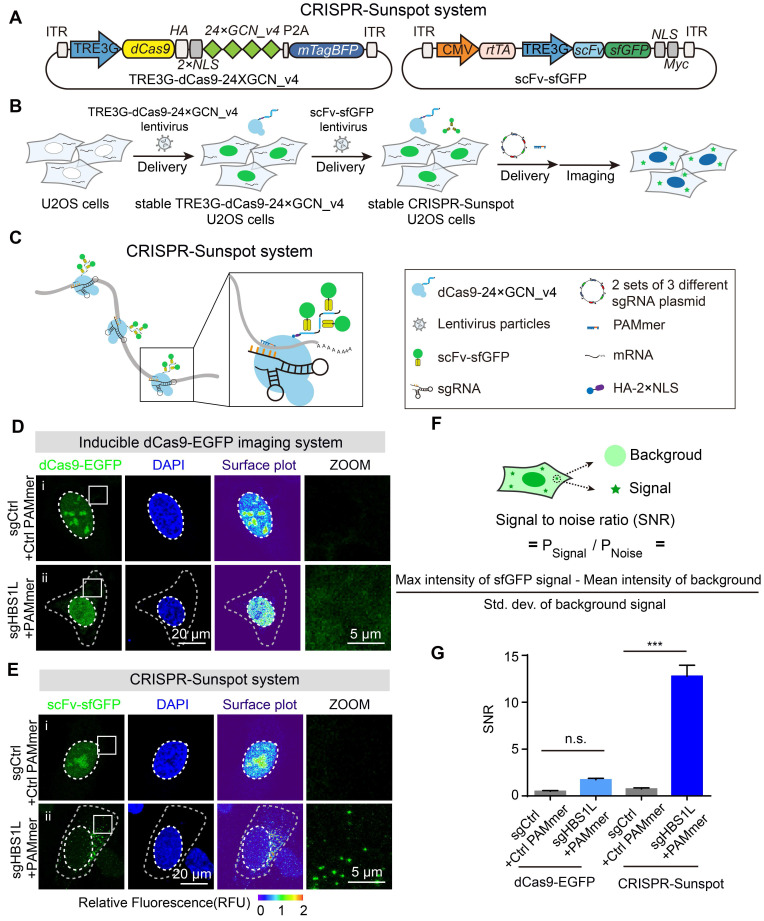
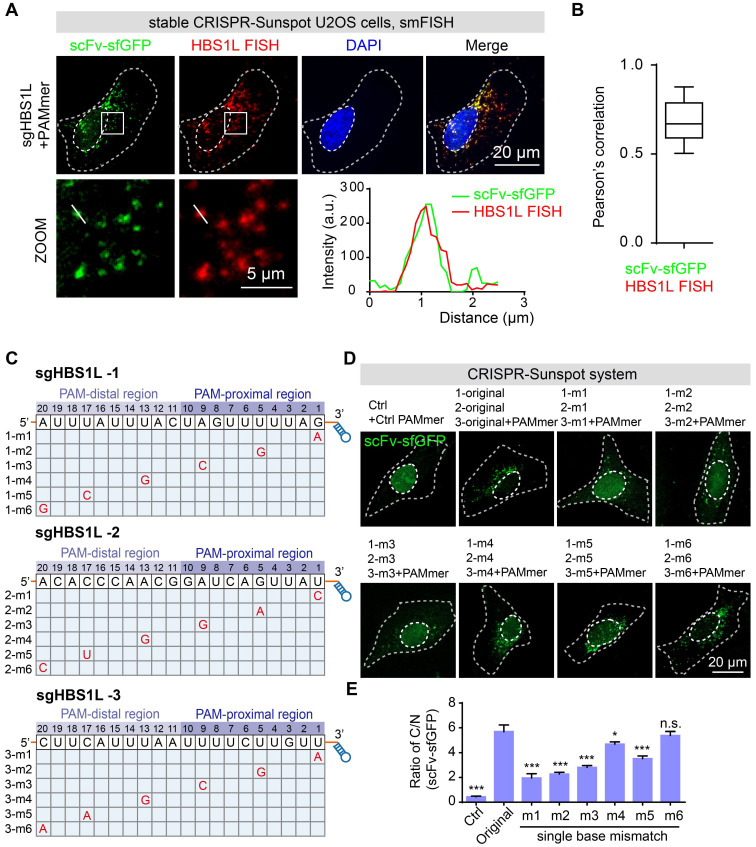
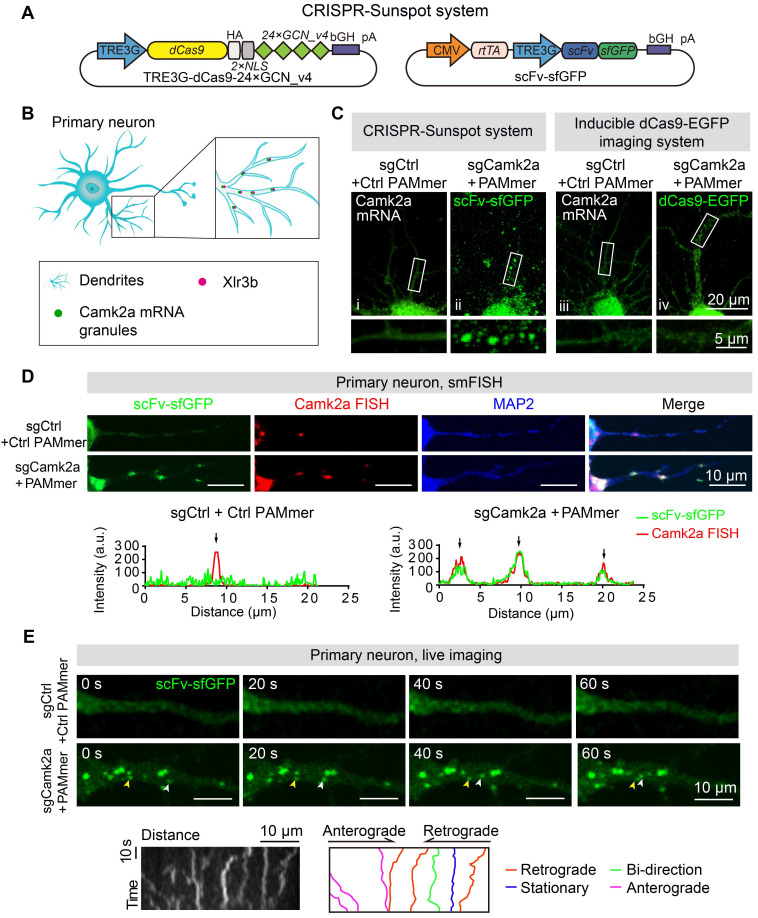
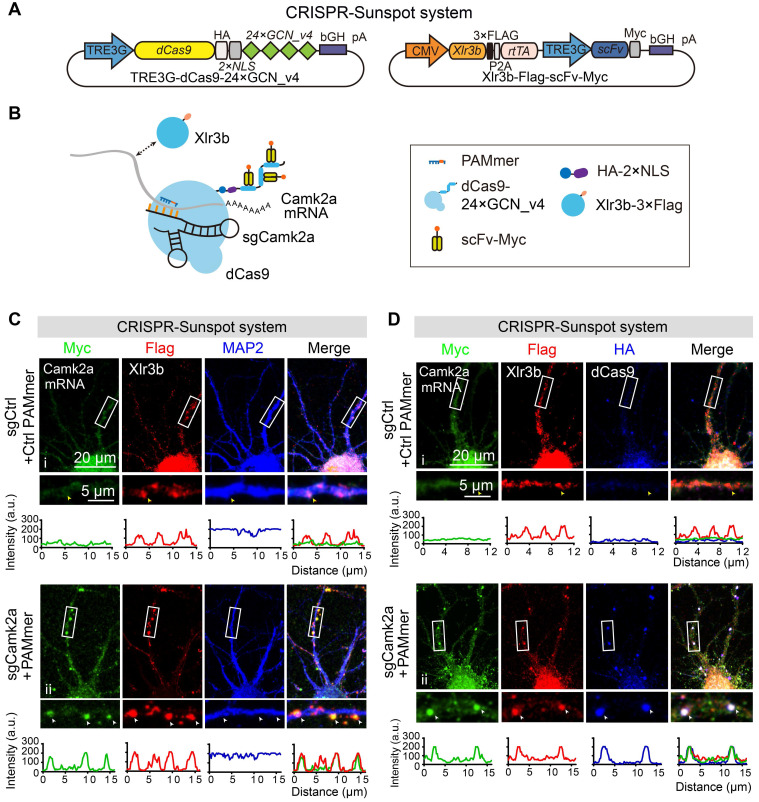
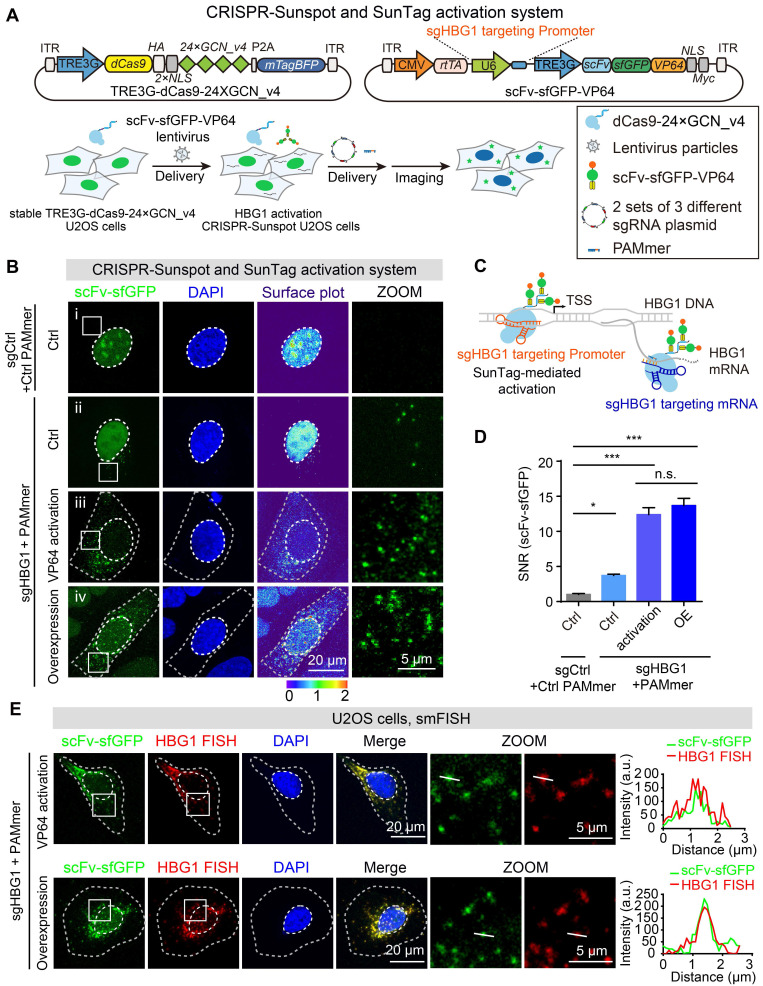
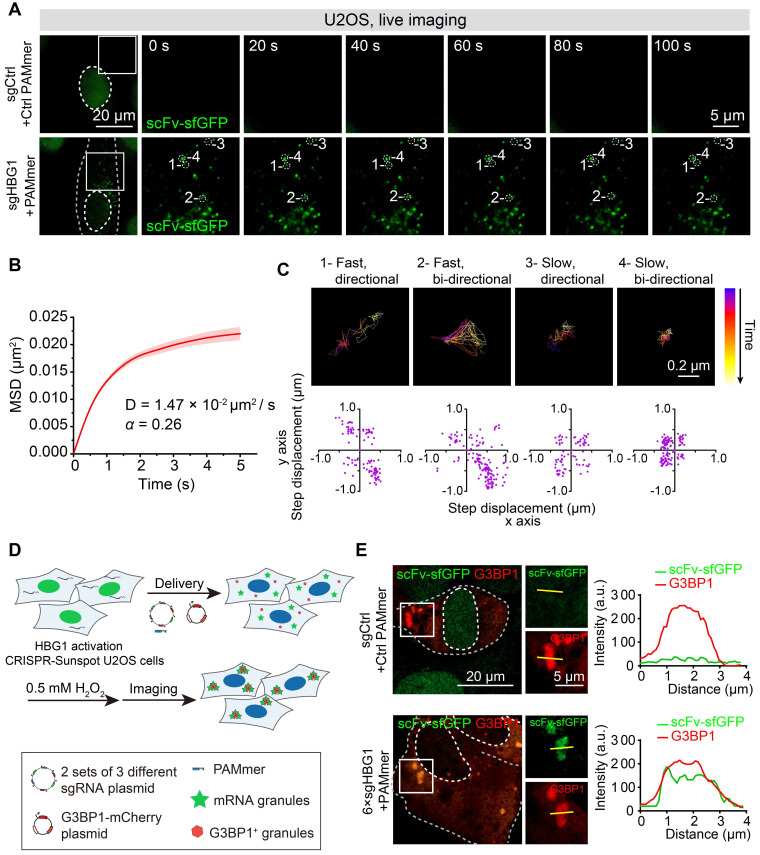
CRISPR/Cas-based mRNA imaging has been developed to labeling of high-abundance mRNAs. A lack of non-genetically encoded mRNA-tagged imaging tools has limited our ability to explore the functional distributions of endogenous low-abundance mRNAs in cells. Here, we developed a CRISPR-Sunspot method based on the SunTag signal amplification system that allows efficient imaging of low-abundance mRNAs with CRISPR/Cas9. Methods: We created a stable TRE3G-dCas9-EGFP cell line and generated an Inducible dCas9-EGFP imaging system for assessment of two factors, sgRNA and dCas9, which influence imaging quality. Based on SunTag system, we established a CRISPR-Sunspot imaging system for amplifying signals from single-molecule mRNA in live cells. CRISPR-Sunspot was used to track co-localization of Camk2a mRNA with regulatory protein Xlr3b in neurons. CRISPR-Sunspot combined with CRISPRa was used to determine elevated mRNA molecules. Results: Our results showed that manipulating the expression of fluorescent proteins and sgRNA increased the efficiency of RNA imaging in cells. CRISPR-Sunspot could target endogenous mRNAs in the cytoplasm and amplified signals from single-molecule mRNA. Furthermore, CRISPR-Sunspot was also applied to visualize mRNA distributions with its regulating proteins in neurons. CRISPR-Sunspot detected the co-localization of Camk2a mRNA with overexpressed Xlr3b proteins in the neuronal dendrites. Moreover, we also manipulated CRISPR-Sunspot to detect transcriptional activation of target gene such as HBG1 in live cells. Conclusion: Our findings suggest that CRISPR-Sunspot is a novel applicable imaging tool for visualizing the distributions of low-abundance mRNAs in cells. This study provides a novel strategy to unravel the molecular mechanisms of diseases caused by aberrant mRNA molecules.

Keywords: CRISPR/Cas9; imaging; mRNA; neuron; transcriptional activation.


Conflict of interest statement

Competing Interests: The authors have declared that no competing interest exists.

Figures

Figure 1
Figure 1
The schematic diagram for Suntag-mediated single molecule RNA snapshot method (CRISPR-Sunspot). For CRISPR-Sunspot, the imaging components, dCas9-24 × GCN_v4 and scFv-sfGFP proteins with NLSs were expressed under the Tet-on system for inducible control. With the guide of sgRNA and PAMmer targeting mRNA, fluorescent proteins could be recruited to single-molecule mRNA for signal amplification. In combination with CRISPR activation (CRISPRa), CRISPR-Sunspot could selectively activate transcription and illuminate the produced target mRNA molecules, simultaneously.
Figure 2
Figure 2
Tandem sgRNA expression cassettes for imaging of ACTB or GAPDH mRNA in the dCas9-EGFP imaging system. (A) Workflow for the dCas9-EGFP imaging system. Stable CMV-dCas9-EGFP U2OS cells were transfected with sgRNAs and PAMmers for subsequent mRNA imaging. (B) PiggyBac (PB) vector maps for constructing stable CMV-dCas9-EGFP U2OS cells. (C) Diagram of the expression vectors for sgRNA; 3 × or 6 × sgRNAs were co-expressed in one vector. The sgRNA targeting ACTB mRNA was constitutively transcribed from the human U6 polymerase III promoters, and mCherry, which was used to label the transfected cells, was under the control of the CMV promoter. (D) dCas9-EGFP imaging of ACTB mRNA in stable CMV-dCas9-EGFP U2OS cells using different sets of sgRNAs with or without PAMmers. The gray dotted lines delineate the cellular boundaries, and the white dotted lines delineate the cellular nuclei. Each inset (right panel) shows a surface plot representing a two-dimensional graph of the intensity of dCas9-EGFP. Scale bars, 20 µm. (E) Schematic diagram for the calculation of fluorescence ratio of cytoplasmic-to-nuclear (ratio of C/N). (F) Quantification of the EGFP intensity for labeling of ACTB mRNA based on the ratio of C/N (n = 104, 90, 96, 96 cells). (G) dCas9-EGFP imaging of GAPDH mRNA in stable CMV-dCas9-EGFP U2OS cells using different sets of sgRNAs with or without PAMmers. Scale bars, 20 µm. (H) Quantification of the EGFP intensity for labeling of GAPDH mRNA based on the ratio of C/N (n = 88, 98, 121, 110 cells). The data are displayed as the mean ± S.E.M. An unpaired t test was used. **P < 0.01, ***P < 0.001.
Figure 3
Figure 3
Inducible dCas9-EGFP imaging system and tandem sgRNA expression cassettes for mRNA imaging. (A) Diagram of the expression vectors for the Inducible dCas9-EGFP imaging system. The expression of dCas9 fused with two NLSs and EGFP was under the control of the TRE3G promoter. This same plasmid contained the rtTA expression cassette under the control of CMV promoter. (B) dCas9-EGFP (green) was expressed under the TRE3G promoter in the presence of different concentration of doxycycline. Scale bars, 50 µm. (C) Representative images of dCas9-EGFP expression driven by the CMV or TRE3G promoter. Each inset (right panel) shows a surface plot representing a two-dimensional graph of the intensity of dCas9-EGFP. Scale bars, 20 µm. (D) mRNA levels of dCas9-EGFP (normalized to dCas9-EGFP expression driven by the TRE3G promoter without doxycycline incubation) in U2OS cells as quantified by RT-qPCR (n = 3). (E) Representative images of GAPDH mRNA observed in stable TRE3G-dCas9-EGFP U2OS cells transfected with sgRNAs or PAMmers. dCas9-EGFP (green), mCherry reporter (red) localization, and nuclei (DAPI, blue) are visible in U2OS cells. The gray dotted lines delineate the cellular boundaries, and the white dotted lines delineate the cellular nuclei. Each inset (right panel) shows a surface plot representing a two-dimensional graph of the intensity of dCas9-EGFP. Scale bars, 20 µm. (F) Quantification of the EGFP intensity for labeling of GAPDH mRNA based on the ratio of C/N (n = 126, 102, 99 cells). The data are displayed as the mean ± S.E.M. One-way ANOVA with Dunnett's multiple comparisons test (D) and an unpaired t test (F) were used. *P < 0.05, ***P < 0.001.
Figure 4
Figure 4
CRISPR-Sunspot system for imaging of endogenous mRNAs. (A) Lentiviral vector maps for CRISPR-Sunspot. The expression of dCas9 fused with an HA tag and two NLSs followed by peptide epitopes that contained 24 × GCN_v4, was under the control of TRE3G promoter. scFv fused with sfGFP was expressed under the TRE3G promoter. The reverse tetracycline-controlled transactivator (rtTA) was constitutively expressed via the CMV promoter. (B) Workflow for CRISPR-Sunspot. U2OS cells were infected with TRE3G-dCas9-24 × GCN_v4 lentivirus to construct stable cell lines. Stable TRE3G-dCas9-24 × GCN_v4 U2OS cells were infected with scFv-sfGFP lentivirus to construct stable CRISPR-Sunspot U2OS cells. Next, 2 sets of 3 different sgRNA plasmid and PAMmers were transfected into cells for subsequent single-molecule mRNA imaging in the cytoplasm. (C) Schematic diagram showing CRISPR-Sunspot imaging strategies with three target sites in one mRNA. Fluorescence signal amplification was performed with the SunTag system. (D) Representative images of HBS1L mRNA labeling using Inducible dCas9-EGFP imaging system. Scale bars, 20 µm and 5 µm (right panel). (E) Representative images of HBS1L mRNA labeling using the CRISPR-Sunspot system. CRISPR-Sunspot produced a pattern of scattered puncta. Scale bars, 20 µm and 5 µm (right panel). (F) Schematic diagram for the calculation of signal-to-noise ratio (SNR). (G) Quantification of the SNR for the two systems in D and E (n = 99, 92, 126, 92 cells). The data are displayed as the mean ± S.E.M. One-way ANOVA with Dunnett's multiple comparisons test was used. ***P < 0.001, n.s. not significant.
Figure 5
Figure 5
The correlation between the signals of CRISPR-Sunspot and FISH for HBS1L mRNA. (A) smFISH confirms HBS1L mRNA signals labeling by the CRISPR-Sunspot system in stable CRISPR-Sunspot U2OS cells. Plots of the arbitrary units (a.u.) along the line indicated the fluorescence intensity in the high-magnification images. Scale bars, 20 µm and 5 µm (lower panel). (B) Co-localization analysis between scFv-sfGFP targeting HBS1L mRNA with smFISH labeling of HBS1L mRNA, quantified by Pearson's correlation. n = 48 cells. (C) Schematic diagram of the single nucleotide mismatch in mutant sgHBS1L. (D) Representative images of CRISPR-Sunspot labeling of HBS1L mRNA with mutant sgRNAs containing single nucleotide mismatch. Original represents unmutated sgRNA. Scale bars, 20 µm. (E) The ratio of C/N statistics showing the effects of mutant sgHBS1L on CRISPR-Sunspot imaging efficiency. n = 48, 32, 32, 72, 74, 72, 62, 42 cells. The data are displayed as the mean ± S.E.M. An unpaired t test was used. *P < 0.05, ***P < 0.001, n.s. versus original sgRNA.
Figure 6
Figure 6
Imaging of endogenous mRNAs in live neurons with CRISPR-Sunspot. (A) Vector maps for CRISPR-Sunspot imaging Camk2a mRNA in primary neurons. dCas9-24 × GCN_v4, scFv-sfGFP, and sgCamk2a with PAMmer to examine the distribution of Camk2a mRNA in neurons. (B) Diagram of the localization of Camk2a mRNA and Xlr3b protein in primary neurons. (C) Representative images of Camk2a mRNA labeling using the CRISPR-Sunspot system or Inducible dCas9-EGFP imaging system in neurons. Scale bars, 20 µm and 5 µm (lower panel). Confocal images showed Camk2a mRNA in dendrites (indicated by sfGFP). (D) smFISH confirms Camk2a mRNA signals labeled by the CRISPR-Sunspot system in neurons. Plots of the arbitrary units (a.u.) along the dendrites indicated the fluorescence intensity in the high-magnification images. Scale bars, 10 µm. (E) Time-lapse images of scFv-sfGFP labeling of Camk2a mRNA in a dendrite of a cultured neuron at day 8 in vitro. Granules moved in both anterograde (yellow arrowhead) and retrograde (white arrowhead) directions. Scale bars, 10 µm. Representative kymograph indicated the movement of scFv-sfGFP labeling of Camk2a mRNA in a proximal dendrite. Scale bars, 10 µm (x-axis) and 10 s (y-axis). The movement of granules was shown in anterograde, retrograde, and bidirectional directions, or stationary state. Scale bars, 10 µm. See also Video S1 and S2.
Figure 7
Figure 7
The co-localization of endogenous Camk2a mRNA and Xlr3b protein in neurons revealed by CRISPR-Sunspot. (A) Vector maps for CRISPR-Sunspot targeting Camk2a mRNA and Xlr3b protein overexpressing in primary neurons. Xlr3b proteins were overexpressed using the Xlr3b-Flag-scFv-Myc vector, which contains an Xlr3b expression cassette. (B) Schematic plots showing the components required for Camk2a mRNA and Xlr3b protein imaging in primary cultured neurons. (C) Confocal images showing co-localization of Camk2a mRNA (indicated by Myc) with Xlr3b protein (indicated by Flag) and MAP2 (a neuron marker) in neurons at day 8 in vitro. The high-magnification images in the bottom panels are enlarged from the corresponding boxed areas. Flag-positive and Myc-negative puncta in dendrites are indicated with yellow arrowheads, and Flag and Myc double-positive puncta in dendrites are indicated with white arrowheads. Plots of the arbitrary units (a.u.) along the dendrites indicated the fluorescence intensity in the high-magnification images. Scale bars, 20 µm and 5 µm (lower panel). (D) Confocal images showing co-localization of Camk2a mRNA (indicated by Myc) with Xlr3b protein (indicated by Flag) and dCas9 protein (indicated by HA) in neurons at day 8 in vitro. The images in the bottom panels are enlarged from the corresponding boxed areas. Flag-positive and both Myc- and HA-negative puncta in dendrites are indicated with yellow arrowheads, while Flag, Myc and HA triple-positive puncta in dendrites are indicated with white arrowheads. Plots of the arbitrary units (a.u.) along the dendrites indicated the fluorescence intensity in the high-magnification images. Scale bars, 20 µm and 5 µm (lower panel).
Figure 8
Figure 8
CRISPR-Sunspot in combination with SunTag activation system for gene activation and mRNA imaging. (A) Lentiviral vector maps for HBG1 activation and mRNA imaging. Workflow of CRISPR-Sunspot system for imaging activated HBG1 mRNA. Stable TRE3G-dCas9-24 × GCN_v4 U2OS cells were infected with scFv-sfGFP-VP64 lentivirus. The cells were then transfected with 2 sets of 3 different sgRNA plasmid with PAMmers targeting HBG1 mRNA for subsequent imaging. (B) Representative images of HBG1 mRNA labeling using the CRISPR-Sunspot system. Scale bars, 20 µm and 5 µm (right panel). The first group (i) showed the representative images of non-activation cell lines (# Ctrl) transfected with the non-targeting control guide RNA with PAMmer. The second group (ii) showed the representative images of non-activation cell lines (# Ctrl) transfected with the sgRNA and PAMmer targeting HBG1 mRNA. The third group (iii) showed the representative images of HBG1 activation cell lines (# 18) transfected with sgRNA and PAMmer targeting HBG1 mRNA. The fourth group (iv) showed the representative images of non-activation cell lines (# Ctrl) transfected by HBG1 overexpression vector and sgRNA with PAMmer targeting HBG1 mRNA. (C) Schematic plots showing the CRISPR-Sunspot system and SunTag-mediated gene activation strategies. (D) SNR of CRISPR-Sunspot labeling of HBG1 mRNA in (B) (n =60, 84, 74, 60 cells). (E) smFISH confirms HBG1 mRNA signals labeling by the CRISPR-Sunspot system in HBG1 activation (by VP64) and HBG1 overexpression (HBG1 OE) U2OS cells. Plots of the arbitrary units (a.u.) along the line indicated the fluorescence intensity in the high-magnification images. Scale bars, 20 µm and 5 µm (right panel). The data are displayed as the mean ± S.E.M. One-way ANOVA with Dunnett's multiple comparisons test was used. *P < 0.05, ***P < 0.001, n.s. not significant.
Figure 9
Figure 9
Tracking mRNA movement and trafficking to stress granules in live cells with CRISPR-Sunspot. (A) CRISPR-Sunspot mediated time-lapse imaging of HBG1 mRNA in live HBG1 activation U2OS cells. See also Video S3 and S4. Scale bars, 20 µm and 5 µm. (B) MSD curves and the Diffusion coefficients of single particles in the cytoplasm analyzed from at least 40 cells. (C) Representative trajectories of four single-particles with different movement modes. Scale bars, 0.2 µm. Scatterplots of the step displacement (δx, δy) of CRISPR-Sunspot labeling of mRNA in 120 s. Puncta were tracked every 1 s. (D) Schematic plots of CRISPR-Sunspot mediated imaging of HBG1 mRNA trafficking to stress granules. (E) Representative images of CRISPR-Sunspot labeling of HBG1 mRNA (green) and stress granules (G3BP1, red) upon hydrogen peroxide (0.5 mM, for 1h) treatments. Scale bars, 20 µm and 5 µm (right panel). Plots of the arbitrary units (a.u.) along the line indicated the fluorescence intensity in the high-magnification images.

References

    1. Wang ET, Taliaferro JM, Lee JA, Sudhakaran IP, Rossoll W, Gross C. et al. Dysregulation of mRNA Localization and Translation in Genetic Disease. J Neurosci. 2016;36:11418–26. - PMC - PubMed
    1. Hurt JA, Silver PA. mRNA nuclear export and human disease. Dis Model Mech. 2008;1:103–8. - PMC - PubMed
    1. Trcek T, Lionnet T, Shroff H, Lehmann R. mRNA quantification using single-molecule FISH in Drosophila embryos. Nat Protoc. 2017;12:1326–48. - PMC - PubMed
    1. Bertrand E, Chartrand P, Schaefer M, Shenoy SM, Singer RH, Long RM. Localization of ASH1 mRNA particles in living yeast. Mol Cell. 1998;2:437–45. - PubMed
    1. Chen B, Gilbert LA, Cimini BA, Schnitzbauer J, Zhang W, Li GW. et al. Dynamic imaging of genomic loci in living human cells by an optimized CRISPR/Cas system. Cell. 2013;155:1479–91. - PMC - PubMed

Publication types

MeSH terms