. 2020 Sep 2;10(24):11080-11091.
doi: 10.7150/thno.49864. eCollection 2020.

Development and interpretation of a pathomics-based model for the prediction of microsatellite instability in Colorectal Cancer

Affiliations

Development and interpretation of a pathomics-based model for the prediction of microsatellite instability in Colorectal Cancer

Rui Cao et al. Theranostics. .

Abstract

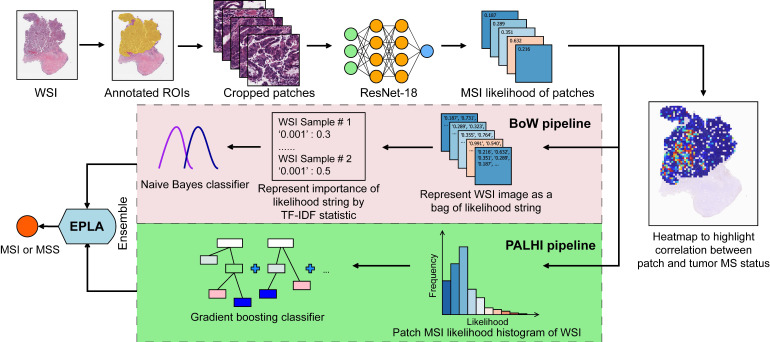
Microsatellite instability (MSI) has been approved as a pan-cancer biomarker for immune checkpoint blockade (ICB) therapy. However, current MSI identification methods are not available for all patients. We proposed an ensemble multiple instance deep learning model to predict microsatellite status based on histopathology images, and interpreted the pathomics-based model with multi-omics correlation. Methods: Two cohorts of patients were collected, including 429 from The Cancer Genome Atlas (TCGA-COAD) and 785 from an Asian colorectal cancer (CRC) cohort (Asian-CRC). We established the pathomics model, named Ensembled Patch Likelihood Aggregation (EPLA), based on two consecutive stages: patch-level prediction and WSI-level prediction. The initial model was developed and validated in TCGA-COAD, and then generalized in Asian-CRC through transfer learning. The pathological signatures extracted from the model were analyzed with genomic and transcriptomic profiles for model interpretation. Results: The EPLA model achieved an area-under-the-curve (AUC) of 0.8848 (95% CI: 0.8185-0.9512) in the TCGA-COAD test set and an AUC of 0.8504 (95% CI: 0.7591-0.9323) in the external validation set Asian-CRC after transfer learning. Notably, EPLA captured the relationship between pathological phenotype of poor differentiation and MSI (P < 0.001). Furthermore, the five pathological imaging signatures identified from the EPLA model were associated with mutation burden and DNA damage repair related genotype in the genomic profiles, and antitumor immunity activated pathway in the transcriptomic profiles. Conclusions: Our pathomics-based deep learning model can effectively predict MSI from histopathology images and is transferable to a new patient cohort. The interpretability of our model by association with pathological, genomic and transcriptomic phenotypes lays the foundation for prospective clinical trials of the application of this artificial intelligence (AI) platform in ICB therapy.

Keywords: colorectal cancer; ensembled patch likelihood aggregation (EPLA); microsatellite instability; multi-omics; pathomics.


Conflict of interest statement

Competing Interests: F.Y., Y.Z., W.J.L., T.X.W., W.J.H., W.M.T and J.H.Y. are employed by Tencent and W.J.C. is employed by Shanghai Tongshu Biotechnology Co., Ltd.

Figures

Figure 1
Figure 1
Overview of the Ensemble Patch Likelihood Aggregation (EPLA) model. A whole slide image (WSI) of each patient was obtained and annotated to highlight the regions of carcinoma (ROIs). Then, patches were tiled from ROIs, and the MSI likelihood of each patch was predicted by ResNet-18, during which a heat map was shown to visualize the patch-level prediction. Then, PALHI and BoW pipelines integrated the multiple patch-level MSI likelihoods into a WSI-level MSI prediction, respectively. Finally, ensemble learning combined the results of the two pipelines and made the final prediction of the MS status.
Figure 2
Figure 2
Validation of the EPLA and comparison with DL-based MV in the TCGA cohort. (A) Representative heat maps of MSI and MSS cases at the patch-level prediction stage. Color bars show the MSI likelihood of each patch. (B) Receiver operating characteristic (ROC) curve of EPLA. The P value was calculated by the Wald test. (C) Summary of EPLA and DL-based MV. DL-based MV was re-implemented from a voting-based model in Ref.20. The last line of the table summarizes the performance of the original DL-based MV model. (D) Correlation of the degree of differentiation with EPLA-predicted MS status and MSIsensor score. DL-based MV, deep-learning based majority voting; EPLA, Ensemble Patch Likelihood Aggregation. Significance values: *** P < 0.001.
Figure 3
Figure 3
Generalization performance of the EPLA in an Asian cohort. (A) Summary of the performance of EPLA in Asian-CRC with or without transfer learning. When using transfer learning, 10% of cases from Asian-CRC were used for model fine-tuning. (B) The Receiver operating characteristic (ROC) curve of EPLA in the Asian-CRC after transfer learning. (C) ROCAUCs of the model in Asian-CRC with increasing proportions of cases for transfer learning. EPLA, Ensemble Patch Likelihood Aggregation; CRC, colorectal cancer.
Figure 4
Figure 4
Identification and genomic correlation analysis of top pathological signatures. (A) Importance ranking of the top ten pathological signatures extracted from EPLA. (B) Boxplots of the five pathological signatures between MSI and MSS groups. Significance values: **** P < 0.0001. (C) Heat map with unsupervised clustering showing the correlation between genomic landscape and top pathological signatures in each patient. Each column corresponds to a patient in the TCGA-COAD cohort. All continuous variables are normalized to a range of 0 to 1. EPLA, Ensemble Patch Likelihood Aggregation; FEA, feature; INDEL: insertion-deletion, TMB: tumor mutation burden, MMR: mismatch repair, DDR: DNA damage response and repair, and HRD: homologous recombination deficiency.
Figure 5
Figure 5
Correlation of top pathological signatures with WGCNA-identified modules and anti-tumor immunity. (A) Weighted gene co-expression network analysis (WGCNA) based on gene expression data identified gene modules with highly synergistic changes. The biological functions of these modules were annotated using Gene Ontology (GO) analyses. (B) Heat map of correlation coefficients (corresponding P values in brackets) for each pair of annotated modules and top pathological signatures. (C) Significantly-enriched GO terms of ME8, ME12 and ME13. The dotted line indicates the level with an adjusted P value of 0.05. Correlation of cytolytic activity (CYT) (D) and CD8+ T-effector genes (E) with MS status and top pathological signatures. The heat maps show Spearman's rank correlation coefficients, where a transition from red to blue represents positive to negative correlations. Significance values in boxplots: **** P < 0.0001.

Similar articles

Cited by

References

    1. Boland CR, Goel A. Microsatellite instability in colorectal cancer. Gastroenterology. 2010;138:2073–87.e3. - PMC - PubMed
    1. Lynch HT, de la Chapelle A. Hereditary colorectal cancer. N Engl J Med. 2003;348:919–32. - PubMed
    1. Vilar E, Gruber SB. Microsatellite instability in colorectal cancer-the stable evidence. Nat Rev Clin Oncol. 2010;7:153–62. - PMC - PubMed
    1. Sargent DJ, Marsoni S, Monges G, Thibodeau SN, Labianca R, Hamilton SR. et al. Defective mismatch repair as a predictive marker for lack of efficacy of fluorouracil-based adjuvant therapy in colon cancer. J Clin Oncol. 2010;28:3219–26. - PMC - PubMed
    1. Germano G, Lamba S, Rospo G, Barault L, Magrì A, Maione F. et al. Inactivation of DNA repair triggers neoantigen generation and impairs tumour growth. Nature. 2017;552:116–20. - PubMed

Publication types

MeSH terms

Substances