. 2020 Sep 14;10(24):11324-11338.
doi: 10.7150/thno.47893. eCollection 2020.

Analysis of mesenchymal stem cell proteomes in situ in the ischemic heart

Affiliations

Analysis of mesenchymal stem cell proteomes in situ in the ischemic heart

Dunzheng Han et al. Theranostics. .

Abstract

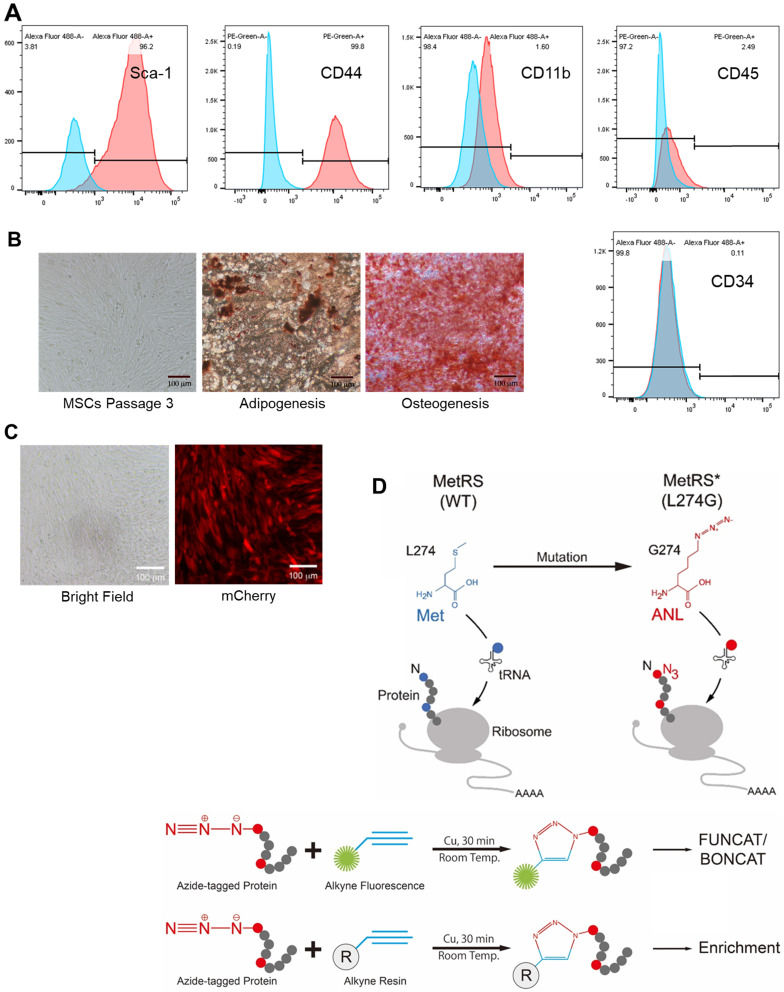
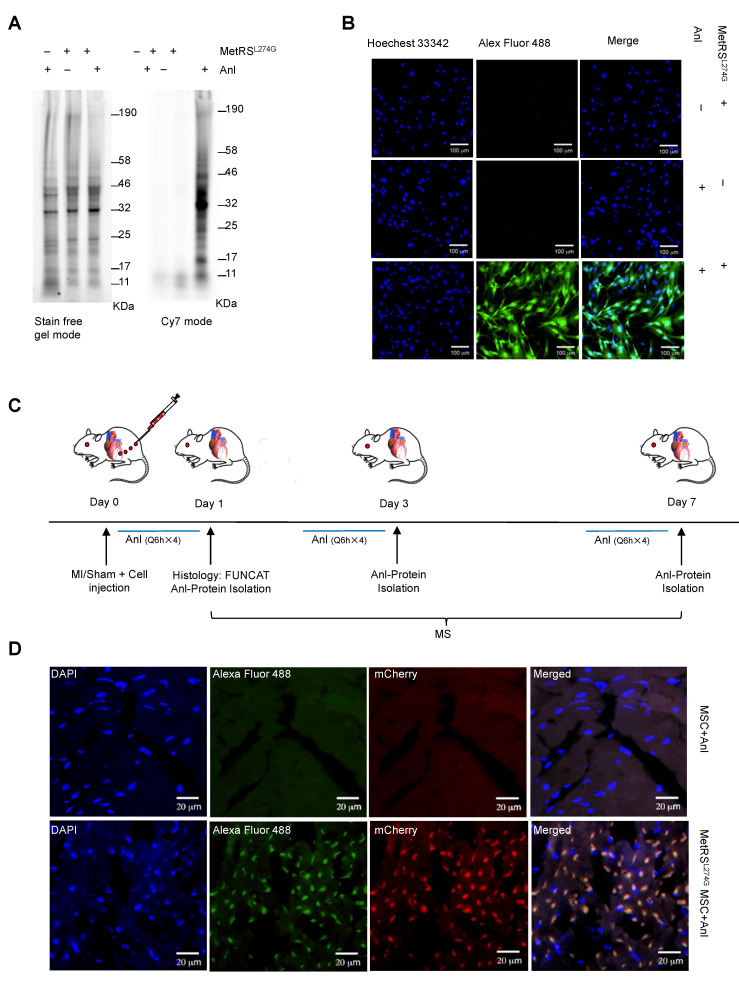
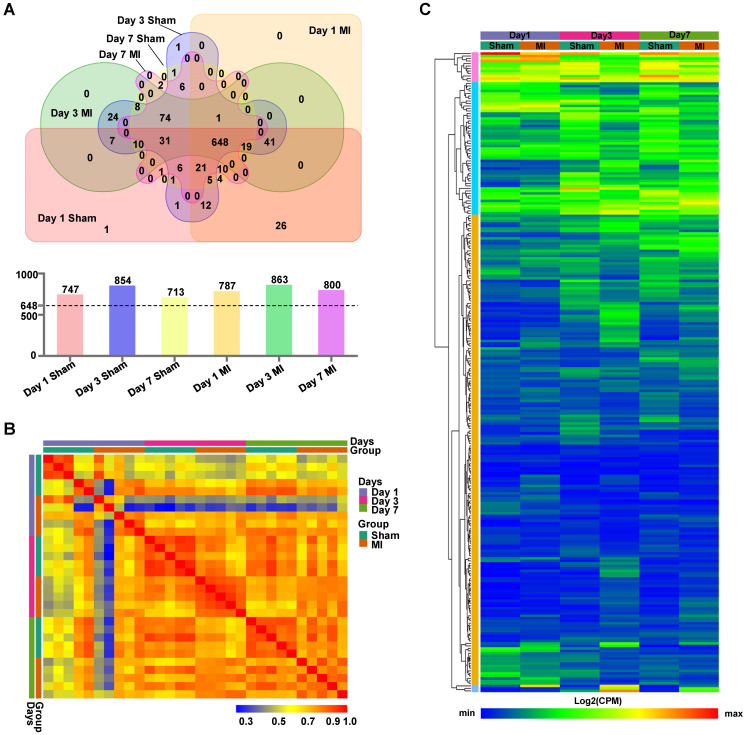
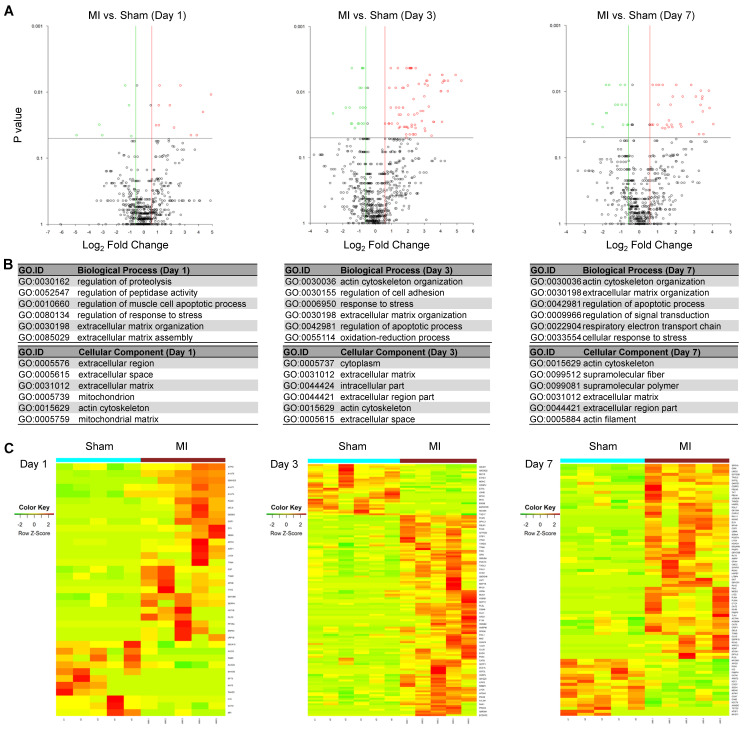
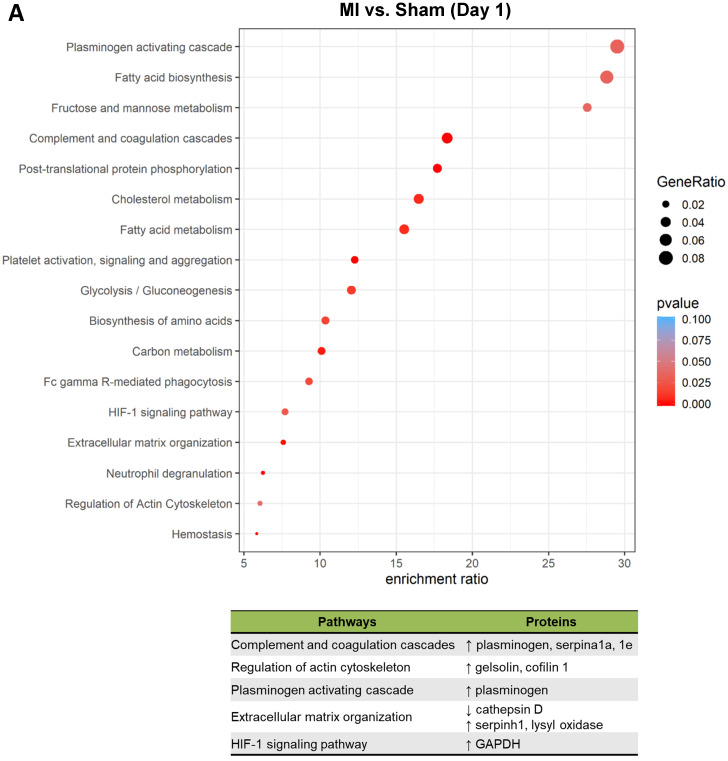
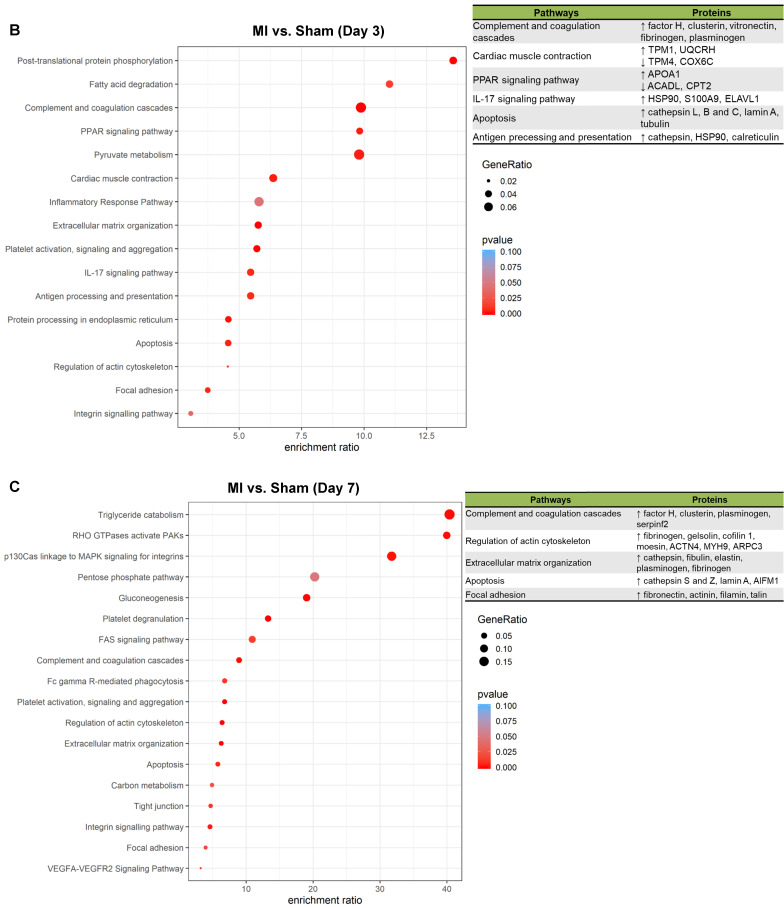
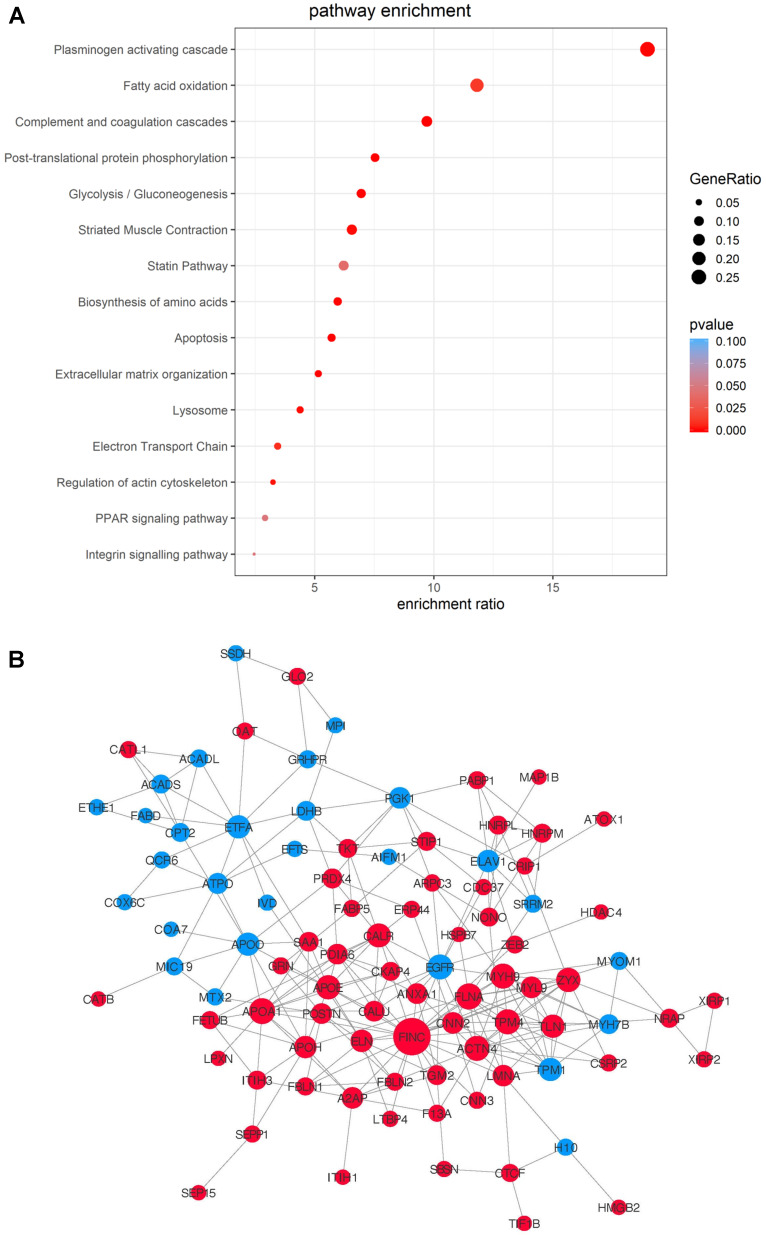
Rationale: Cell therapy for myocardial infarction is promising but largely unsuccessful in part due to a lack of mechanistic understanding. Techniques enabling identification of stem cell-specific proteomes in situ in the injured heart may shed light on how the administered cells respond to the injured microenvironment and exert reparative effects. Objective: To identify the proteomes of the transplanted mesenchymal stem cells (MSCs) in the infarcted myocardium, we sought to target a mutant methionyl-tRNA synthetase (MetRSL274G) in MSCs, which charges azidonorleucine (ANL), a methionine analogue and non-canonical amino acid, to tRNA and subsequently to nascent proteins, permitting isolation of ANL-labeled MSC proteomes from ischemic hearts by ANL-alkyne based click reaction. Methods and Results: Murine MSCs were transduced with lentivirus MetRSL274G and supplemented with ANL; the ANL-tagged nascent proteins were visualized by bio-orthogonal non-canonical amino-acid tagging, spanning all molecular weights and by fluorescent non-canonical amino-acid tagging, displaying strong fluorescent signal. Then, the MetRSL274G-transduced MSCs were administered to the infarcted or Sham heart in mice receiving ANL treatment. The MSC proteomes were isolated from the left ventricular protein lysates by click reaction at days 1, 3, and 7 after cell administration, identified by LC/MS. Among all identified proteins (in Sham and MI hearts, three time-points each), 648 were shared by all 6 groups, accounting for 82±5% of total proteins in each group, and enriched under mitochondrion, extracellular exosomes, oxidation-reduction process and poly(A) RNA binding. Notably, 26, 110 and 65 proteins were significantly up-regulated and 11, 28 and 19 proteins were down-regulated in the infarcted vs. Sham heart at the three time-points, respectively; these proteins are pronounced in the GO terms of extracellular matrix organization, response to stress and regulation of apoptotic process and in the KEGG pathways of complements and coagulation cascades, apoptosis, and regulators of actin cytoskeleton. Conclusions: MetRSL274G expression allows successful identification of MSC-specific nascent proteins in the infarcted hearts, which reflect the functional states, adaptive response, and reparative effects of MSCs that may be leveraged to improve cardiac repair.

Keywords: Methionyl-tRNA synthetase; mass spectrometry; mesenchymal stem cells; myocardial infarction; proteomics.


Conflict of interest statement

Competing Interests: The authors have declared that no competing interest exists.

Figures

Figure 1
Figure 1
Characterization, genetic modification and proteome-labelling strategy of MSCs. (A) FACS analysis of MSCs for cell surface markers. (B) MSCs under a phase-contrast microscope (Left panel) and after differentiation in culture into adipocytes (Middle panel, oil red staining) and osteocytes (Right panel, alizarin red staining). Shown are representatives of three independent experiments. (C) MSCs were infected with lentiviral vector MetRSL274G-mCherry, and the transduced cells were FACS-selected by mCherry expression. (D) Expression of MetRSL274G allows loading of the methionine surrogate azidonorleucine (ANL) onto methionine tRNA, and subsequently ANL incorporation in newly-synthesized proteins (Upper panel). The ANL-tagged proteins are clicked to alkyne-containing dye or resin in the presence of copper, and detected by FUNCAT/BONCAT or enriched for LC-MS (Lower panel).
Figure 2
Figure 2
MetRSL274G expression allows ANL labeling of newly synthesized proteome of MSCs. (A-B) The MetRSL274G-mCherry (+) or control virus (-) transduced MSCs were incubated with ANL (+) or vehicle (-) for 24 h. (A) BONCAT was performed in cell lysates to stain the ANL-incorporated nascent protein using Click-iT protein reaction kit (alkyne-Cy7) and imaged in SDS-PAGE gel in Cy7 mode, with stain-free gel mode as loading control. (B) FUNCAT was performed to visualize MSCs containing ANL-tagged proteins. (C) Workflow for analysis of MSC proteome in situ in the ischemic myocardium. The mice were subjected to MI or Sham surgery and immediate intramyocardial injections of MetRSL274G-mCherry transduced MSCs in the infarct border area, then randomized to receive i.p. injections of ANL (Q6h X 4) at day 0, 2, or 6, and euthanized 24 h later (at day 1, 3, or 7) for histological and biochemical analysis of tissues. n=5-6 mice for each time point in each group. (D) Representative FUNCAT in the MSCs administered in the myocardium for 1 d. Red, mCherry; Green, alkyne-Alexa Fluor 488.
Figure 3
Figure 3
Identification of MSC-specific proteome in the heart. (A) Venn diagram analysis of proteomes in the six experimental groups, Day 1 MI, Day 3 MI, Day 7 MI, Day 1 Sham, Day 3 Sham, and Day 7 Sham, showing numbers of proteins unique to each group or shared by different groups. There were 713 - 863 proteins identified in the six groups (upper panel), and 648 proteins common to all groups account for 77~87% of the total proteins for individual groups (lower panel). (B) Pearson correlations between samples within each group at day 1, day 3 and day 7. (C) Hierarchical clustering of proteins expressed in all groups. Each column corresponds to the mean expression levels of proteins in 5-6 independent biological samples, and each row corresponds to a protein.
Figure 4
Figure 4
Identification of DEPs from the MSCs in MI vs. in Sham heart. (A) Volcano plots showing DEPs from the MSCs in MI vs. in Sham heart at day 1 (left panel), day 3 (middle panel) and day 7 (right panel) after surgery and cell administration. Each point represents the difference of fold-change (X axis, Log2[fold change]) plotted against the level of statistical significance (Y axis, p value). Red dots indicate upregulated proteins, and green dots indicate downregulated proteins. p value was calculated by Mann Whitney U-test, ratio >1.5 or < 0.67. n=5 animals per group. (B) GO analyses of DEPs under the terms of cellular components, biological process. p value was calculated by Mann Whitney U-test, ratio >1.5 or < 0.67. (C) Heatmaps showing DEPs from the MSCs in MI vs. in Sham heart at day 1 (left panel), day 3 (middle panel) and day 7 (right panel). n=5-6 animals per group.
Figure 5
Figure 5
Pathway analysis of DEPs from the MSCs in MI vs. in Sham heart at serial time points. (A-C, upper panels): KEGG enrichment analyses of DEPs from the MSCs in MI vs. in Sham heart at day 1 (A), day 3 (B), and day 7 (C). The most significantly enriched KEGG pathways are illustrated with bubbles, with X axis indicating the enrichment factor (i.e., the ratio of the count of the DEPs observed in a certain pathway vs the count of proteins expected by random chance in the same pathway), Y axis indicating the enriched pathways, bubble size indicating the number of proteins enriched in the corresponding pathway, and bubble color indicating Q value (adjusted p value) of the corresponding pathway. (A-C, lower panels) Individual proteins enriched in the analyses with potential biological effects in MSC reparative function are listed under corresponding pathways.
Figure 5
Figure 5
Pathway analysis of DEPs from the MSCs in MI vs. in Sham heart at serial time points. (A-C, upper panels): KEGG enrichment analyses of DEPs from the MSCs in MI vs. in Sham heart at day 1 (A), day 3 (B), and day 7 (C). The most significantly enriched KEGG pathways are illustrated with bubbles, with X axis indicating the enrichment factor (i.e., the ratio of the count of the DEPs observed in a certain pathway vs the count of proteins expected by random chance in the same pathway), Y axis indicating the enriched pathways, bubble size indicating the number of proteins enriched in the corresponding pathway, and bubble color indicating Q value (adjusted p value) of the corresponding pathway. (A-C, lower panels) Individual proteins enriched in the analyses with potential biological effects in MSC reparative function are listed under corresponding pathways.
Figure 6
Figure 6
Integrated analysis of DEPs from the MSCs in MI vs. in Sham heart with combined time points. Data of the three time-points within each treatment group, MI vs. Sham, were combined for differential MSC proteome analyses. (A) Pathway enrichment analyses. (B) The protein-protein interaction network analyses with nodes indicating individual proteins, edges indicating interactions between connecting proteins. The degree of a node indicates the number of connections to other nodes (i.e., the potential importance as protein-protein interaction hubs), edge thickness indicates the degree of interactions, and the color of nodes denotes up (red) or down (blue) regulation.

Similar articles

Cited by

References

    1. Williams AR, Hare JM. Mesenchymal stem cells: biology, pathophysiology, translational findings, and therapeutic implications for cardiac disease. Circ Res. 2011;109:923–40. - PMC - PubMed
    1. Tao B, Cui M, Wang C, Ma S, Wu F, Yi F. et al. Percutaneous intramyocardial delivery of mesenchymal stem cells induces superior improvement in regional left ventricular function compared with bone marrow mononuclear cells in porcine myocardial infarcted heart. Theranostics. 2015;5:196–205. - PMC - PubMed
    1. Yun CW, Lee SH. Enhancement of Functionality and Therapeutic Efficacy of Cell-Based Therapy Using Mesenchymal Stem Cells for Cardiovascular Disease. Int J Mol Sci. 2019. 20. - PMC - PubMed
    1. Prabhu SD, Frangogiannis NG. The Biological Basis for Cardiac Repair After Myocardial Infarction: From Inflammation to Fibrosis. Circ Res. 2016;119:91–112. - PMC - PubMed
    1. Traverse JH, Henry TD, Pepine CJ, Willerson JT, Zhao DX, Ellis SG. et al. Effect of the use and timing of bone marrow mononuclear cell delivery on left ventricular function after acute myocardial infarction: the TIME randomized trial. JAMA. 2012;308:2380–9. - PMC - PubMed

Publication types

MeSH terms