Methylation-independent CRIP1 expression is a potential biomarker affecting prognosis in cytogenetically normal acute myeloid leukemia
- PMID: 33042393
- PMCID: PMC7540098
Methylation-independent CRIP1 expression is a potential biomarker affecting prognosis in cytogenetically normal acute myeloid leukemia
Abstract
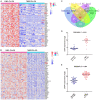
Abnormal expression of CRIP1 has been identified in numerous solid tumors. However, CRIP1 expression and its regulation are little known in acute myeloid leukemia (AML). The purpose of this study was to evaluate the expression and regulation of CRIP1 and the clinical implications of CRIP1 aberration in AML. Real-time quantitative PCR was carried out to detect the level of CRIP1 expression in 138 AML patients and 38 controls. CRIP1 methylation was detected by methylation-specific PCR and bisulfite sequencing PCR. Five public available AML datasets from The Cancer Genome Atlas (TCGA) and Gene Expression Omnibus (GEO) were further analyzed. The level of CRIP1 expression was up-regulated in AML patients compared with controls (P = 0.045). CRIP1 high patients had a significantly lower complete remission (CR) rate than CRIP1 low patients (P = 0.020). CRIP1 high group had a shorter overall survival (OS) and leukemia-free survival (LFS) than CRIP1 low group in cytogenetically normal AML (CN-AML) patients (P = 0.007 and 0.012, respectively). Multivariate analysis further confirmed that high CRIP1 expression was an independent risk factor for LFS in CN-AML patients (P = 0.005). However, we found that CRIP1 expression was not associated with the status of its promoter, which was nearly fully unmethylated both in controls and AML patients. Furthermore, our results were validated using the published GEO datasets and TCGA datasets. Our findings suggest that high CRIP1 expression is independently related with unfavorable prognosis in CN-AML.
Keywords: AML; CRIP1; biomarker; methylation; prognosis.
AJTR Copyright © 2020.
Conflict of interest statement
None.
Figures


Similar articles
-
Methylation-independent CHFR expression is a potential biomarker affecting prognosis in acute myeloid leukemia.J Cell Physiol. 2018 Jun;233(6):4707-4714. doi: 10.1002/jcp.26253. Epub 2018 Jan 15. J Cell Physiol. 2018. PMID: 29115660
-
High expression of malic enzyme 1 predicts adverse prognosis in patients with cytogenetically normal acute myeloid leukaemia and promotes leukaemogenesis through the IL-6/JAK2/STAT3 pathways.Ther Adv Hematol. 2024 Nov 27;15:20406207241301948. doi: 10.1177/20406207241301948. eCollection 2024. Ther Adv Hematol. 2024. PMID: 39610460 Free PMC article.
-
Comprehensive Analysis of CRIP1 Expression in Acute Myeloid Leukemia.Front Genet. 2022 Jul 22;13:923568. doi: 10.3389/fgene.2022.923568. eCollection 2022. Front Genet. 2022. PMID: 35938037 Free PMC article.
-
The prognostic value of RASGEF1A RNA expression and DNA methylation in cytogenetically normal acute myeloid leukemia.Cancer Biomark. 2023;36(2):103-116. doi: 10.3233/CBM-210407. Cancer Biomark. 2023. PMID: 36404533
-
Epigenetic dysregulation of NKD2 is a valuable predictor assessing treatment outcome in acute myeloid leukemia.J Cancer. 2017 Feb 11;8(3):460-468. doi: 10.7150/jca.16914. eCollection 2017. J Cancer. 2017. PMID: 28261348 Free PMC article.
Cited by
-
Molecular subtyping of acute myeloid leukemia through ferroptosis signatures predicts prognosis and deciphers the immune microenvironment.Front Cell Dev Biol. 2023 Aug 24;11:1207642. doi: 10.3389/fcell.2023.1207642. eCollection 2023. Front Cell Dev Biol. 2023. PMID: 37691822 Free PMC article.
-
TGFβ Inhibitor A83-01 Enhances Murine HSPC Expansion for Gene Therapy.Cells. 2023 Jul 31;12(15):1978. doi: 10.3390/cells12151978. Cells. 2023. PMID: 37566057 Free PMC article.
-
Endogenous IL-1 receptor antagonist restricts healthy and malignant myeloproliferation.Nat Commun. 2023 Jan 3;14(1):12. doi: 10.1038/s41467-022-35700-9. Nat Commun. 2023. PMID: 36596811 Free PMC article.
-
Cysteine-rich intestinal protein family: structural overview, functional diversity, and roles in human disease.Cell Death Discov. 2025 Mar 21;11(1):114. doi: 10.1038/s41420-025-02395-y. Cell Death Discov. 2025. PMID: 40118853 Free PMC article. Review.
References
-
- Döhner H, Weisdorf DJ, Bloomfield CD. Acute myeloid leukemia. N Engl J Med. 2015;373:1136–1152. - PubMed
-
- Byrd JC, Mrózek K, Dodge RK, Carroll AJ, Edwards CG, Arthur DC, Pettenati MJ, Patil SR, Rao KW, Watson MS, Koduru PR, Moore JO, Stone RM, Mayer RJ, Feldman EJ, Davey FR, Schiffer CA, Larson RA, Bloomfield CD Cancer and Leukemia Group B (CALGB 8461) Pretreatment cytogenetic abnormalities are predictive of induction success, cumulative incidence of relapse, and overall survival in adult patients with de novo acute myeloid leukemia: results from Cancer and Leukemia Group B (CALGB 8461) Blood. 2002;100:4325–4336. - PubMed
-
- Grimwade D, Walker H, Oliver F, Wheatley K, Harrison C, Harrison G, Rees J, Hann I, Stevens R, Burnett A, Goldstone A. The importance of diagnostic cytogenetics on outcome in AML: analysis of 1,612 patients entered into the MRC AML 10 trial. The medical research council adult and children’s leukaemia working parties. Blood. 1998;92:2322–2333. - PubMed
-
- Mrozek K, Heerema NA, Bloomfield CD. Cytogenetics in acute leukemia. Blood. 2004;18:115–136. - PubMed
Publication types
LinkOut - more resources
Full Text Sources
Miscellaneous
