. 2020 Sep 15;12(9):5064-5079.
eCollection 2020.

Intramuscular accumulation of pentadecanoic acid activates AKT1 to phosphorylate NCOR1 and triggers FOXM1-mediated apoptosis in the pathogenesis of sarcopenia

Affiliations

Intramuscular accumulation of pentadecanoic acid activates AKT1 to phosphorylate NCOR1 and triggers FOXM1-mediated apoptosis in the pathogenesis of sarcopenia

Fa-Xiu Chen et al. Am J Transl Res. .

Abstract

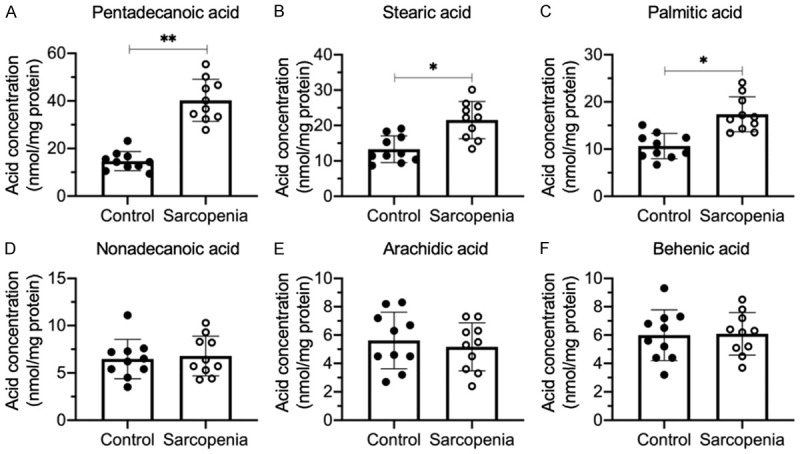
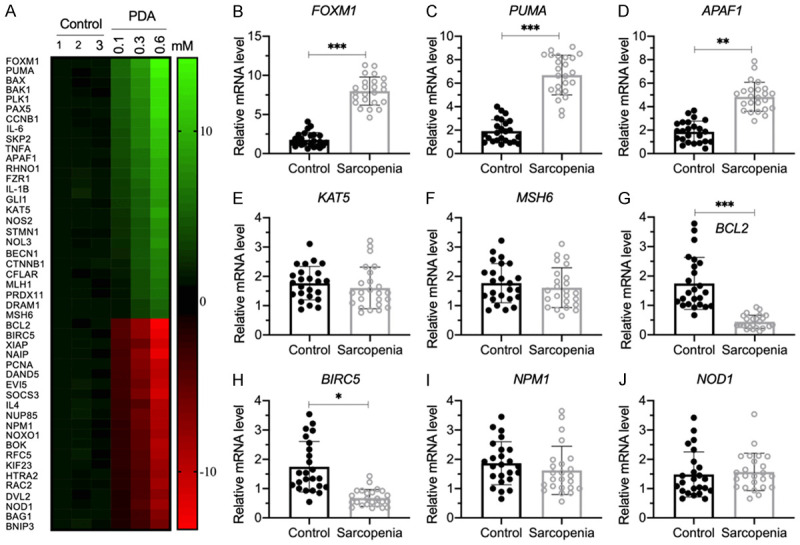
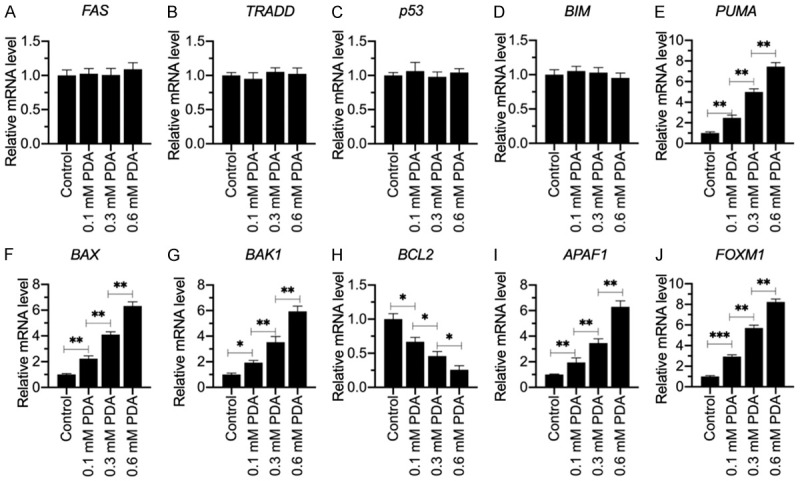
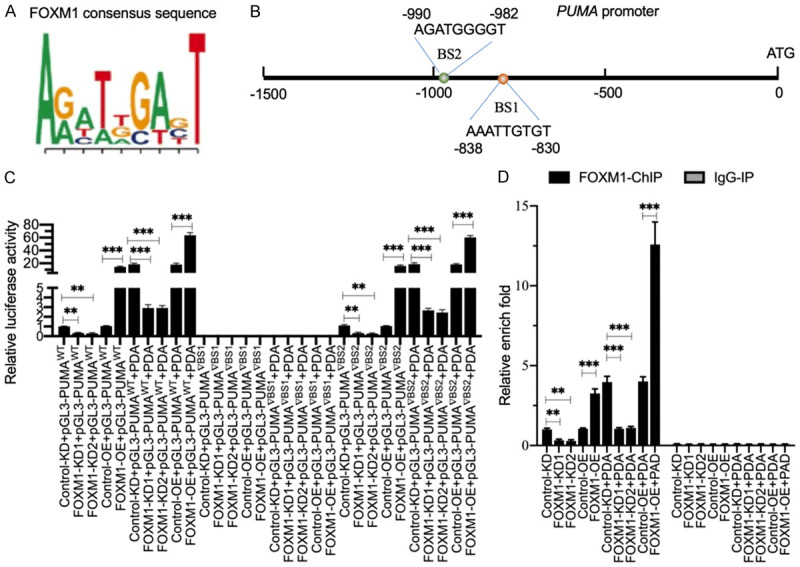
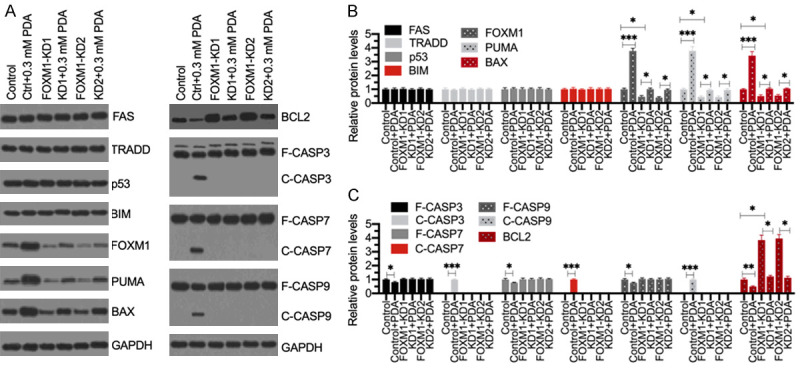
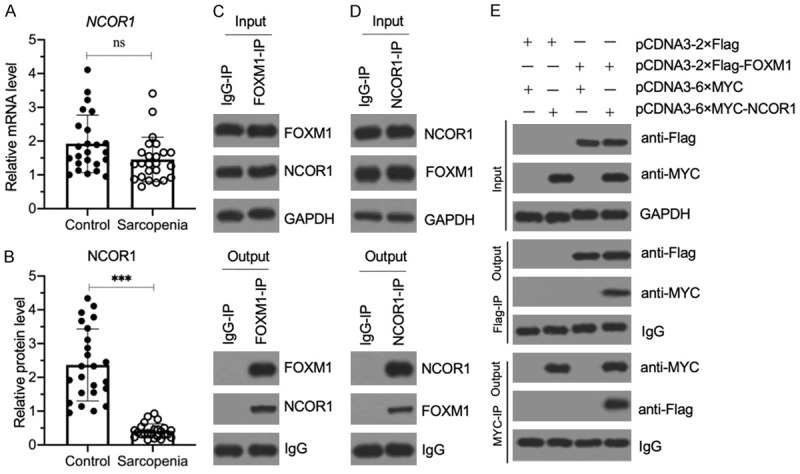
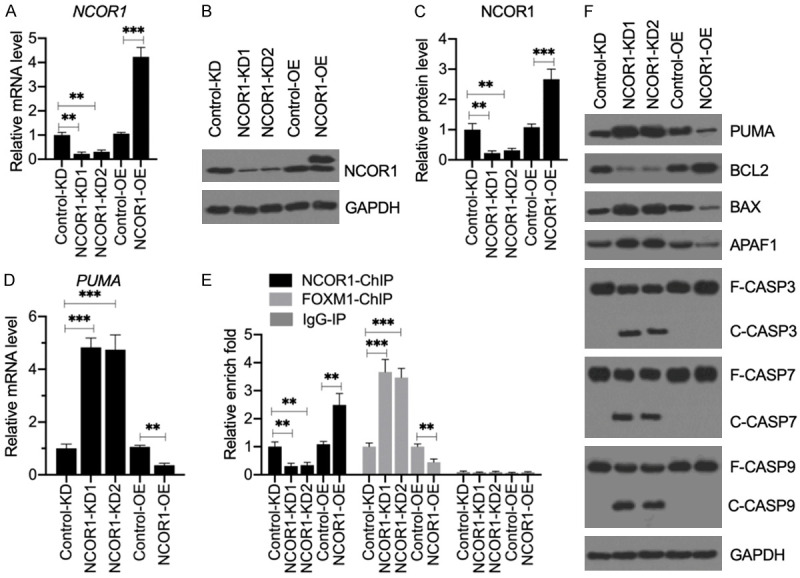
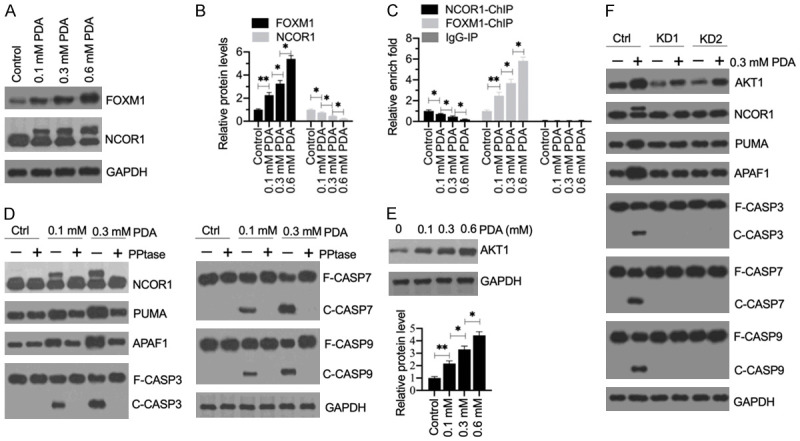
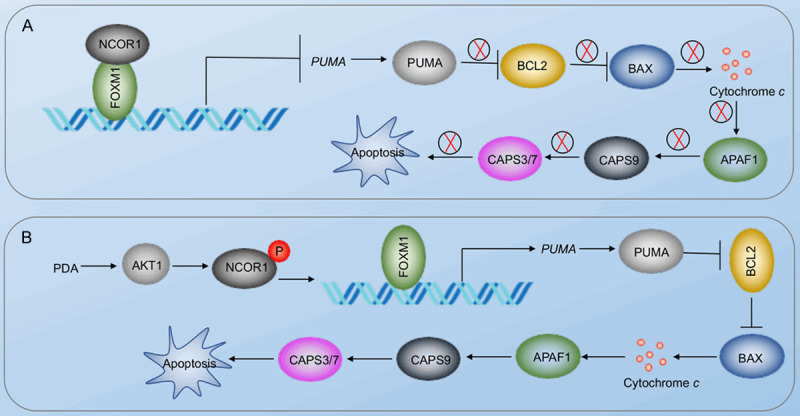
Sarcopenia is an age-associated disorder that results in skeletal muscle loss. Apoptosis and inflammation are the two major contributors to sarcopenia. Emerging evidence has shown that long-chain fatty acids (LCFAs) are implicated in the muscles of sarcopenic animal models. However, it is unknown whether LCFAs are correlated with apoptosis or inflammation in the pathogenesis of sarcopenia. Herein, we found that pentadecanoic acid (PDA), a C15 LCFA, was significantly accumulated in human sarcopenic muscles. In vitro PDA treatment could dose-dependently induce the expression of the transcription factor FOXM1 (forkhead box M1) and several proapoptotic genes, such as PUMA (p53-upregulated modulator of apoptosis), BAX (B-cell/lymphoma 2-associated X) and APAF1 (apoptotic peptidase activating factor 1), thereby causing apoptosis. Mechanically, PDA activated AKT1 (AKT serine/threonine kinase 1) to phosphorylate NCOR1 (nuclear receptor corepressor 1). The phosphorylated NCOR1 disassociated from the NCOR1-FOXM1 transcriptional complex and could not repress FOXM1-mediated transcription, leading to the induction of PUMA. The activated PUMA further triggered downstream apoptotic signaling, including activation of the BAX, APAF1 and caspase cascades, leading to the occurrence of apoptosis. Alkaline phosphatase or knockdown of AKT1 in vitro reversed the FOXM1-mediated apoptotic signaling. Collectively, our results provide new evidence that LCFAs are involved in the pathogenesis of sarcopenia by activating apoptotic signaling. Attempts to decrease the intake of PDA-containing foods or blocking AKT1 may improve the symptoms of sarcopenia.

Keywords: AKT1; FOXM1; NCOR1; Sarcopenia; apoptosis; pentadecanoic acid.


Conflict of interest statement

None.

Figures

Figure 1
Figure 1
The accumulation of LCFAs in the quadriceps muscles from sarcopenia patients. LCFAs were extracted from non-sarcopenic (Control) and sarcopenic tissues (n=10 for each group). The LCFA concentrations were measured in the hexane layer mixture using GC-MS and included PDA (A), stearic acid (B), palmitic acid (C), nonadecanoic acid (D), arachidic acid (E) and behenic acid (F). Statistical significance was denoted by * for P<0.05 and *** for P<0.001.
Figure 2
Figure 2
The identification of aberrantly expressed genes in PDA-treated cells and verification of nine representative gene expression levels in human sarcopenic muscles. (A) The heat map of differentially expressed genes. HSMM-1 cells were treated with different doses of PDA (0, 0.1, 0.3 and 0.6 mM) for 12 h, followed by RNA isolation and microarray analysis. The differentially expressed genes that were dose-dependent on PDA are shown. (B-J) Detection of nine representative gene expression levels by RT-qPCR. Nine representative genes, including FOXM1 (B), PUMA (C), APAF1 (D), KAT5 (E), MSH6 (F), BCL2 (G), BIRC5 (H), NPM1 (I) and NOD1 (J), were selected to examine their expression levels in the nonsarcopenic (Control) and sarcopenic tissues (n=24 for each). Statistical significance was denoted by * for P<0.05, ** for P<0.01, and *** for P<0.001.
Figure 3
Figure 3
The mRNA levels of genes involved in apoptotic signaling in PDA-treated cells. Total RNA samples from cells treated with different doses of PDA (0, 0.1, 0.3 and 0.6 mM) were examined for their mRNA levels of FAS (A), TRADD (B), p53 (C), BIM (D), PUMA (E), BAX (F), BAK1 (G), BCL2 (H), APAF1 (I) and FOXM1 (J) by RT-qPCR. Statistical significance was denoted by * for P<0.05, ** for P<0.01, and *** for P<0.001.
Figure 4
Figure 4
FOXM1 docked onto the promoter of PUMA at the BS1 site to regulate its expression. A. The consensus sequence of FOXM1. B. The promoter of PUMA contained two putative FOXM1 binding sites. A 1500-bp length of the PUMA promoter was assessed for FOXM1 binding sites. Two binding sites (BS1 and BS2) were identified; their positions were shown. C. The relative luciferase activities. Three plasmids, pGL4.3-pPUMAWT, pGL4.3-pPUMA▽BS1 and pGL4.3-pPUMA▽BS2, were cotransfected with Renilla into Control-KD, FOXM1-KD1, FOXM1-KD2, Control-OE and FOXM11-OE cells. The transfected cells were cultured for an additional 24 h and then subjected to a dual-luciferase reporter assay. The relative luciferase activities were determined by normalizing the firefly luciferase activities to their corresponding Renilla activities. **P<0.01 and ***P<0.001. D. The occupancy of FOXM1 on the promoter of PUMA. The ChIP assays were performed in Control-KD, FOXM1-KD1, FOXM1-KD2, Control-OE and FOXM1-OE cells using anti-FOXM1 and IgG (negative control). The purified input and output DNA samples were subjected to RT-qPCR analysis to examine the occupancy of FOXM1 on the promoter of PUMA. **P<0.01 and ***P<0.001.
Figure 5
Figure 5
Knockdown of FOXM1 failed to active apoptosis signaling following PDA treatment. (A) Western blotting results. The Control-KD (Control), FOXM1-KD1 and FOXM1-KD2 cells were treated with or without 0.3 mM PDA for 12 h, followed by total protein extraction. Western blotting analyses were performed to detect the protein levels of FAS, TRADD, p53, BIM, FOXM1, PUMA, BAX, BCL2, CASP3, CASP7, CASP9, and GAPDH (loading control). (B and C) The normalized protein levels. The protein signals as shown in (A) were quantified using ImageJ software and then normalized to their corresponding GAPDH levels. **P<0.05, **P<0.01 and ***P<0.001.
Figure 6
Figure 6
NCOR1 assembled a transcriptional complex with FOXM1. (A) The relative NCOR1 mRNA level in sarcopenic muscles. The same RNA samples as used in Figure 2B were applied to RT-qPCR analyses to examine the NCOR1 mRNA level. P>0.05 (ns indicates no significance). (B) The relative NCOR1 protein level in sarcopenic muscles. The same muscle tissues as in (A) were used to extract total proteins, and the cell extracts were subjected to immunoblotting to examine NCOR1 and GAPDH (loading control) protein. The relative NCOR1 protein level was determined by normalizing to its corresponding GAPDH level. ***P<0.001. (C and D) FOXM1 and NCOR1 could pull down each other in vivo. Equal weights of three sarcopenic tissues were mixed together, and their homogenates were subjected to IP assays with IgG, anti-FOXM1 (C) and anti-NCOR1 (D), respectively. The input and output proteins were examined for their FOXM1 and NCOR1 protein levels by western blotting. (E) FOXM1 directly interacted with NCOR1 in vitro. The HSMM-1 cells were cotransfected with the plasmid combinations shown in the figure. After culturing for 48 h, the cells were used for Co-IP assays with Flag-agarose and MYC-agarose. The input and output proteins were examined by western blot for their protein levels using anti-Flag and anti-MYC antibodies.
Figure 7
Figure 7
Knockdown of NCOR1 activated apoptosis signaling without PDA treatment. (A) The relative mRNA level of NCOR1. Total RNA from Control-KD, NCRO1-KD1, NCOR1-KD2, Control-OE and NCOR1-OE cells was applied to RT-qPCR analysis to examine NCOR1. mRNA levels **P<0.01 and ***P<0.001. (B and C) NCOR1 protein levels. Total cell extracts from the cells used in (A) were applied to western blotting to examine the protein levels of NCOR1 and GAPDH (loading control) (B). The NCOR1 protein signals were quantified using ImageJ software and normalized to their corresponding GAPDH levels (C). **P<0.01 and ***P<0.001. (D) The relative PUMA mRNA level. The same RNA samples as used in (A) were subjected to RT-qPCR analysis to examine the PUMA expression. **P<0.01 and ***P<0.001. (E) The occupancy of NCOR1 and FOXM1 on the promoter of PUMA. ChIP assays were performed in Control-KD, NCOR1-KD1, NCOR1-KD2, Control-OE and NCOR1-OE cells using anti-NCOR1, anti-FOXM1 and IgG (negative control). The purified input and output DNA samples were subjected to RT-qPCR analysis to examine the occupancy of NCOR1 and FOXM1 on the promoter of PUMA. **P<0.01 and ***P<0.001. (F) The effects of NCOR1 knockdown on apoptotic proteins. Cells used in (A) were subjected to western blotting to examine the protein levels of PUMA, BCL2, BAX, APAF1, CASP3, CASP7, CASP9, and GAPDH (loading control).
Figure 8
Figure 8
The phosphorylation of NCOR1 mediated by AKT1 was required for the activation of apoptosis signaling. (A) The protein levels of FOXM1 and NCOR1 in PDA-treated cells. Total cell extracts from cells treated with different doses of PDA (0, 0.1, 0.3 and 0.6 mM) were subjected to western blotting to examine the protein levels of FOXM1, NCOR1, and GAPDH (loading control). (B) Quantification of protein band signals. The protein band signals in (A) were quantified using ImageJ software. *P<0.05 and **P<0.01. (C) The occupancy of NCOR1 and FOXM1 on the promoter of PUMA. ChIP assays were performed in the cells used in (A) with anti-NCOR1, anti-FOXM1 and IgG (negative control). The purified input and output DNA samples were subjected to RT-qPCR analysis to examine the occupancy of NCOR1 and FOXM1 on the promoter of PUMA. **P<0.05 and **P<0.01. (D) The effect of phosphatase (PPtase) on NCOR1 and apoptotic proteins. HSMM-1 cells were treated with or without 0.1 and 0.3 mM PDA for 12 h, followed by treating with or without PPtase for 2 h. Total protein extracts were subjected to western blotting to examine the protein levels of NCOR1, PUMA, APAF1, CASP3, CASP7, CASP9, and GAPDH (loading control). (E) The protein levels of AKT1 in PDA-treated cells. The same protein samples as used in (A) were subjected to western blotting to examine the protein levels of AKT1 and GAPDH (loading control). The protein signals were quantified. (F) The effect of AKT1 knockdown on apoptotic proteins. Control-KD (Ctrl), AKT1-KD1 (KD1) and AKT1-KD2 (KD2) cells were treated with or without 0.3 mM PDA for 12 h. Total protein extracts were subjected to western blotting to examine the protein levels of AKT1, NCOR1, PUMA, APAF1, CASP3, CASP7, CASP9, and GAPDH (loading control).
Figure 9
Figure 9
A schematic diagram of PDA-activated apoptosis signaling in the pathogenesis of sarcopenia. A. Schematic diagram of the NCOR1-FOXM1 transcriptional complex in non-sarcopenic muscles. The NCOR1-FOXM1 complex docks on the promoter of PUMA, and NCOR1 functions as a repressor to inhibit the expression of PUMA. The repression of PUMA inhibits its downstream molecules, such as BAX, APAF1, and CASP3/7/9. B. Schematic diagram of PDA-mediated signaling. The accumulation of PDA activates AKT1, causing the phosphorylation of NCOR1. The phosphorylated NCOR1 fails to assemble a complex with FOXM1, leading to the upregulation of PUMA. The induction of PUMA initiates its downstream apoptosis signaling, leading to cell apoptosis and the pathogenesis of sarcopenia.

Similar articles

Cited by

References

    1. Santilli V, Bernetti A, Mangone M, Paoloni M. Clinical definition of sarcopenia. Clin Cases Miner Bone Metab. 2014;11:177–180. - PMC - PubMed
    1. Ogawa S, Yakabe M, Akishita M. Age-related sarcopenia and its pathophysiological bases. Inflamm Regen. 2016;36:17. - PMC - PubMed
    1. Kalyani RR, Corriere M, Ferrucci L. Age-related and disease-related muscle loss: the effect of diabetes, obesity, and other diseases. Lancet Diabetes Endocrinol. 2014;2:819–829. - PMC - PubMed
    1. Walewski JL, Ge F, Gagner M, Inabnet WB, Pomp A, Branch AD, Berk PD. Adipocyte accumulation of long-chain fatty acids in obesity is multifactorial, resulting from increased fatty acid uptake and decreased activity of genes involved in fat utilization. Obes Surg. 2010;20:93–107. - PMC - PubMed
    1. Walle P, Takkunen M, Mannisto V, Vaittinen M, Kakela P, Agren J, Schwab U, Lindstrom J, Tuomilehto J, Uusitupa M, Pihlajamaki J. Alterations in fatty acid metabolism in response to obesity surgery combined with dietary counseling. Nutr Diabetes. 2017;7:e285. - PMC - PubMed

LinkOut - more resources