. 2020 Aug 15;7(19):2001108.
doi: 10.1002/advs.202001108. eCollection 2020 Oct.

Choice of Nanovaccine Delivery Mode Has Profound Impacts on the Intralymph Node Spatiotemporal Distribution and Immunotherapy Efficacy

Affiliations

Choice of Nanovaccine Delivery Mode Has Profound Impacts on the Intralymph Node Spatiotemporal Distribution and Immunotherapy Efficacy

Jianghua Wang et al. Adv Sci (Weinh). .

Abstract

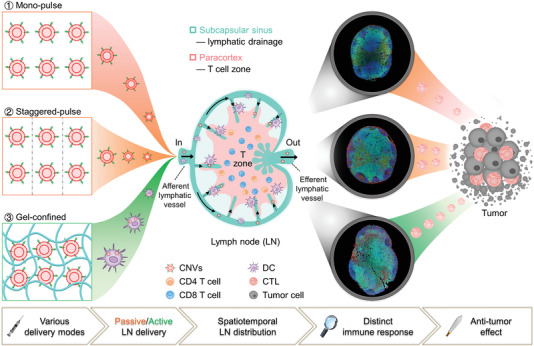
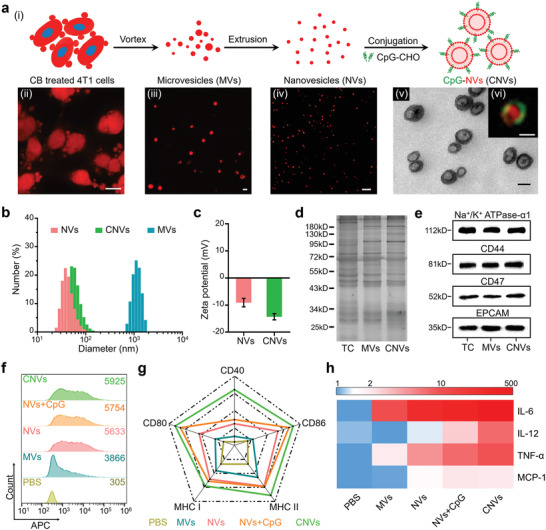
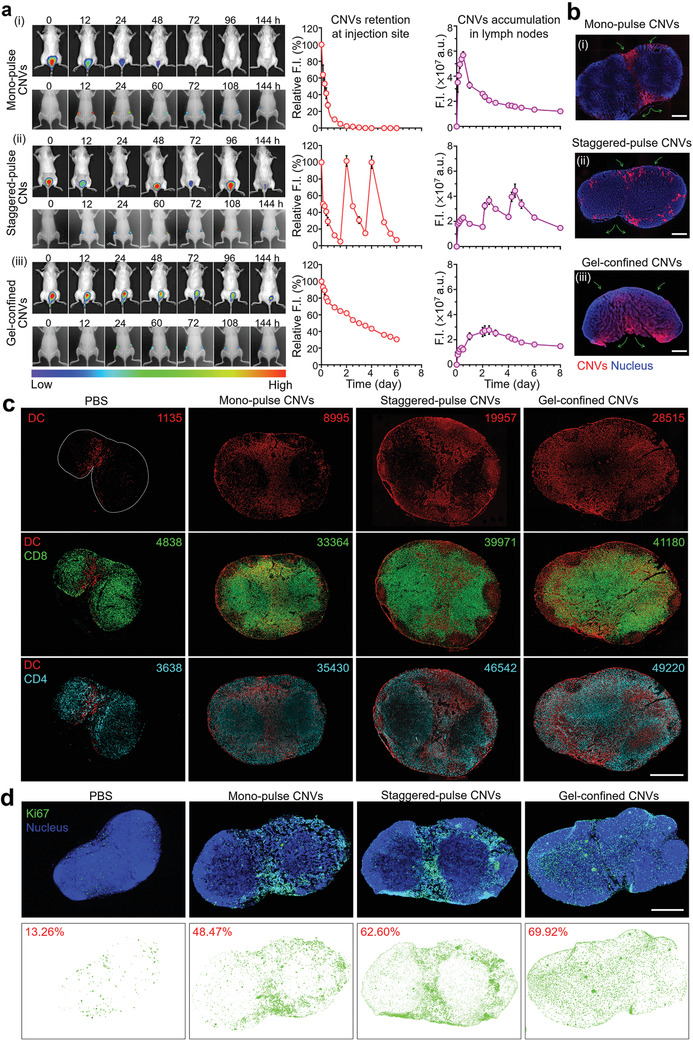
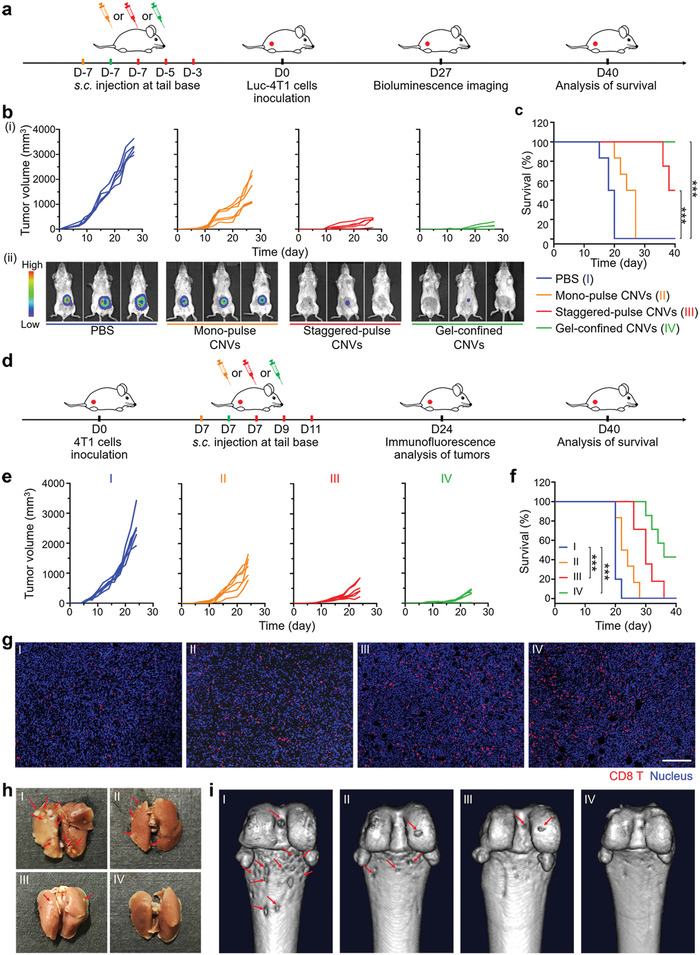
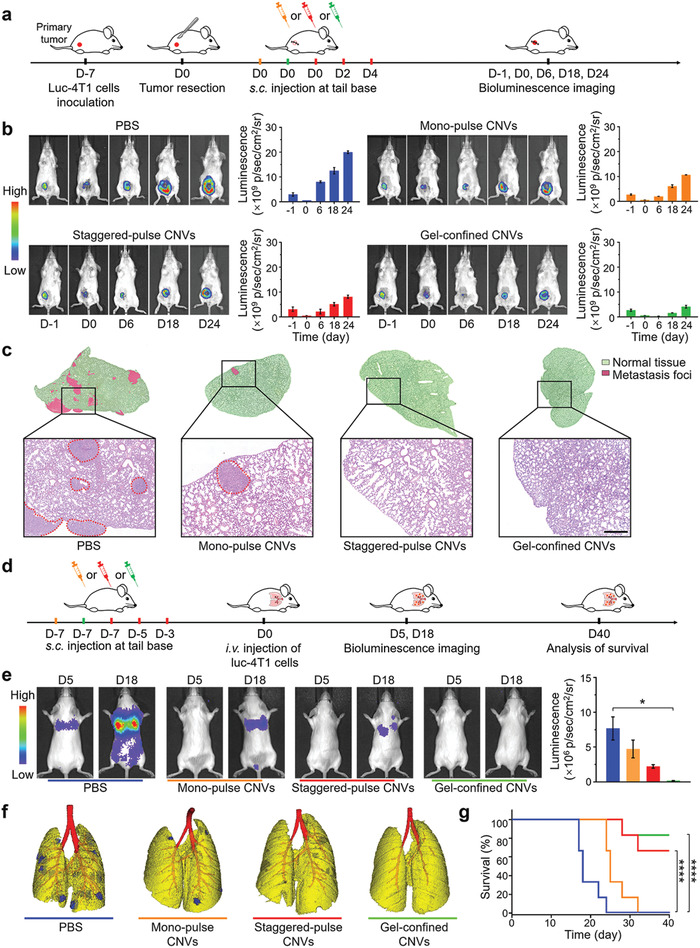
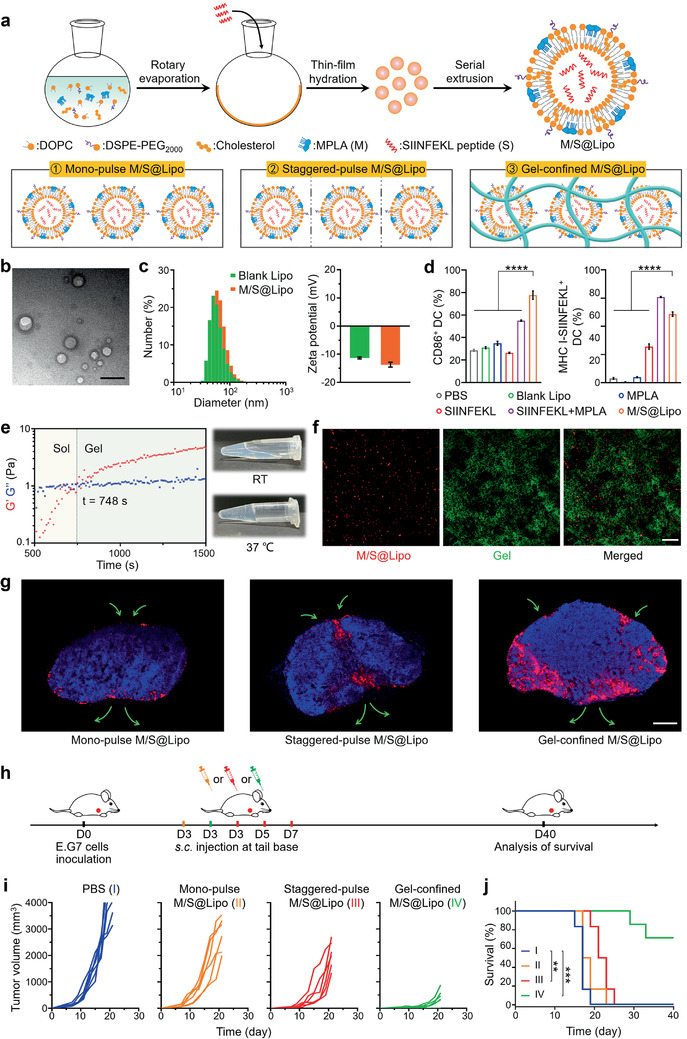
Nanovaccines have attracted booming interests in vaccinology studies, but the profound impacts of their delivery mode on immune response remain unrealized. Herein, immunostimulatory CpG-modified tumor-derived nanovesicles (CNVs) are used as a nanovaccine testbed to initially evaluate the impacts of three distinct delivery modes, including mono-pulse CNVs, staggered-pulse CNVs, and gel-confined CNVs. Fundamentally, delivery mode has enormous impacts on the immunomodulatory effects, altering the spatiotemporal distribution of nanovaccine residence and dendritic cell-T cell interaction in lymph nodes, and finally affecting subsequent T cell-mediated immune performance. As a result, the gel-confined delivery mode offers the best therapeutic performance in multiple tumor models. When extending evaluation to examine how the various delivery modes impact the performance of liposome-based nanovaccines, similar trends in intralymph node distribution and antitumor effect are observed. This work provides a strong empirical foundation that nanovaccine researchers should position delivery mode near the top of their considerations for the experimental design, which should speed up nanovaccine development and facilitate efficient selection of appropriate delivery modes in the clinic.

Keywords: delivery modes; hydrogels; lymph nodes; nanovaccines; tumor immunotherapy.


Conflict of interest statement

The authors declare no conflict of interest.

Figures

Scheme 1
Scheme 1
Spatiotemporal modulation of intralymph node distribution of nanovaccines for tumor immunotherapy via different delivery modes. Nanovaccines (CpG‐modified tumor‐derived nanovesicles, CNVs) were designed into three delivery modes including mono‐pulse CNVs, staggered‐pulse CNVs, and gel‐confined CNVs for tumor immunotherapy. In mono‐pulse CNVs and staggered‐pulse CNVs vaccinations, CNVs could passively drain to lymph nodes due to their nanometer size, while CNVs were actively delivered to lymph nodes through the migration of DCs under gel‐confined CNVs vaccination. Inside lymph nodes, abovementioned three CNVs delivery modes exhibited different spatiotemporal distribution of CNVs, which subsequently influenced the utilization of CNVs and the interaction of DC with T cells in T cell zone, resulting in distinct T cell‐mediated antitumor immunity.
Figure 1
Figure 1
Characterizations of CNVs and their capacity for bone marrow‐derived dendritic cells (BMDCs) activation in vitro. a) Schematics for the preparation of CNVs (i), and confocal laser scanning microscope (CLSM) images of CB‐treated 4T1 cells (ii, red), released MVs (iii, red), extruded NVs (iv, red), and TEM image (v) with inserted structured‐illumination microscopy (SIM) image of CNVs (vi, CpG‐green, NVs‐red). Scale bar: (ii) 5 µm; (iii,iv) 1 µm; (v,vi) 50 nm. b,c) Size distributions and zeta potentials of MVs, NVs, and CNVs measured by DLS. d,e) SDS‐PAGE analysis for total proteins and Western blotting analysis for membrane‐associated markers (Na+/K+ ATPase‐α1, CD44, CD47, and EPCAM) of tumor cell (TC), MVs, and CNVs. f) Cellular uptake of MVs, NVs, NVs plus CpG, and CNVs into BMDCs. The number in the upper right corner indicated the mean fluorescence intensity (F.I.) of 5 × 10³ DCs. g) The expression levels of costimulatory molecules (CD40, CD80, and CD86) and MHC molecules (MHC I and MHC II) on BMDCs after 24 h incubation with MVs, NVs, NVs plus CpG, or CNVs. h) Heat map for the released cytokines levels (as fold change) in the culture supernatants of BMDCs harvested from experiment in panel (g). The data were normalized to the lowest level for each cytokine among all groups. Data in (c) represent the mean ± s.e.m. (n = 3).
Figure 2
Figure 2
Characterizations of gel‐confined CNVs and their capacity for DCs recruitment and activation in vivo. a) Scanning electron microscopy (SEM) image of blank hydrogel (blank gel). Scale bar: 25 µm. b) The evolution of dynamic storage modulus (G′) and loss modulus (G″) of gel‐confined CNVs at 37 °C (left), and photographs of gel‐confined CNVs before and after incubation at 37 °C (right). c) CLSM image of gel (green)‐confined CNVs (red). Scale bar: 25 µm. d) Photographs of the retrieved skin and gel sample (left) from a mouse at day 3 post‐s.c. injection with gel‐confined CNVs, and the frozen‐section fluorescent image (right) of the retrieved gel sample. Scale bar: left, 5 mm; right 25 µm. e) Live (green)/Dead (red) stained image of isolated cells from the retrieved gel sample. Scale bar: 25 µm. f) H&E stained images of skin samples from mice of the blank gel and gel‐confined CNVs groups at day 3 post‐s.c. injection. Scale bar: 100 µm. g) Quantitation of recruited cells (left) within the retrieved gels at day 3 post‐s.c. injection and the corresponding proportions of DC and macrophage (right). h) Proportions of CD80+ CD11c+ and MHC II+ CD11c+ cells in recruited cells. i,j) Heat map for the concentrations of chemokines and inflammatory cytokines in lysates of the isolated cells from retrieved gels at day 3 postinjection. Data in (g) and (h) represent the mean ± s.e.m. (n = 3). P‐values between two groups were calculated via unpaired Student's t‐test. *P < 0.05, **P < 0.01.
Figure 3
Figure 3
Characterizations of the lymph node delivery, intralymph node distribution, and subsequent immunoresponses elicited by three delivery modes for CNVs. a) In vivo imaging analysis for F.I. of 1,1‐dioctadecyl‐3,3,3,3‐tetramethylindotricarbocyanine iodide (DiR)‐labeled CNVs retention at injection site (top, back imaging) and accumulation of lymph nodes (bottom, abdominal imaging) in mice treated via the three delivery modes. Noted that the relative quantitative F.I. of CNVs were normalized to themselves in each group. a.u. represent arbitrary unit. b) Fluorescence images of lymph node frozen sections. The orientation of green arrows indicated the location of afferent lymph flow and efferent lymph flow of each lymph node. Scale bar: (i) 300 µm; (ii) 400 µm; (iii) 500 µm. c) Multiple immunofluorescence analysis of lymph node sections at day 7 postvaccination and corresponding quantitation of cell phenotypes in each slide (top: DCs, middle: CD8 T cells, bottom: CD4 T cells) using Inform Image Analysis software (PerkinElmer). DCs (red), CD8 T cells (green), and CD4 T cells (cyan). Scale bar: 1 mm. d) Immunofluorescence analysis of Ki67 expression. The percentages indicated the ratio of the area of proliferating cells (Ki67) to the total area of lymph nodes. Ki67 (green) and nucleus (blue). Scale bar: 1 mm. Data in (a) represent the mean ± s.e.m. (n = 3).
Figure 4
Figure 4
Prophylactic and therapeutic effects on 4T1 primary tumor model under vaccination with three CNVs delivery modes. a) Experimental design for a prevention of 4T1 primary tumor based on three CNVs delivery modes. Mice were prevaccinated at day ‐7 with mono‐pulse CNVs (orange) or gel‐confined CNVs (green) modes, or at days ‐7, ‐5, and ‐3 with staggered‐pulse CNVs (red), followed by s.c. injection with 5 × 10⁵ luc‐4T1 tumor cells at day 0. b) Individual tumor growth curves for mice after different treatments (i) (n = 6) and representative bioluminescence image analysis of tumors at day 27 (ii). c) Survival curves for mice of the different delivery mode groups (n = 6). d) Experimental design for a therapy of 4T1 primary tumor based on the three CNVs delivery modes. Mice were inoculated with 5 × 10⁵ 4T1 tumor cells at day 0 and subsequently vaccinated at day 7 with the mono‐pulse CNVs (orange) or gel‐confined CNVs (green) modes, or at days 7, 9, and 11 with staggered‐pulse CNVs mode (red). e) Individual tumor growth curves for mice after different treatments (n = 6). f) Survival curves for mice after different treatments (n = 6). g) Immunofluorescence image analysis of the infiltration of CD8 T cells into tumors. CD8 T cells (red) and nucleus (blue). Scale bar: 100 µm. h) Representative photographs of ex vivo lungs for analyzing pulmonary metastasis (red arrows). i) Representative images of tibia metastasis (red arrows) via computed tomography (CT). Survival analyses in (c) and (f) were calculated by log‐rank test. ***P < 0.001.
Figure 5
Figure 5
Antire‐currence performance and anti‐metastatic effects of the three CNVs delivery modes. a) Experimental design for a tumor therapy in an incomplete‐surgery luc‐4T1 tumor model. 4T1 tumor‐bearing mice received surgical tumor resection at day 0, and were subsequently vaccinated at day 0 with mono‐pulse CNVs (orange) or gel‐confined CNVs (green), or at days 0, 2, and 4 with staggered‐pulse CNVs (red) (as a treatment to inhibit postresection tumor recurrence). b) Representative bioluminescence images (left) and fluorescence quantification (right) of the primary tumor before tumor resection and recurrent tumors after resection after different treatments. c) Representative H&E stained lung sections from mice of the different treatment groups. The red circles indicated the regions of metastasis foci. Scale bar: 100 µm. d) Experimental design for an anti‐metastatic tumor therapy based on three CNVs delivery modes. Mice were pretreated at day ‐7 with monopulse CNVs or gel‐confined CNVs, or at days ‐7, ‐5, and ‐3 with staggered‐pulse CNVs, and followed by i.v. injection with 5 × 10⁵ luc‐4T1 cells at day 0. e) Representative bioluminescence images of hematogenous metastasis in lungs with different CNVs prevaccination delivery modes and corresponding quantitative luminescence signals of lung metastasis. f) In vivo imaging analysis of lung metastasis via CT. Yellow indicated normal tissue while blue indicated metastasis foci. g) Survival curves for mice of the different delivery mode groups (n = 6). Data represent the mean ± s.e.m. (g, n = 6; e, n = 3). P‐values were calculated via one‐way ANOVA with Tukey post‐hoc test. *P < 0.05. Survival analysis in (g) was calculated by log‐rank test. ****P < 0.0001.
Figure 6
Figure 6
Synthesis, characterizations, intralymph node distribution, and antitumor effect of M/S@Lipo under three delivery modes. a) Schematic illustration of the construction of M/S@Lipo (top) and their three delivery modes (bottom). b) TEM image of M/S@Lipo. Scale bar: 100 nm. c) Size distributions and zeta potentials of blank liposomes (blank Lipo) and M/S@Lipo. d) The expression of costimulatory molecules CD86 and antigen presentation (MHC I‐SIINFEKL) on BMDCs after 24 h incubation with PBS, blank Lipo, MPLA, SIINFEKL peptide, SIINFEKL peptide plus MPLA, or M/S@Lipo. e) The evolution of G′ and G″ of gel‐confined M/S@Lipo at 37 °C (left) and photographs of the gel‐confined M/S@Lipo before and after incubation at 37 °C (right). f) CLSM images of gel sample for gel‐confined M/S@Lipo in vitro. M/S@Lipo (red) and hydrogel (green). Scale bar: 50 µm. g) Fluorescence images of lymph nodes frozen section at day 7 after three M/S@Lipo delivery modes treatments. Scale bar: 500 µm. h) Experimental design for a therapy of E.G7 primary tumor based on the three M/S@Lipo delivery modes. Mice were inoculated with 5 × 10⁵ E.G7 cells at day 0 and subsequently vaccinated at day 3 with the mono‐pulse M/S@Lipo (orange) or the gel‐confined M/S@Lipo (green), or at days 3, 5, and 7 with the staggered‐pulse M/S@Lipo (red). i) Individual tumor growth curves for E.G7 tumor‐bearing mice after different treatments (n = 6). j) Survival curves for mice of the different delivery mode groups (n = 6). Data in (c) and (d) represent the mean ± s.e.m. (n = 3). P‐values were calculated via one‐way ANOVA with Tukey post‐hoc test. ****P < 0.0001. Survival analysis in (j) was calculated by log‐rank test. **P < 0.01, ***P < 0.001.

Similar articles

Cited by

References

    1. Couzin‐Frankel J., Science 2013, 342, 1435. - PubMed
    1. Oleszycka E., Lavelle E. C., Curr. Opin. Immunol. 2014, 28, 1. - PubMed
    1. McKee A., Marrack P., Curr. Opin. Immunol. 2017, 47, 44. - PMC - PubMed
    1. Ali O. A., Emerich D., Dranoff G., Mooney D. J., Sci. Transl. Med. 2009, 1, 8ra19. - PMC - PubMed
    1. Kim J., Li W. A., Choi Y., Lewin S. A., Verbeke C. S., Dranoff G., Mooney D. J., Nat. Biotechnol. 2015, 33, 64. - PMC - PubMed

LinkOut - more resources