. 2020 Aug 7;7(19):2001334.
doi: 10.1002/advs.202001334. eCollection 2020 Oct.

Human Mesenchymal Stem Cell Derived Exosomes Enhance Cell-Free Bone Regeneration by Altering Their miRNAs Profiles

Affiliations

Human Mesenchymal Stem Cell Derived Exosomes Enhance Cell-Free Bone Regeneration by Altering Their miRNAs Profiles

Mengmeng Zhai et al. Adv Sci (Weinh). .

Abstract

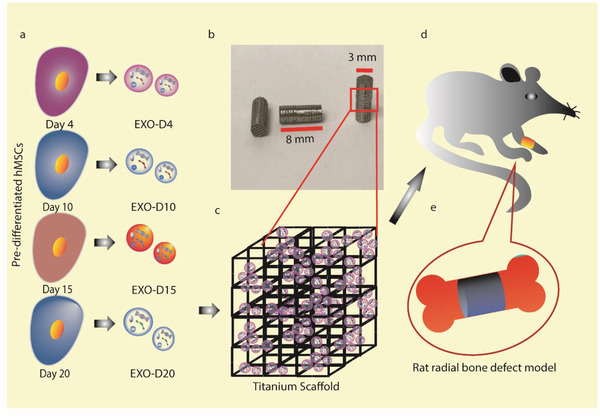
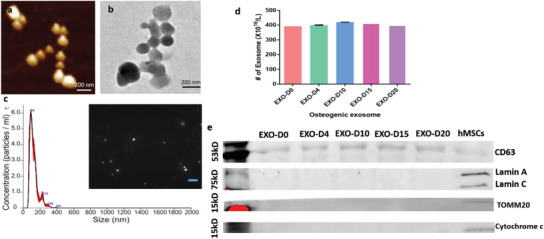
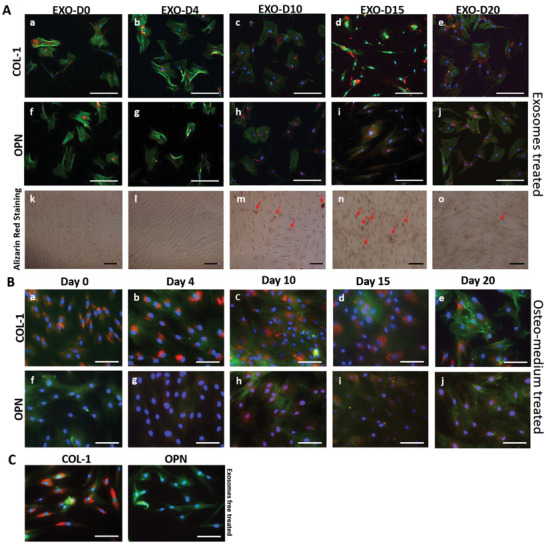
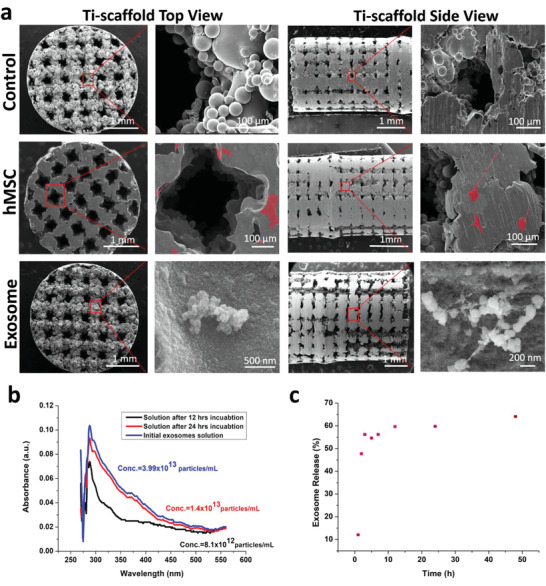
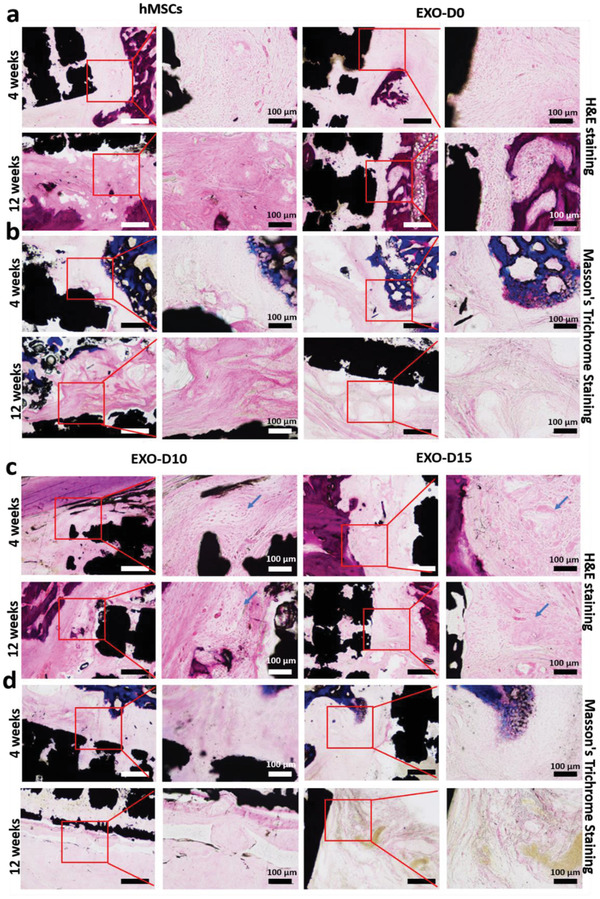
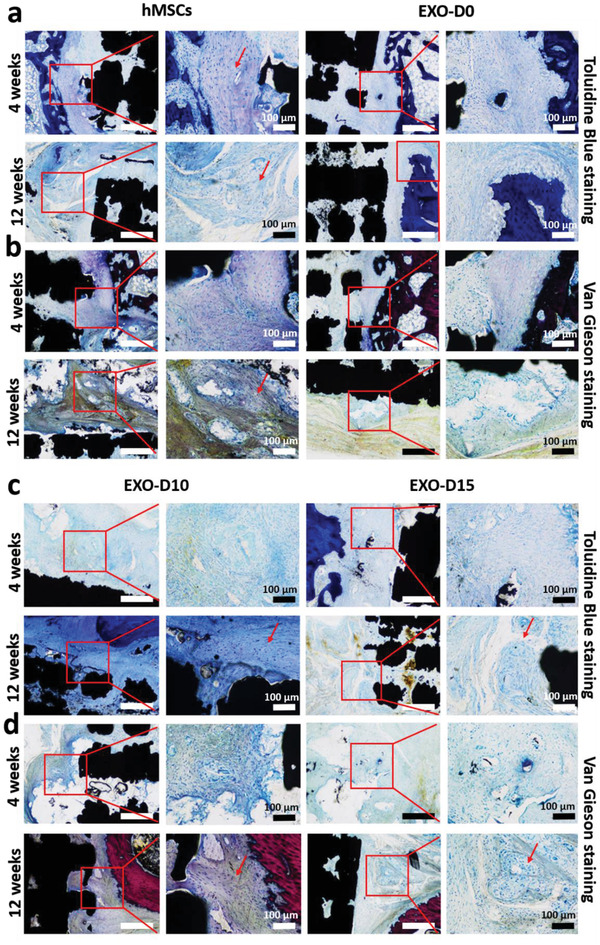
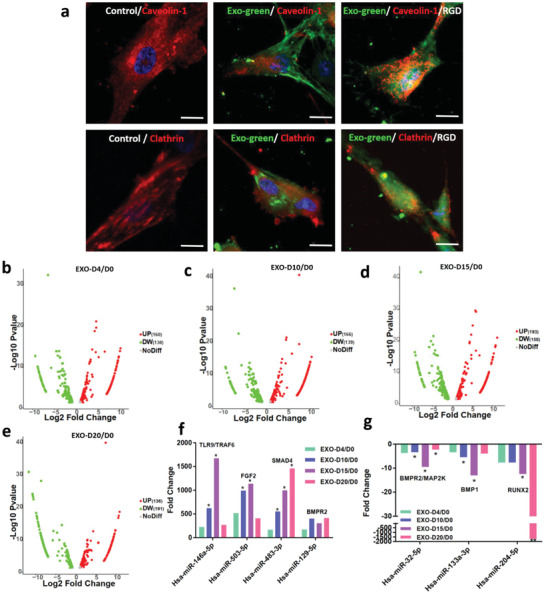
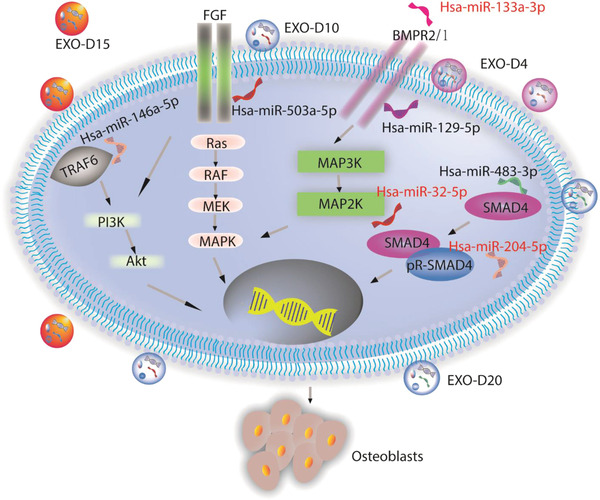
Implantation of stem cells for tissue regeneration faces significant challenges such as immune rejection and teratoma formation. Cell-free tissue regeneration thus has a potential to avoid these problems. Stem cell derived exosomes do not cause immune rejection or generate malignant tumors. Here, exosomes that can induce osteogenic differentiation of human mesenchymal stem cells (hMSCs) are identified and used to decorate 3D-printed titanium alloy scaffolds to achieve cell-free bone regeneration. Specifically, the exosomes secreted by hMSCs osteogenically pre-differentiated for different times are used to induce the osteogenesis of hMSCs. It is discovered that pre-differentiation for 10 and 15 days leads to the production of osteogenic exosomes. The purified exosomes are then loaded into the scaffolds. It is found that the cell-free exosome-coated scaffolds regenerate bone tissue as efficiently as hMSC-seeded exosome-free scaffolds within 12 weeks. RNA-sequencing suggests that the osteogenic exosomes induce the osteogenic differentiation by using their cargos, including upregulated osteogenic miRNAs (Hsa-miR-146a-5p, Hsa-miR-503-5p, Hsa-miR-483-3p, and Hsa-miR-129-5p) or downregulated anti-osteogenic miRNAs (Hsa-miR-32-5p, Hsa-miR-133a-3p, and Hsa-miR-204-5p), to activate the PI3K/Akt and MAPK signaling pathways. Consequently, identification of osteogenic exosomes secreted by pre-differentiated stem cells and the use of them to replace stem cells represent a novel cell-free bone regeneration strategy.

Keywords: bone regeneration; cell‐free scaffolds; exosomes; miRNAs.


Conflict of interest statement

The authors declare no conflict of interest.

Figures

Scheme 1
Scheme 1
Cell‐free bone tissue regeneration by the stem cell derived exosomes. a) Exosomes were isolated from the pre‐differentiated hMSCs induced by the osteogenic medium for 4, 10, 15, 20 days, respectively. Osteogenic differentiation was tested to identify the exosomes that could induce the osteogenic differentiation of hMSCs. b) Representative structure and morphology of Ti‐scaffolds (8 mm in length and 3 mm in diameter). c–e) Osteogenic exosomes were seeded into the Ti‐scaffolds, which were then implanted into the rat radial bone defect model (d and e) for 4 and 12 weeks, respectively.
Figure 1
Figure 1
The characterization of the stem cell derived exosomes. a) AFM and b) TEM showing the size and morphology of the exosomes derived from hMSCs. Scale bar: 200 nm. c) The size and concentration of the hMSCs‐derived exosomes by the NanosightNS300. The inset is an image showing the snapshot of video tracking. Scale bar: 800 nm. d) The concentration of exosomes (derived from the pre‐differentiated hMSCs on day 0, day 4, day 10, day 15, and day 20, respectively) determined by EXOCET Exosome Quantitation kit. e) The Western blot analysis of the exosome derived from the pre‐differentiated hMSCs and hMSCs. 20 µg of the exosome proteins were loaded into the lane. Exosome specific anti‐CD63 primary antibody was used. Lamin A and Lamin C: Nuclear marker; TOMM20 and Cytochrome c: Mitochondrial marker.
Figure 2
Figure 2
Osteogenic differentiation of hMSCs by the osteogenic exosomes. A,a–j) Immunofluorescence staining of the osteogenic markers (COL‐1 [a–e]; OPN [f–j]) in the hMSCs showing the osteogenic differentiation on day 20 induced by hMSCs‐derived osteogenic exosomes (EXO‐D0, EXO‐D4, EXO‐D10, EXO‐D15, and EXO‐D20) and B) the osteogenic medium. The red color of the cells ([h–j] in [A]) treated with the EXO‐D10, EXO‐D15, and EXO‐D20 is much deeper than that of the cells in (f) and (g). Similarly, the red color of the cells ([h–j] in [B]) treated with the osteogenic medium is much deeper than the other control cells in (f) and (g). Blue (DAPI), nuclei; green (FITC), F‐actin; red (TRITC), OPN and COL‐1. k–o) Bright field images of the Alizarin Red staining for the osteogenesis of hMSCs induced by the osteogenic exosomes. The red deposit is the calcium nodule and indicated by the arrows. Scale bar: 100 µm.
Figure 3
Figure 3
The quantitation of the immunofluorescence staining, gene expression and ALP activity. The relative fluorescence intensity (RFU) of the a) Col‐1 and b) OPN marker of the immunofluorescence staining. c) Real‐Time PCR analysis of the osteogenic markers (COL‐1, Runx2, ALP, and OPN) showing the osteogenesis of hMSCs induced by the osteogenic exosomes at the gene level. Each gene expression was compared with that of the EXO‐D4 treated group. d) ALP activity of osteogenesis of hMSCs induced by the osteogenic exosomes. Each ALP activity was compared with that of the EXO‐D0 treated group. e) The Alizarin Red intensity after all kinds of exosome induction. Each exosome treated group was compared with the EXO‐D0 treated group. *p < 0.05; **p < 0.01, N = 3.
Figure 4
Figure 4
Characterization of the scaffolds and exosome loading into and releasing from the scaffolds. a) SEM images of the Ti‐scaffolds, hMSCs‐Ti‐scaffolds, and exosome‐Ti‐scaffolds. b) Exosomes loading into the Ti‐scaffold and c) exosome releasing from the exosome‐3D‐Ti‐scaffold. (b) shows UV–vis absorption spectra of the initial exosomes solution and the supernatant 12 or 24 h after the exosomes are loaded into the Ti‐scaffold. The exosomes loading efficiency is calculated to be 79.48%. (c) shows the exosome releasing from the Ti‐scaffold in the basal medium (pH = 7.4). hMSCs are pseudo‐colored into red on the hMSCs‐Ti‐scaffolds. The concentration of the exosomes is calculated as the number of exosome particles in per mL.
Figure 5
Figure 5
H&E staining and Masson's trichrome staining confirmed the new bone formation in vivo after 4 and 12 weeks. a,c) H&E staining; b,d) Masson's trichrome staining; low magnification scale bar: 250 µm. The arrows indicated the newly formed bone. The black areas reflect the section of the Ti‐scaffolds. The area framed by red square highlights the presence of bone cells. N = 5.
Figure 6
Figure 6
Toluidine Blue staining and Van Gienson staining confirmed the new bone formation in vivo after 4 and 12 weeks. a,c) Toluidine Blue staining; b,d) Van Gienson staining; low magnification scale bar: 250 µm. The arrows indicated the new bone formation. The black areas are the sections of the Ti‐scaffolds. Light pink: the collagen fiber; light blue: the osteoblast cells. N = 5.
Figure 7
Figure 7
A mechanism for the osteogenesis of hMSCs induced by the osteogenic exosomes. a) Colocalization of the exosomes and clathrin/caveolin‐1 protein. Anti‐caovelin‐1 protein is colocalized with the exosomes labeled with the green fluorescence of the hMSCs and the RGD‐peptide blocked hMSCs as well, but anti‐clathrin protein is not as obvious as the anti‐caveolin‐1. The images are captured by the confocal microscopy. b–e) Volcano analysis for the miRNA expression of different osteogenic exosomes. f) Upregulation and g) downregulation of the miRNAs expression (fold change) involved in the osteogenesis of the hMSCs. FGF: Fibroblast growth factor; BMPR2: Bone Morphogenetic Protein Receptor 2; TRAF6: TNF receptor associated factor; SMAD4: Mothers against decapentaplegic homolog 4; MAP2K: Mitogen‐activated protein kinase kinase; BMP1: Bone morphogenetic protein 1; RUNX2: Runt‐related transcription factor 2. The significant differences are calculated by comparing the EXO‐D4/D0 in each group. Scale bar: 10 µm. *p < 0.05, N = 3; **p < 0.01, N = 3.
Scheme 2
Scheme 2
The possible signaling pathways for the exosome‐induced osteogenic differentiation of hMSCs in vitro and in vivo. It is likely that the osteogenic exosomes induce the osteogenesis of the hMSCs by the PI3K/Akt and MAPK signaling pathways. FGF: Fibroblast growth factor; BMPR2: Bone Morphogenetic Protein Receptor 2; TRAF6: TNF receptor associated factor; SMAD4: Mothers against decapentaplegic homolog 4; PI3K: The phosphoinositide 3‐kinase; Akt: serine/threonine‐specific protein kinase; MAPK: microtubule associated protein kinase. MAP2K: Mitogen‐activated protein kinase kinase; BMP1: Bone morphogenetic protein 1.

References

    1. Dimitriou R., Jones E., McGonagle D., Giannoudis P. V., BMC Med. 2011, 9, 66. - PMC - PubMed
    1. Holdsworth D. W., Thornton M. M., Trends Biotechnol. 2002, 20, S34.
    1. Yoo S. Y., Merzlyak A., Lee S.‐W., Mediators Inflammation 2014, 2014, 192790. - PMC - PubMed
    1. Chocholata P., Kulda V., Babuska V. J. M., Materials 2019, 12, 568. - PMC - PubMed
    1. Shi Y., Hu G., Su J., Li W., Chen Q., Shou P., Xu C., Chen X., Huang Y., Zhu Z., Cell Res. 2010, 20, 510. - PubMed

LinkOut - more resources