

Rapid Determination of Antimicrobial Susceptibility by Stimulated Raman Scattering Imaging of D2O Metabolic Incorporation in a Single Bacterium
- PMID: 33042757
- PMCID: PMC7539191
- DOI: 10.1002/advs.202001452
Rapid Determination of Antimicrobial Susceptibility by Stimulated Raman Scattering Imaging of D2O Metabolic Incorporation in a Single Bacterium
Abstract
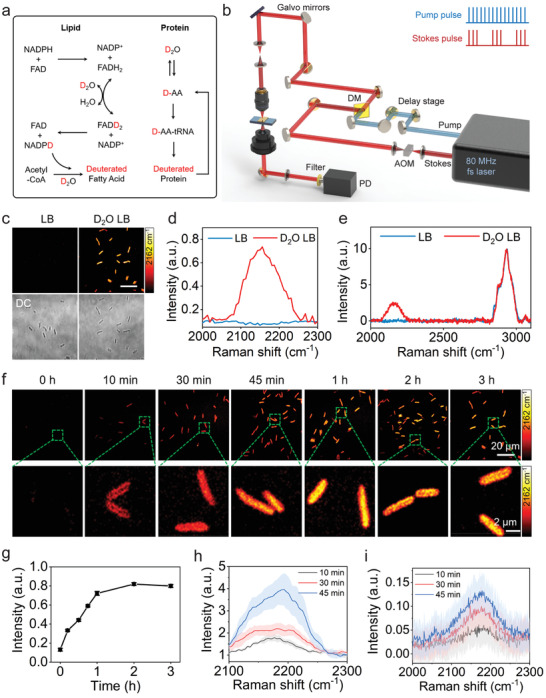
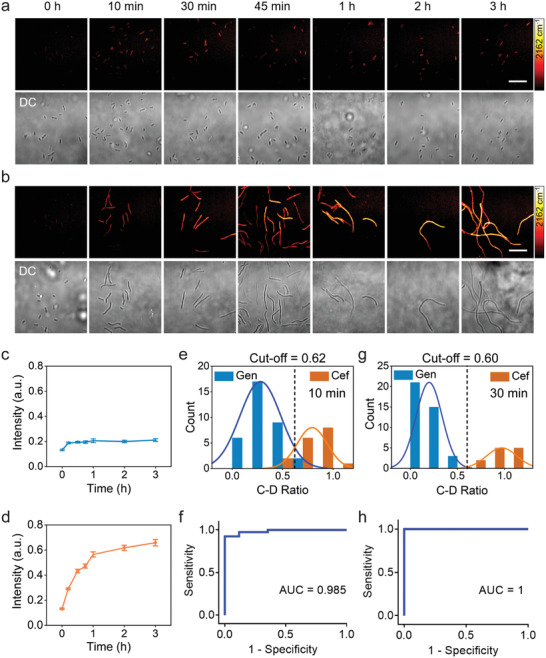
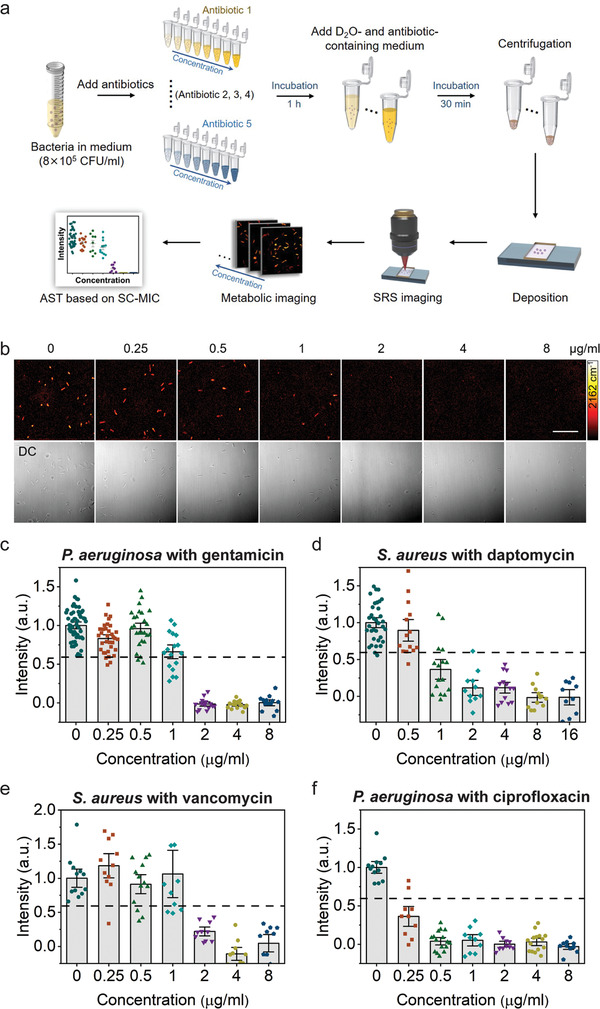
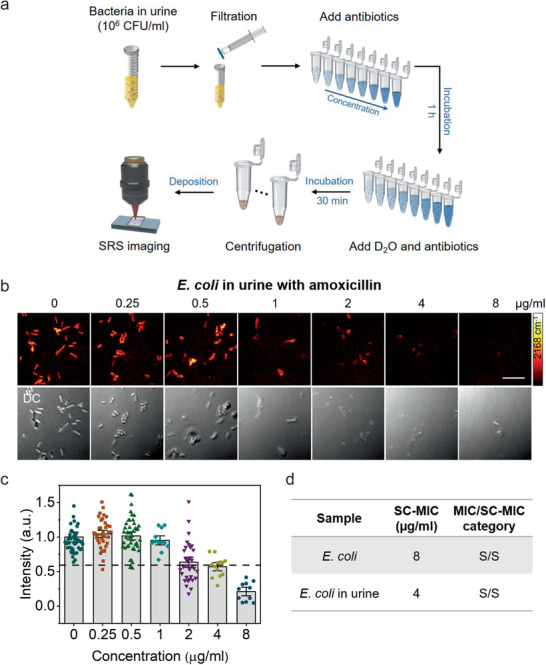
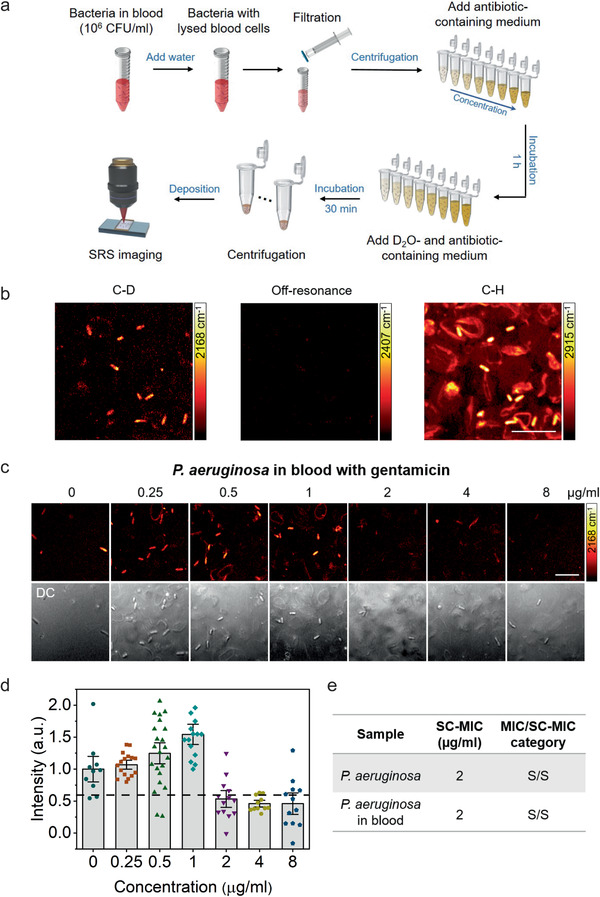
Rapid antimicrobial susceptibility testing (AST) is urgently needed for treating infections with appropriate antibiotics and slowing down the emergence of antibiotic-resistant bacteria. Here, a phenotypic platform that rapidly produces AST results by femtosecond stimulated Raman scattering imaging of deuterium oxide (D2O) metabolism is reported. Metabolic incorporation of D2O into biomass in a single bacterium and the metabolic response to antibiotics are probed in as short as 10 min after culture in 70% D2O medium, the fastest among current technologies. Single-cell metabolism inactivation concentration (SC-MIC) is obtained in less than 2.5 h from colony to results. The SC-MIC results of 37 sets of bacterial isolate samples, which include 8 major bacterial species and 14 different antibiotics often encountered in clinic, are validated by standard minimal inhibitory concentration blindly measured via broth microdilution. Toward clinical translation, stimulated Raman scattering imaging of D2O metabolic incorporation and SC-MIC determination after 1 h antibiotic treatment and 30 min mixture of D2O and antibiotics incubation of bacteria in urine or whole blood is demonstrated.
Keywords: antimicrobial susceptibility testing; bacteria; isotope probing; single‐cell imaging; stimulated Raman scattering.
© 2020 The Authors. Published by Wiley‐VCH GmbH.
Conflict of interest statement
The authors declare no conflict of interest.
Figures
Similar articles
-
Rapid Antimicrobial Susceptibility Testing by Stimulated Raman Scattering Imaging of Deuterium Incorporation in a Single Bacterium.J Vis Exp. 2022 Feb 14;(180):10.3791/62398. doi: 10.3791/62398. J Vis Exp. 2022. PMID: 35225259 Free PMC article.
-
Rapid antimicrobial susceptibility testing by stimulated Raman scattering metabolic imaging and morphological deformation of bacteria.Anal Chim Acta. 2021 Jul 11;1168:338622. doi: 10.1016/j.aca.2021.338622. Epub 2021 May 7. Anal Chim Acta. 2021. PMID: 34051990
-
Raman-Based Antimicrobial Susceptibility Testing on Antibiotics of Last Resort.Infect Drug Resist. 2023 Aug 21;16:5485-5500. doi: 10.2147/IDR.S404732. eCollection 2023. Infect Drug Resist. 2023. PMID: 37638072 Free PMC article.
-
Recent Development of Rapid Antimicrobial Susceptibility Testing Methods through Metabolic Profiling of Bacteria.Antibiotics (Basel). 2021 Mar 17;10(3):311. doi: 10.3390/antibiotics10030311. Antibiotics (Basel). 2021. PMID: 33803002 Free PMC article. Review.
-
Campylobacter and fluoroquinolones: a bias data set?Environ Microbiol. 2003 Apr;5(4):219-30. doi: 10.1046/j.1462-2920.2003.00425.x. Environ Microbiol. 2003. PMID: 12662169 Review.
Cited by
-
Imaging Metabolic Flow of Water in Plants with Isotope-Traced Stimulated Raman Scattering Microscopy.Adv Sci (Weinh). 2024 Nov;11(42):e2407543. doi: 10.1002/advs.202407543. Epub 2024 Sep 20. Adv Sci (Weinh). 2024. PMID: 39301930 Free PMC article.
-
Multi-color stimulated Raman scattering with a frame-to-frame wavelength-tunable fiber-based light source.Biomed Opt Express. 2021 Sep 13;12(10):6228-6236. doi: 10.1364/BOE.436299. eCollection 2021 Oct 1. Biomed Opt Express. 2021. PMID: 34745731 Free PMC article.
-
Simultaneous Raman and infrared spectroscopy: a novel combination for studying bacterial infections at the single cell level.Chem Sci. 2022 Jun 29;13(27):8171-8179. doi: 10.1039/d2sc02493d. eCollection 2022 Jul 13. Chem Sci. 2022. PMID: 35919437 Free PMC article.
-
Metabolic Rewiring of Bacterial Pathogens in Response to Antibiotic Pressure-A Molecular Perspective.Int J Mol Sci. 2025 Jun 11;26(12):5574. doi: 10.3390/ijms26125574. Int J Mol Sci. 2025. PMID: 40565037 Free PMC article. Review.
-
In Vitro Anticancer Drug Sensitivity Sensing through Single-Cell Raman Spectroscopy.Biosensors (Basel). 2021 Aug 20;11(8):286. doi: 10.3390/bios11080286. Biosensors (Basel). 2021. PMID: 34436088 Free PMC article.
References
-
- O'Neill J., Tackling Drug‐Resistant Infections Globally: Final Report and Recommendations, Review on Antimicrobial Resistance, London: 2016.
-
- Sugden R., Kelly R., Davies S., Nat. Microbiol. 2016, 1, 16187. - PubMed
-
- Kumar A., Roberts D., Wood K. E., Light B., Parrillo J. E., Sharma S., Suppes R., Feinstein D., Zanotti S., Taiberg L., Crit. Care Med. 2006, 34, 1589. - PubMed
-
- Reller L. B., Weinstein M., Jorgensen J. H., Ferraro M. J., Clin. Infect. Dis. 2009, 49, 1749. - PubMed
Grants and funding
LinkOut - more resources
Full Text Sources
Other Literature Sources