. 2020 Sep 17:8:857.
doi: 10.3389/fcell.2020.00857. eCollection 2020.

Wwc2 Is a Novel Cell Division Regulator During Preimplantation Mouse Embryo Lineage Formation and Oogenesis

Affiliations

Wwc2 Is a Novel Cell Division Regulator During Preimplantation Mouse Embryo Lineage Formation and Oogenesis

Giorgio Virnicchi et al. Front Cell Dev Biol. .

Abstract

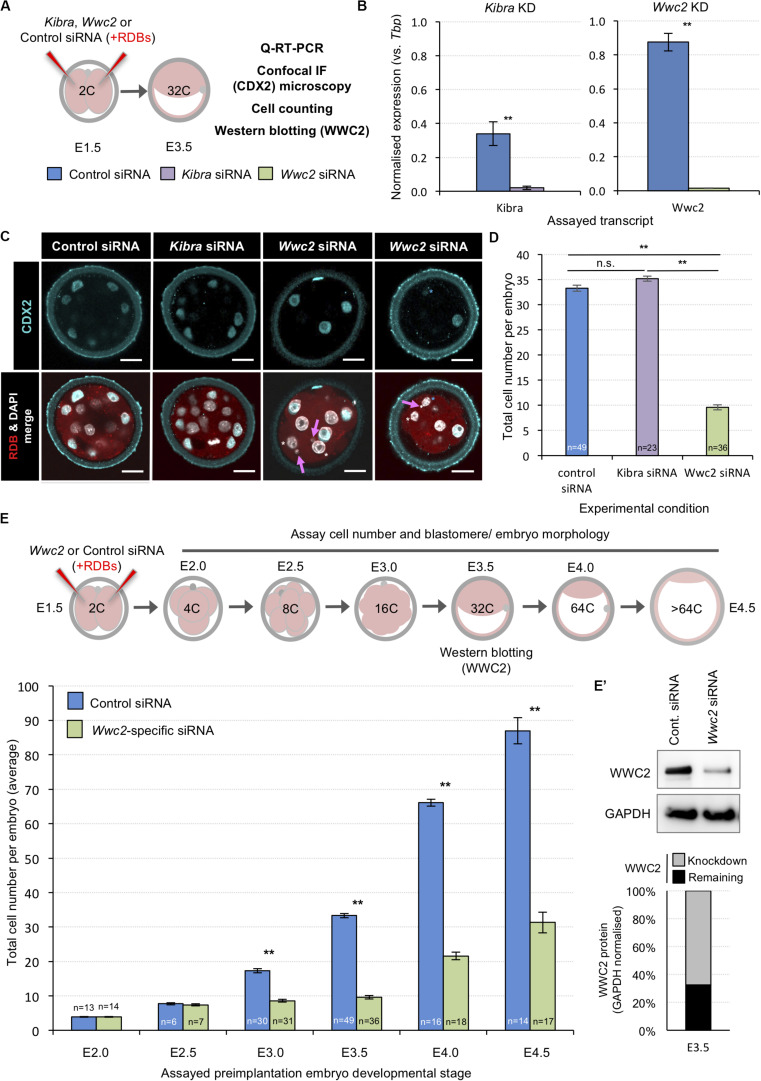
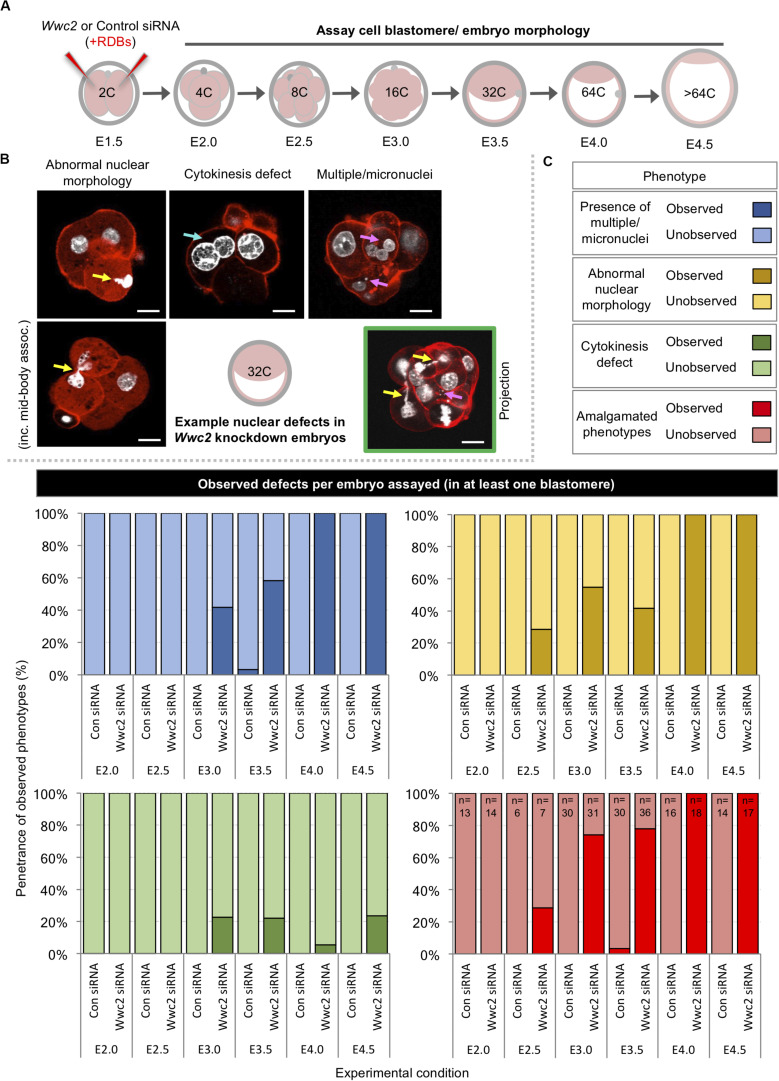
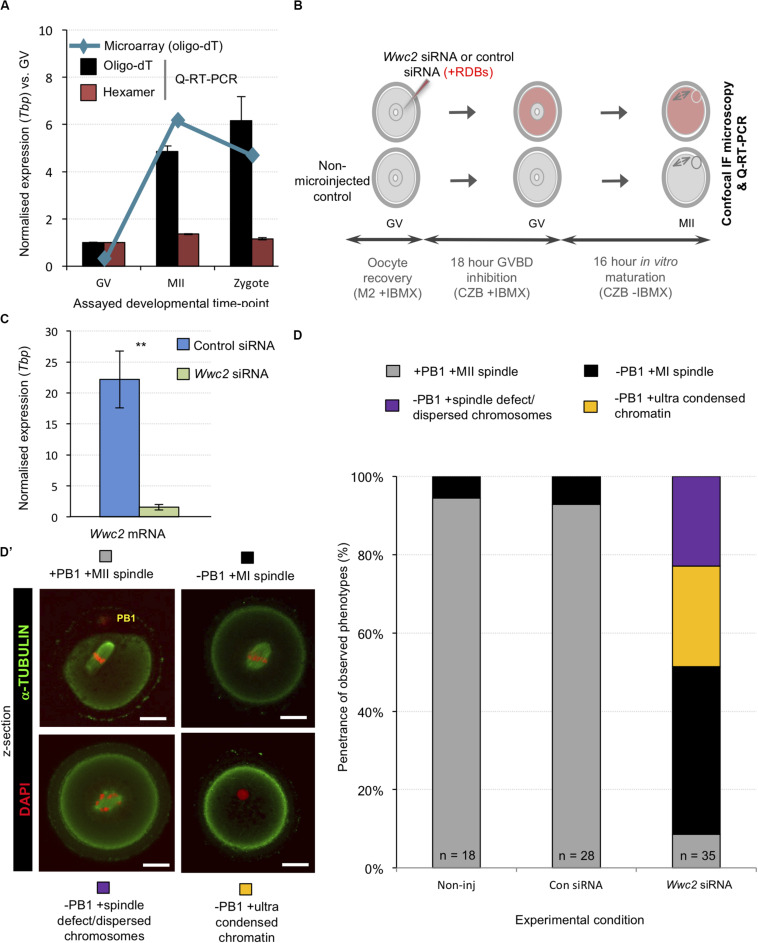
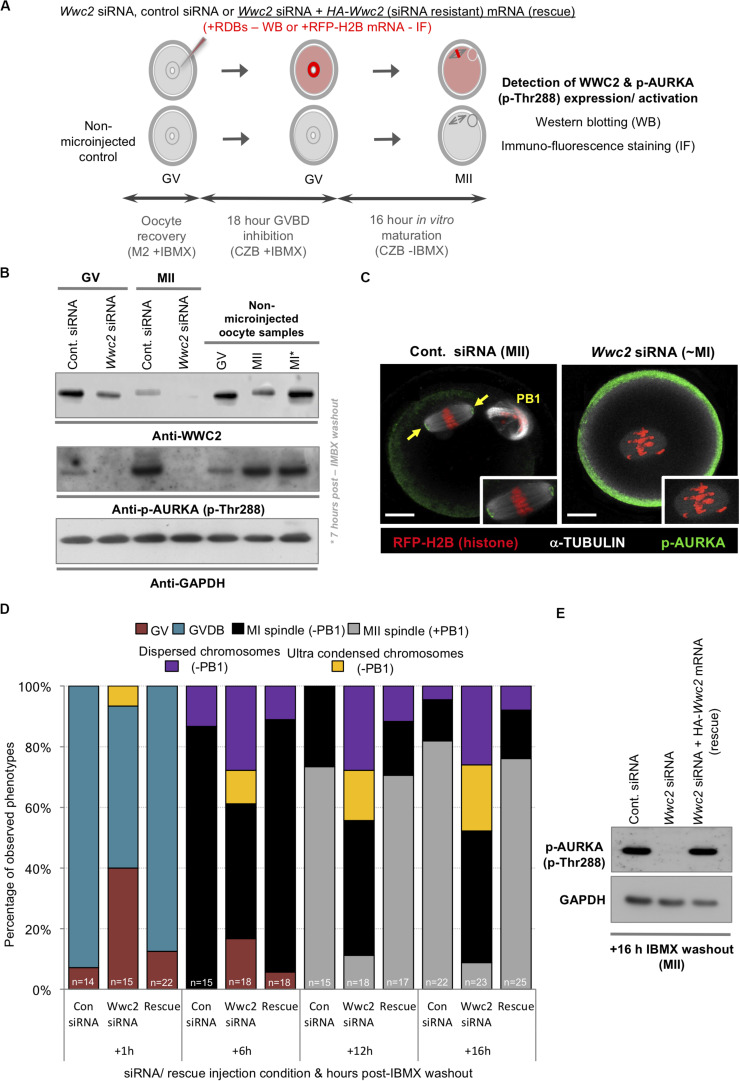
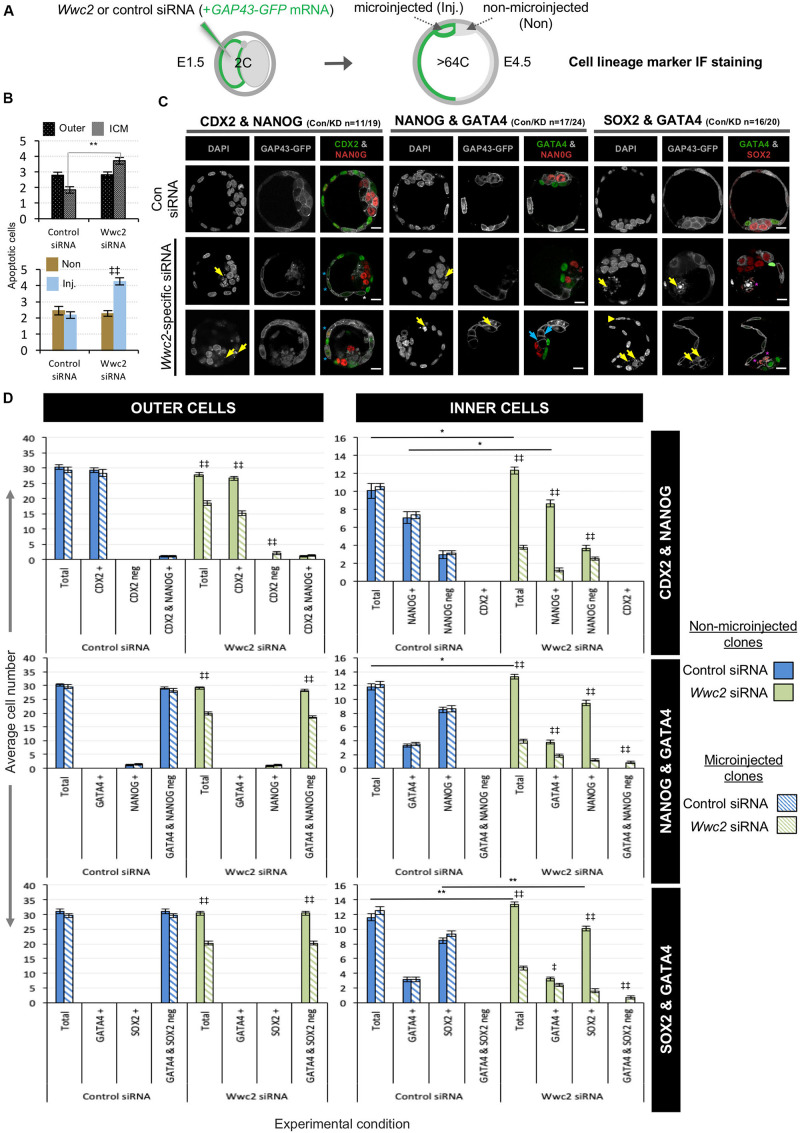
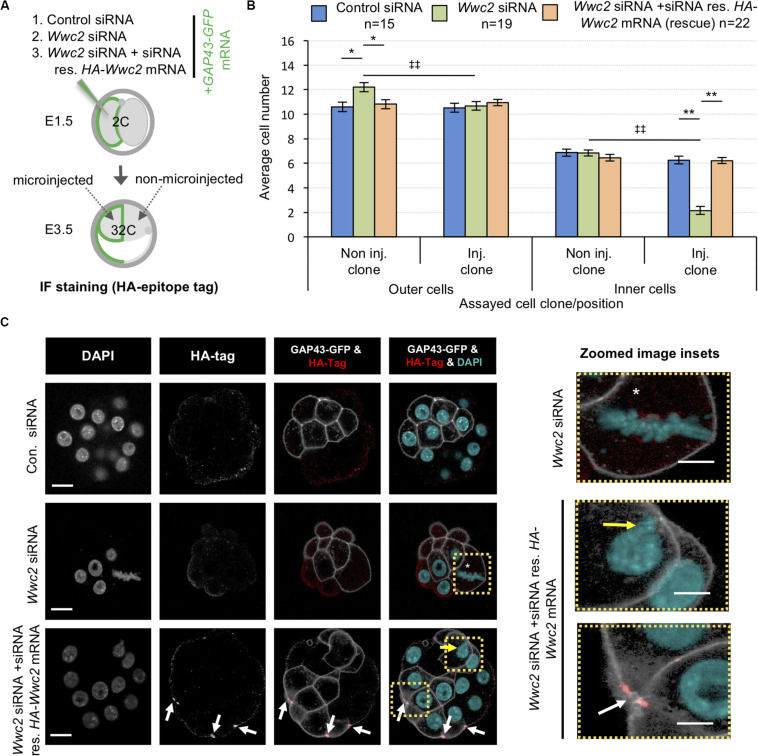
Formation of the hatching mouse blastocyst marks the end of preimplantation development, whereby previous cell cleavages culminate in the formation of three distinct cell lineages (trophectoderm, primitive endoderm and epiblast). We report that dysregulated expression of Wwc2, a genetic paralog of Kibra/Wwc1 (a known activator of Hippo-signaling, a key pathway during preimplantation development), is specifically associated with cell autonomous deficits in embryo cell number and cell division abnormalities. Division phenotypes are also observed during mouse oocyte meiotic maturation, as Wwc2 dysregulation blocks progression to the stage of meiosis II metaphase (MII) arrest and is associated with spindle defects and failed Aurora-A kinase (AURKA) activation. Oocyte and embryo cell division defects, each occurring in the absence of centrosomes, are fully reversible by expression of recombinant HA-epitope tagged WWC2, restoring activated oocyte AURKA levels. Additionally, clonal embryonic dysregulation implicates Wwc2 in maintaining the pluripotent epiblast lineage. Thus, Wwc2 is a novel regulator of meiotic and early mitotic cell divisions, and mouse blastocyst cell fate.

Keywords: blastocyst cell number; cell division; cell lineage decision; cell-fate; oocyte maturation; preimplantation mouse embryo.


Figures

FIGURE 1
FIGURE 1
siRNA mediated global Wwc2 knockdown causes persistent preimplantation embryo cell number deficits from the 8-cell stage. (A) Experimental design (relating to panels BD, E’); non-specific control (color coded blue), Kibra-specific (purple) or Wwc2-specific (green) siRNA was co-microinjected with rhodamine dextran conjugated beads (RDBs – injection marker) into both blastomeres of 2-cell stage (E1.5) mouse embryos. Microinjected embryos were in vitro cultured to the 32-cell stage (E3.5) and either processed for Q-RT-PCR, confocal immuno-fluorescent staining microscopy (assaying CDX2 expression and including a total cell assay count) or western blotting to assay WWC2 protein expression. (B) Q-RT-PCR analysis of global siRNA mediated knockdown of endogenous Kibra (left) and Wwc2 (right) mRNA at the 32-cell stage (error bars denote s.e.m. of triplicate measurements, n = 3, **p < 0.005). (C) Exemplar single z-stack micrographs of control, Kibra-specific and Wwc2-specific siRNA microinjected 2-cell stage embryos cultured to the 32-cell stage and immuno-fluorescently stained for CDX2 expression (CDX2 – cyan, RDBs –red and DNA/DAPI – white; merged images in lower panels). Magenta arrows denote micronuclei specifically observed in the Wwc2-siRNA microinjected group and blue and white asterisks outer cells with reduced or absent CDX2 protein expression, respectively; scale bar = 20μm. (D) Average total cell number in control, Kibra-specific or Wwc2-specific siRNA microinjected 2-cell embryos cultured to the 32-cell stage. (E) Similar analysis to panel (D), whereby control and Wwc2-specific siRNA microinjected 2-cell stage embryos were cultured to the indicated developmental stages and the average total cell number calculated (according to the stated experimental schema – upper panel). In panels (D,E) errors represent s.e.m. and 2-tailed student t-test derived statistical significance between control, Kibra KD and Wwc2 KD groups indicated (**p < 0.005); the number of embryos in each group is also indicated. Note, the 32-cell/E3.5 data in both panels is derived from the same analysis. (E’) Western blot confirming robust WWC2 protein expression knockdown in 2-cell stage Wwc2-specific siRNA microinjected embryos cultured to the 32-cell stage versus the control group. Quantification of the representative western blot (upper panels) is provided in chart form (lower panel) detailing the extent of normalized WWC2 protein knockdown observed. Supplementary Tables ST1–ST6 summarize statistical analyses and individual embryo data. Note, additional data describing frequencies of observable cell morphological/division defects, obtained from this same dataset are also presented in Figure 2 and Supplementary Figure S4.
FIGURE 2
FIGURE 2
Global Wwc2 knockdown mediated total embryo cell number deficits are associated with defective cell division morphologies. (A) Schematic of experimental design; 2-cell stage embryos microinjected with control or Wwc2-specific siRNA were cultured to indicated developmental stages, fixed and assayed for total cell number or the incidence of abnormal cell morphology indicative of defective cell division (determined by DAPI and rhodamine conjugated phalloidin staining – note, data derived from same experiments as those described in Figure 1). (B) Exemplar confocal micrograph z-sections of Wwc2-specific siRNA microinjected embryos at the 32-cell stage, illustrating three distinct phenotypic morphological defect categories observed; (i) abnormal nuclear morphology (including chromatin mid-body association, highlighted by yellow arrows – left), (ii) cytokinesis defects defined by two nuclei per cell (highlighted by blue arrow – center), (iii) presence of multiple nuclei and/or micronuclei per cell (> 3 highlighted by magenta arrows - right) and (iv) composite of categorized defects highlighted by color coded arrows in a single embryo confocal z-section projection (green boarder). DAPI (white) and cortical F-actin (red); scale bar = 20 μm. (C) Frequencies of each observed category of phenotypic/morphological defect (i.e., micronuclei; blue, abnormal nuclei; yellow and failed cytokinesis; green) or a combination of at least two or more (red) in control siRNA and Wwc2-specific siRNA microinjected embryos, at indicated developmental stages (numbers of embryos in each group highlighted, see amalgamated data – red); data demonstrate defect incidence per embryo (in at least one constituent blastomere). Supplementary Tables ST1–ST6 summarize statistical analysis and individual embryo data in each experimental group. Supplementary Figure S4 also details the same data represented as defect incidence per blastomere/cell assayed in all embryos of each group.
FIGURE 3
FIGURE 3
Wwc2 mRNA is required for mouse oocyte meiotic maturation. (A) Published microarray (Wang et al., 2004, blue line) and generated Q-RT-PCR (bar charts) normalized Wwc2 mRNA expression in germinal vesicle and metaphase II arrested oocytes (GV and MII) and fertilized zygotes (Tbp normalized expression, relative to GV stage). Note, microarray data derived from oligo-dT primed reverse transcription and Q-RT-PCR from both oligo-dT (black bars) and random hexamer priming (red bars); error bars represent s.e.m. and n = 3. (B) Experimental schema of Wwc2 knockdown in GV oocytes by microinjected Wwc2 siRNA (plus control siRNA and non-microinjected controls), 18 h incubation in IMBX containing media (preventing GVBD), 16 h in vitro oocyte maturation (IVM – minus IMBX) and confocal microscopy or Q-RT-PCR analysis; co-microinjected RDBs used as injection control marker. (C) Q-RT-PCR data of normalized (against Tbp) Wwc2 mRNA levels in control and Wwc2 siRNA microinjected GV oocytes after IVM to the MII equivalent stage (error bars represent s.e.m., n = 3 and **p < 0.005 in 2-tailed student t-test). (D) Charts detailing successful IVM frequencies of control non-microinjected (Non-inj), microinjected control siRNA (Con siRNA) and microinjected Wwc2 siRNA GV oocytes, to the MII stage or indicated phenotypic stages. (D’) Examples of successfully matured MII oocytes (note, extruded first polar body/PB1) and the observed and quantified categorized phenotypes shown as confocal z-section micrographs (α-Tubulin in green and DAPI DNA pseudo-colored red; scale bar = 20 μm). Supplementary Figure S5 details the complete confocal z-series of the illustrative oocyte examples shown in panel (D’). Supplementary Table ST14 summarize statistical analysis and individual oocyte data used to generate the figure.
FIGURE 4
FIGURE 4
Wwc2 knockdown induced oocyte IVM phenotypes are associated with failed Aurora-A (AURKA) phosphorylation/activation (rescuable by co-microinjection of siRNA resistant HA-Wwc2 mRNA). (A) Experimental schema of GV oocyte microinjection conditions; i.e., Wwc2 siRNA or control siRNA alone or Wwc2 siRNA + HA-Wwc2 (siRNA resistant) mRNA (i.e., ‘rescue’) were co-microinjected with RDBs (for western blot analysis) or RFP-H2B mRNA (fluorescent marker in IF staining). Microinjected (plus non-microinjected control) oocytes incubated in IMBX containing media (18 h – to prevent GVBD), subject to IVM (max. 16 h – media minus IMBX) and processed for western blotting and IF at designated oocyte maturation time-points (assaying WWC2 and phospho-Aurora/p-AURKA levels) or assayed for Wwc2 KD induced developmental progression phenotypes. (B) Western blots of WWC2 and activated p-AURKA protein levels (plus GAPDH housekeeping control), at indicated stages of oocyte maturation (note, GV; +0 h relative to IMBX washout, metaphase of meiosis I/MI; +7 h and MII; +16 h), in either control or Wwc2 siRNA microinjected, or non-microinjected conditions. (C) Exemplar single confocal z-section IF micrographs of control (left) or Wwc2 siRNA (right) IVM cultured microinjected oocytes at the MII equivalent stage (16 h post-IBMX) stained for p-AURKA (green) and α-TUBULIN (white) and labeled with RFP-H2B chromatin reporter (red); insets show zoomed region of meiotic spindle. Note, Wwc2 siRNA microinjection group example image is over-saturated compared to control (to illustrate lack of spindle associated pAURKA – cortical signal is auto-fluorescence); PB1 (control siRNA) denotes extruded first polar body and the scale bars = 20 μm. (D) Charts detailing IVM rates of control siRNA, Wwc2 siRNA and Wwc2 siRNA + HA-Wwc2 mRNA (rescue) microinjected oocytes at staged time-points post IBMX removal; as described by percentage of oocytes at any of stated IVM stages or categorized developmental phenotypes (typically associated with Wwc2 KD – see Figure 3); number of oocytes in each experimental condition at each assayed IVM stage is indicated. (E) Western blot of activated p-AURKA levels (plus GAPDH housekeeping control) at MII equivalent stage (16 h post-IVM), in control siRNA, Wwc2 siRNA or Wwc2 siRNA + HA-Wwc2 mRNA microinjected (rescue) oocytes. Supplementary Tables ST16–ST19 summarize statistical analysis and individual oocyte data used to generate the figure.
FIGURE 5
FIGURE 5
Blastocyst cell lineage formation after clonal Wwc2 gene knockdown. (A) Experimental strategy for Wwc2 expression knockdown in marked clones (representing 50% of the embryo) by co-microinjection (in one blastomere of 2-cell stage embryos) of Wwc2 siRNA and GAP43-GFP mRNA (stable plasma membrane fluorescent injection clone marker/lineage marker – microinjected/Inj.) and an IF based assay of clonal contribution (Inj. versus non-microinjected/Non) to blastocyst protein lineage marker expressing cells (TE; CDX2, PrE; GATA4, EPI; NANOG or SOX2; assayed in combination – see below) in outer and inner-cell embryo populations, at the late blastocyst/E4.5 stage (versus control siRNA microinjections). (B) Average number of apoptotic cells in control and Wwc2 siRNA microinjected embryo groups (averaged across all IF regimes – see below) in outer and inner cell populations and clones (Inj. versus Non); errors represent s.e.m. and 2-tailed student t-test derived statistical significance between control and Wwc2 KD groups (asterisks) or clones (Inj. versus Non) within a group (double crosses) highlighted with statistical confidence intervals of p < 0.05 and p < 0.005 (denoted by one or two significance markers, respectively). (C) Exemplar confocal z-section micrographs of IF stained blastocysts (individual greyscale channels plus merged images, in which assayed combinations of cell lineage markers are respectively colored green and red; CDX2 & NANOG, GATA4 & NANOG and GATA4 and SOX2) from control and Wwc2 siRNA microinjected groups. Within the Wwc2 siRNA microinjected clone, yellow arrows denote apoptotic cell remnants, blue arrows interphase ICM cells that neither express GATA4 or NANOG, the yellow arrow head a bi-nucleated cell whereas blue or white asterisks highlight outer-cells with basal or undetectable CDX2 expression, respectively and magenta asterisks denote apoptotic ICM cells that IF stain for SOX2. The number of assayed embryos in each control (Con) and Wwc2 siRNA (KD) microinjection group is provided; scale bar = 20μm. (D) The average number of cells contributing to populations expressing, co-expressing or not expressing the stated combinations of late blastocyst lineage marker proteins, their designated clonal origin (microinjected versus non-microinjected) and relative distribution between outer and ICM compartments in both control and Wwc2 siRNA microinjected embryos; errors represent s.e.m. and 2-tailed student t-test derived statistical significance between the control and Wwc2 knockdown groups (asterisks – note, for simplicity only potential regulative differences between the non-microinjected clones are shown; see Supplementary Tables for full statistical summary) or clones (microinjected versus non-microinjected) within a group (double crosses) are highlighted with statistical confidence intervals of p < 0.05 and p < 0.005 (denoted by one or two significance markers, respectively). Supplementary Tables ST20–ST22 summarize the statistical analysis and individual embryo data in each experimental group. Note a similar analysis of CDX2 expression at the early-blastocyst/E3.5 stage is provided in Supplementary Figure S10.
FIGURE 6
FIGURE 6
Expression of siRNA resistant HA-Wwc2 mRNA rescues Wwc2 siRNA induced embryo cell number/division phenotypes. (A) Experimental strategy for potential phenotypic rescue of clonal Wwc2 KD by comparing co-microinjection (in one blastomere of 2-cell stage embryos) of GAP43-GFP mRNA (stable plasma membrane fluorescent microinjection marker to distinguish from the non-microinjected clone) with control siRNA, Wwc2 siRNA or Wwc2 siRNA + recombinant HA-Wwc2 mRNA (containing N-terminal HA-epitope tag and point mutants conferring siRNA resistance – see Supplementary Figure S8) and assaying total, outer and inner-cell number at the 32-cell blastocyst stage. (B) Average clonal contribution (microinjected/Inj. versus non-microinjected/Non inj.) of outer and ICM/inner cells in control siRNA (blue bars), Wwc2 siRNA (green bars) and Wwc2 siRNA + HA-Wwc2 mRNA (rescue – orange bars) microinjected embryos; errors represent s.e.m. and 2-tailed student t-test derived statistical significance between the experimental groups (asterisks), or clones within a group (double crosses) highlighted with statistical confidence intervals of p < 0.05 and p < 0.005 (denoted by one or two significance markers, respectively). The number of embryos in each experimental group is provided. (C) Exemplar confocal z-section micrographs of 32-cell blastocyst stage embryos, derived from the indicated microinjection groups, IF stained to detect HA-epitope tag expression (individual greyscale channels, plus merged images were the anti-HA channel is red and the DAPI cyan). Within the microinjected clone of the Wwc2 siRNA treated embryo, the white asterisk denotes characteristic abnormal mitosis, whilst in the microinjected clone of the Wwc2 siRNA + HA-Wwc2 rescue embryo example the white arrows indicate anti-HA epitope tag IF signal associated with mid-bodies and the yellow arrow the single incidence of any persisting nuclear abnormality (see also indicated zoomed images - right); scale bar = 20μm. Supplementary Table ST24 summarise statistical analysis and individual embryo data used to generate the figure.

Similar articles

Cited by

References

    1. Asteriti I. A., De Mattia F., Guarguaglini G. (2015). Cross-talk between AURKA and Plk1 in mitotic entry and spindle assembly. Front. Oncol. 5:283. - PMC - PubMed
    1. Baumgartner R., Poernbacher I., Buser N., Hafen E., Stocker H. (2010). The WW domain protein Kibra acts upstream of Hippo in Drosophila. Dev. Cell 18 309–316. 10.1016/j.devcel.2009.12.013 - DOI - PubMed
    1. Bennabi I., Terret M. E., Verlhac M. H. (2016). Meiotic spindle assembly and chromosome segregation in oocytes. J. Cell Biol. 215 611–619. 10.1083/jcb.201607062 - DOI - PMC - PubMed
    1. Bettencourt-Dias M., Rodrigues-Martins A., Carpenter L., Riparbelli M., Lehmann L., Gatt M. K., et al. (2005). SAK/PLK4 is required for centriole duplication and flagella development. Curr. Biol. 15 2199–2207. 10.1016/j.cub.2005.11.042 - DOI - PubMed
    1. Bolton H., Graham S. J. L., Van Der Aa N., Kumar P., Theunis K., Fernandez Gallardo E., et al. (2016). Mouse model of chromosome mosaicism reveals lineage-specific depletion of aneuploid cells and normal developmental potential. Nat. Commun. 7:11165. - PMC - PubMed