. 2020 Sep;8(9):e2019EF001474.
doi: 10.1029/2019EF001474. Epub 2020 Sep 20.

Regional Climate Sensitivity of Climate Extremes in CMIP6 Versus CMIP5 Multimodel Ensembles

Affiliations

Regional Climate Sensitivity of Climate Extremes in CMIP6 Versus CMIP5 Multimodel Ensembles

Sonia I Seneviratne et al. Earths Future. 2020 Sep.

Abstract

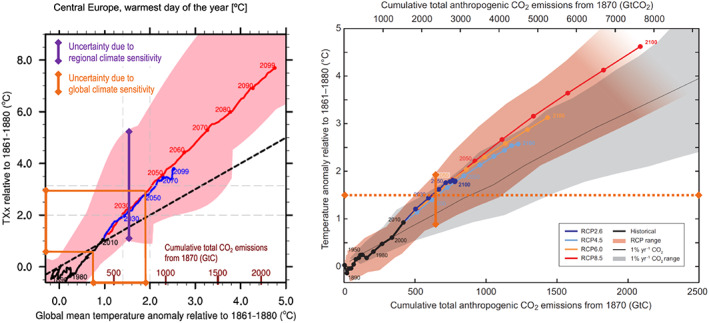
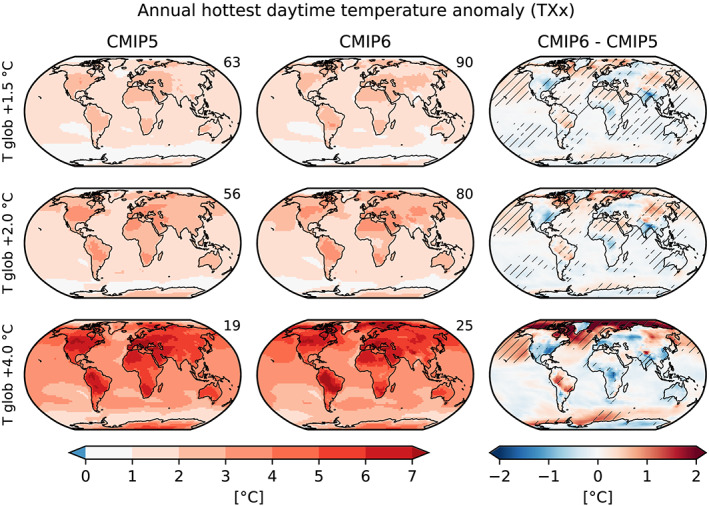
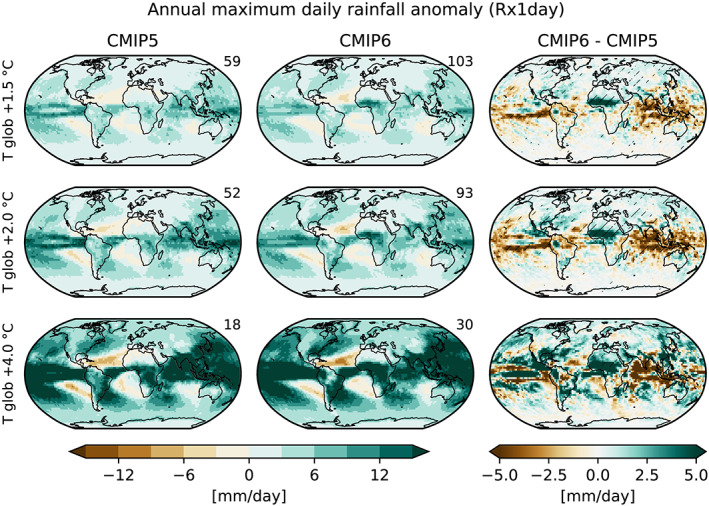
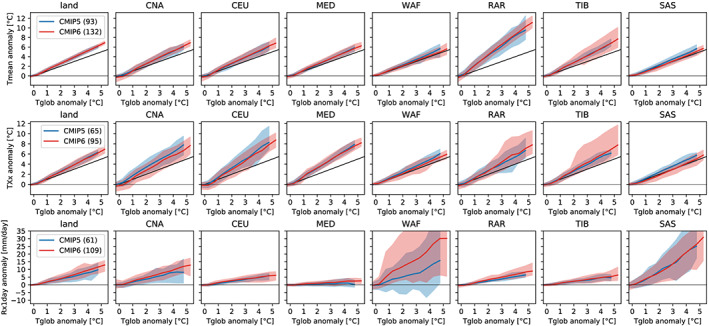
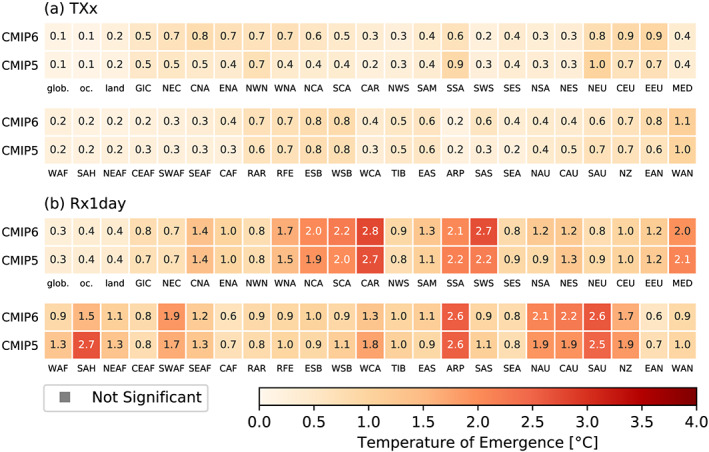
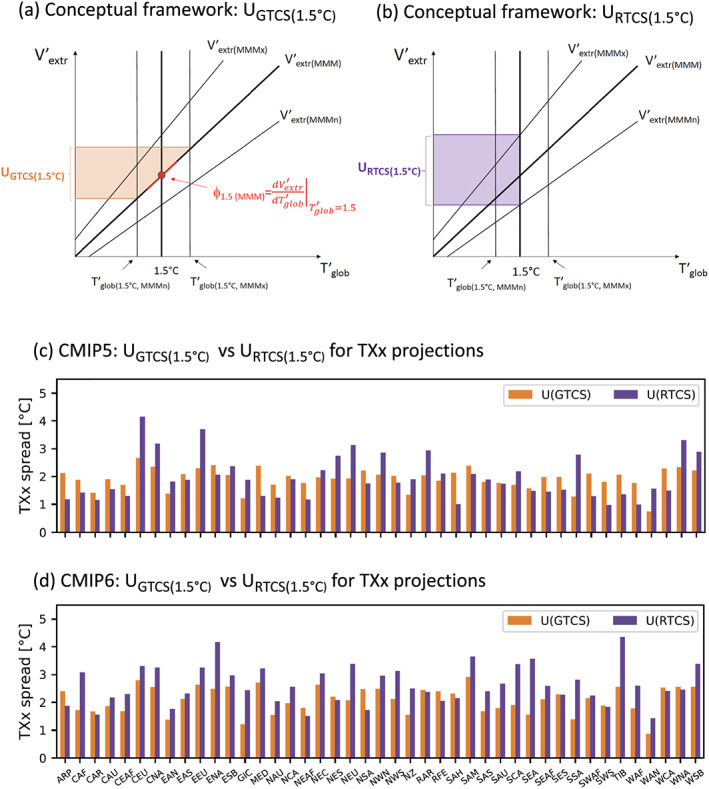
We analyze projected changes in climate extremes (extreme temperatures and heavy precipitation) in the multimodel ensembles of the fifth and sixth Coupled Model Intercomparison Projects (CMIP5 and CMIP6). The results reveal close similarity between both ensembles in the regional climate sensitivity of the projected multimodel mean changes in climate extremes, that is, their projected changes as a function of global warming. This stands in contrast to widely reported divergences in global (transient and equilibrium) climate sensitivity in the two multimodel ensembles. Some exceptions include higher warming in the South America monsoon region, lower warming in Southern Asia and Central Africa, and higher increases in heavy precipitation in Western Africa and the Sahel region in the CMIP6 ensemble. The multimodel spread in regional climate sensitivity is found to be large in both ensembles. In particular, it contributes more to intermodel spread in projected regional climate extremes compared with the intermodel spread in global climate sensitivity in CMIP6. Our results highlight the need to consider regional climate sensitivity as a distinct feature of Earth system models and a key determinant of projected regional impacts, which is largely independent of the models' response in global climate sensitivity.

Keywords: CMIP5; CMIP6; climate extremes; climate models; climate projections; regional climate sensitivity.


Figures

Figure 1
Figure 1
(left) Regional climate sensitivity of changes in annual hottest daytime temperature (TXx) in Central Europe (CEU, see Supporting Information, Figure S1) in the fifth phase of the Coupled Model Intercomparison Project (CMIP5), derived from empirical scaling relationships (ESRs) as a function of global warming (source: Seneviratne et al. 2016). The blue (red) line indicates the multimodel mean of the RCP4.5 (RCP8.5) CMIP5 simulations. The spread in the ESR response at +1.5°C of global warming is shown in violet and spans approximately 4°C (from 0.91°C to 5.06°C, see Table S1). The regional CEU spread in TXx resulting from the uncertainty in global (transient) climate sensitivity (also termed global transient response) based on the IPCC AR5 (see right‐hand panel) is indicated in dark orange and spans about 2.5°C. (right) Global mean surface temperature increases as a function of cumulative total global CO2 emissions from various lines of evidence (source: Figure SPM.10 of IPCC AR5 working group 1 report (IPCC, 2013), based on the CMIP5 ensemble; modification: dark orange lines indicate the response at +1.5°C of global warming and the respective spread in the CMIP5 RCP simulations). The figure shows multimodel results from a hierarchy of climate‐carbon cycle models for each RCP until 2100 with colored lines and decadal means (dots). For more details, see referenced publications.
Figure 2
Figure 2
Anomalies in the annual hottest daytime temperature (TXx) compared with preindustrial (1850–1900) conditions for different global warming levels (rows) in CMIP5 (left column), CMIP6 (center column), and the CMIP6‐CMIP5 differences (right column). Statistically significant differences are hatched. The number in the top right corner of the panels indicate the number of ensemble members used.
Figure 3
Figure 3
Absolute anomalies in the annual maximum daily rainfall (Rx1day) compared with preindustrial (1850–1900) conditions for different global warming levels (rows) in CMIP5 (left column), CMIP6 (center column), and the CMIP6‐CMIP5 differences (right column). Statistically significant differences are hatched.
Figure 4
Figure 4
Scaling of annual mean temperature (Tmean, top row), annual hottest daytime temperature (TXx, middle row), and annual maximum daily rainfall (Rx1day, bottom row), with global mean temperature for a selection of AR6 land regions (see Supporting Information for plots for all regions). Shown are the CMIP5 and CMIP6 multimodel mean and their range (minimum to maximum value from all available ESMs) for the regions “land” (land average), central North America (CNA), Central Europe (CEU), Mediterranean (MED), Western Africa (WAF), Russian Arctic (RAR), Tibetan Plateau (TIB), and Southern Asia (SAS). See Figure S1 for a definition of the regions.
Figure 5
Figure 5
Global temperature of emergence of signal in regional climate extremes (a) TXx and (b) Rx1day for regions of Figure  S1. The colored squares indicate the multimodel mean global warming level at which a difference in response compared with preindustrial conditions (1850–1900, see section 2.4) is statistically significant. Note that the lowest tested warming level is 0.1°C.
Figure 6
Figure 6
Comparison of uncertainty in projections of regional climate extremes resulting from global transient climate sensitivity UGTCS and regional transient climate sensitivity U RTCS +1.5°C of global warming. (a,b) Conceptual framework for computation of U GTCS (a) and U RTCS (b) for anomalies in a given climate extreme V′extr as function of global warming T′ glob; see text for details. (c,d) Regional values of U GTCS (orange) and U RTCS (violet) in CMIP5 (c) and CMIP6 (d). See Figure S1 for regions.

References

    1. Benjamini, Y. , & Hochberg, Y. (1995). Controlling the false discovery rate—A practical and powerful approach to multiple testing. Journal of the Royal Statistical Society Series B‐Methodological, 57(1), 289–300.
    1. Cox, P. M. , Huntingford, C. , & Williamson, M. S. (2018). Emergent constraint on equilibrium climate sensitivity from global temperature variability. Nature, 553(7688), 319–322. 10.1038/nature25450 - DOI - PubMed
    1. Donat, M. G. , Pitman, A. J. , & Angélil, O. (2018). Understanding and reducing future uncertainty in midlatitude daily heat extremes via land surface feedback constraints. Geophysical Research Letters, 45, 10,627–10,636. 10.1029/2018GL079128 - DOI
    1. Eyring, V. , Bony, S. , Meehl, G. A. , Senior, C. A. , Stevens, B. , Stouffer, R. J. , & Taylor, K. E. (2016). Overview of the coupled model intercomparison project phase 6 (CMIP6) experimental design and organization. Geoscientific Model Development, 9(5), 1937–1958. 10.5194/gmd-9-1937-2016 - DOI
    1. Forster, P. M. , Maycock, A. C. , McKenna, C. M. , & Smith, C. J. (2019). Latest climate models confirm need for urgent mitigation. Nature Climate Change, 10, 7–10. 10.1038/s41558-019-0660-0 - DOI

LinkOut - more resources