. 2020 Oct 23;23(10):101645.
doi: 10.1016/j.isci.2020.101645. Epub 2020 Oct 5.

SARS-CoV-2 Infection Dysregulates the Metabolomic and Lipidomic Profiles of Serum

Affiliations

SARS-CoV-2 Infection Dysregulates the Metabolomic and Lipidomic Profiles of Serum

Chiara Bruzzone et al. iScience. .

Abstract

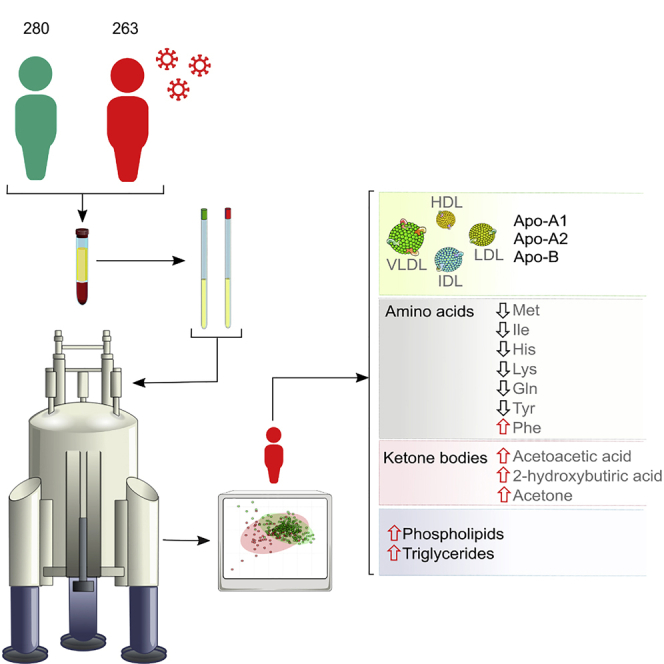
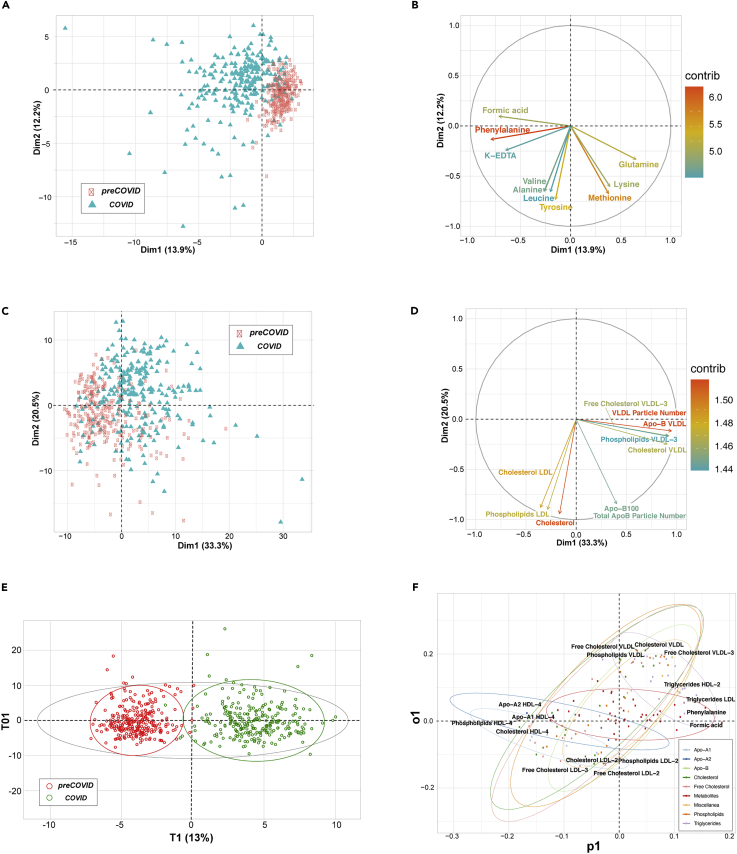
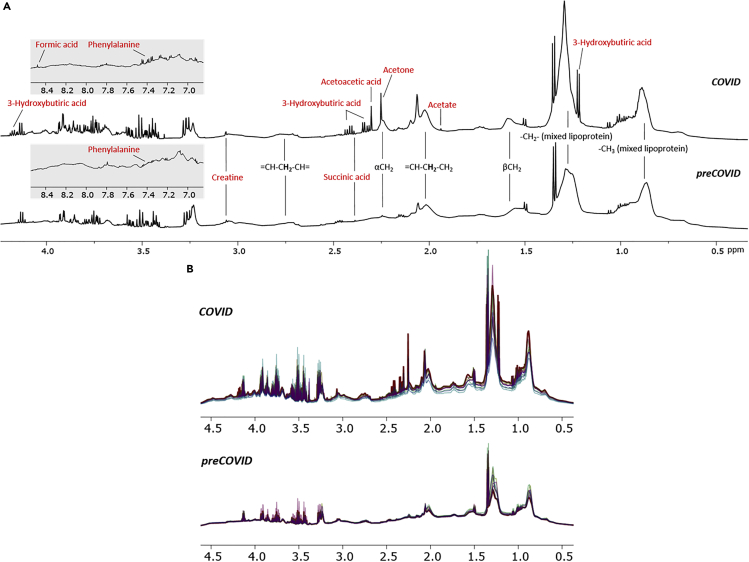
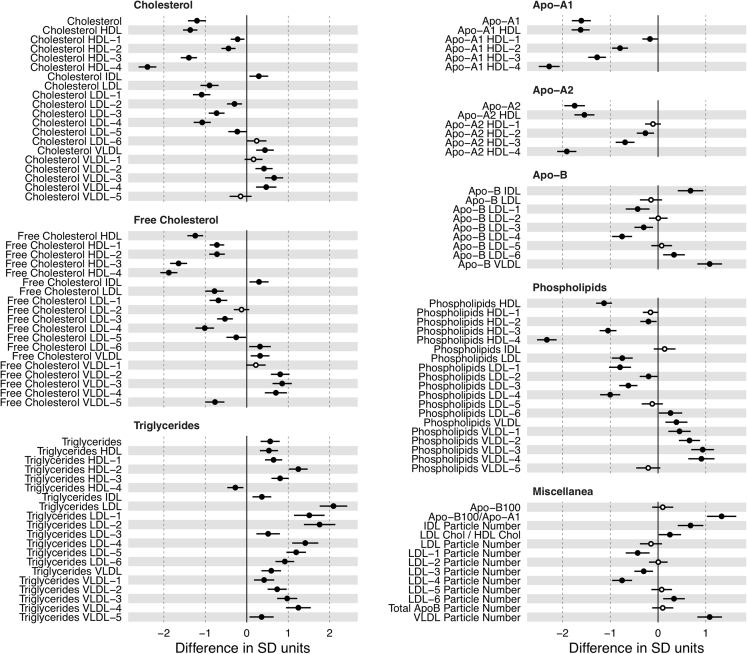
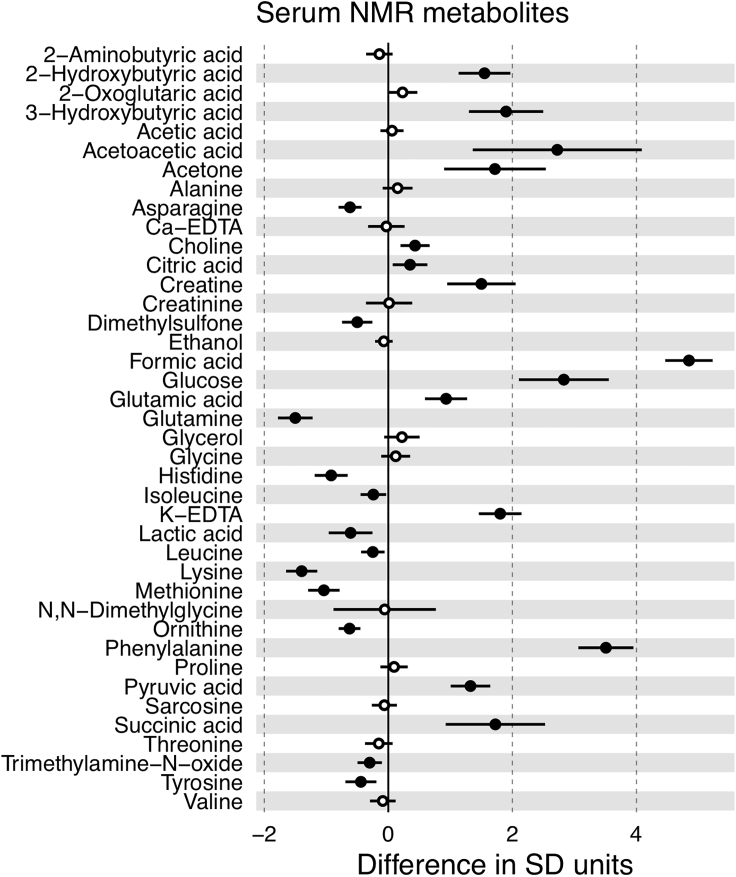
COVID-19 is a systemic infection that exerts significant impact on the metabolism. Yet, there is little information on how SARS-CoV-2 affects metabolism. Using NMR spectroscopy, we measured the metabolomic and lipidomic serum profile from 263 (training cohort) + 135 (validation cohort) symptomatic patients hospitalized after positive PCR testing for SARS-CoV-2 infection. We also established the profiles of 280 persons collected before the coronavirus pandemic started. Principal-component analysis discriminated both cohorts, highlighting the impact that the infection has on overall metabolism. The lipidomic analysis unraveled a pathogenic redistribution of the lipoprotein particle size and composition to increase the atherosclerotic risk. In turn, metabolomic analysis reveals abnormally high levels of ketone bodies (acetoacetic acid, 3-hydroxybutyric acid, and acetone) and 2-hydroxybutyric acid, a readout of hepatic glutathione synthesis and marker of oxidative stress. Our results are consistent with a model in which SARS-CoV-2 infection induces liver damage associated with dyslipidemia and oxidative stress.

Keywords: Human Metabolism; Metabolomics; Virology.


Conflict of interest statement

The authors declare no competing interests.

Figures

None
Graphical abstract
Figure 2
Figure 2
Summary of Multivariate Unsupervised (PCA) and Supervised (OPLS-DA) Analyses (A and C) Score plots representing first two principal components from PCA of serum metabolites (A) and lipoprotein subclasses (C), colored by cohort. Each axis indicates the percentage of total variability explained by the component. (B and D) Loading plots from serum metabolites PCA (B) and lipoprotein subclasses PCA (D). They show the top 10 variables with the highest contribution to the first two PCA components. Their direction indicates how their weight is distributed in both components, and the color is the percentage of contribution. (E) Score plot from OPLS-DA between COVID (green) and preCOVID (red) cohorts, using the full list of metabolites and lipoprotein subclasses. The plot shows the main component versus the first orthogonal component. (F) Loading plot from the previous OPLS-DA. Each type of variable (metabolites or the lipoprotein subclasses) is represented with different colors. For each type, ellipses surround the area that includes 95% of their members. For each direction, the four variables that most contribute to the component are labeled.
Figure 1
Figure 1
Representative Region of 1H NMR Spectra of COVID and preCOVID Sera (A) Metabolite identification in sera spectrum from COVID positive and preCOVID. For instance, notice the increased amount of ketone bodies (3-hydroxybutiric acid, acetoacetic acid, acetone) in the COVID-positive spectrum when compared with the preCOVID one. (B) Overlapped nuclear Overhauser effect spectra from COVID-positive and preCOVID serum samples.
Figure 3
Figure 3
Average Effect of COVID-19 for Each Lipoprotein Subclass Horizontal axis is the number of standard deviations that a variable is on average increased (or decreased) when an individual is positive for COVID-19. Circles are positioned in the specific mean increase (decrease) value, whereas horizontal black bars are the 95% confidence interval. Statistically significant differences (p value < 0.05) are represented with filled circles.
Figure 4
Figure 4
Average Effect of COVID-19 for Each Metabolite Horizontal axis is the number of standard deviations that a variable is on average increased (or decreased) when an individual is positive for COVID-19. Circles are positioned in the specific mean increase (decrease) value, whereas horizontal black bars are the 95% confidence interval. Statistically significant differences (p value < 0.05) are represented with filled circles.

References

    1. Al-Ani F., Chehade S., Lazo-Langner A. Thrombosis risk associated with COVID-19 infection. A scoping review. Thromb. Res. 2020;192:152–160. - PMC - PubMed
    1. Connors J.M., Levy J.H. COVID-19 and its implications for thrombosis and anticoagulation. Blood. 2020;135:2033–2040. - PMC - PubMed
    1. Chapman M.J., Goldstein S., Lagrange D., Laplaud P.M. A density gradient ultracentrifugal procedure for the isolation of the major lipoprotein classes from human serum. J. Lipid Res. 1981;22:339–358. - PubMed
    1. Embade N., Mariño Z., Diercks T., Cano A., Lens S., Cabrera D., Navasa M., Falcón-Pérez J.M., Caballería J., Castro A. Metabolic characterization of advanced liver fibrosis in HCV patients as studied by serum 1H-NMR spectroscopy. PLoS One. 2016;11:e0155094. - PMC - PubMed
    1. Feingold KR G.C. MDText.com, Inc; 2018. Introduction to Lipids and Lipoproteins.