. 2020 Oct 12:9:e59699.
doi: 10.7554/eLife.59699.

Rapid purification and metabolomic profiling of synaptic vesicles from mammalian brain

Affiliations

Rapid purification and metabolomic profiling of synaptic vesicles from mammalian brain

Lynne Chantranupong et al. Elife. .

Abstract

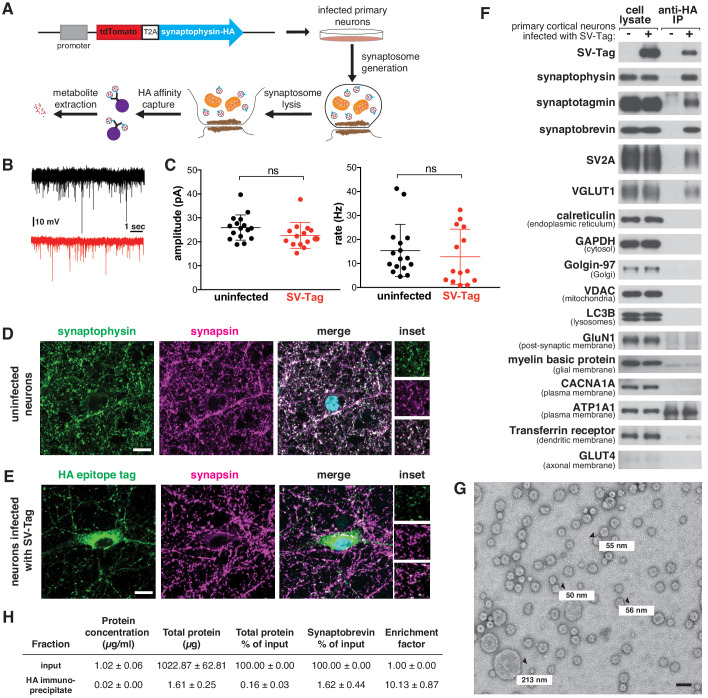
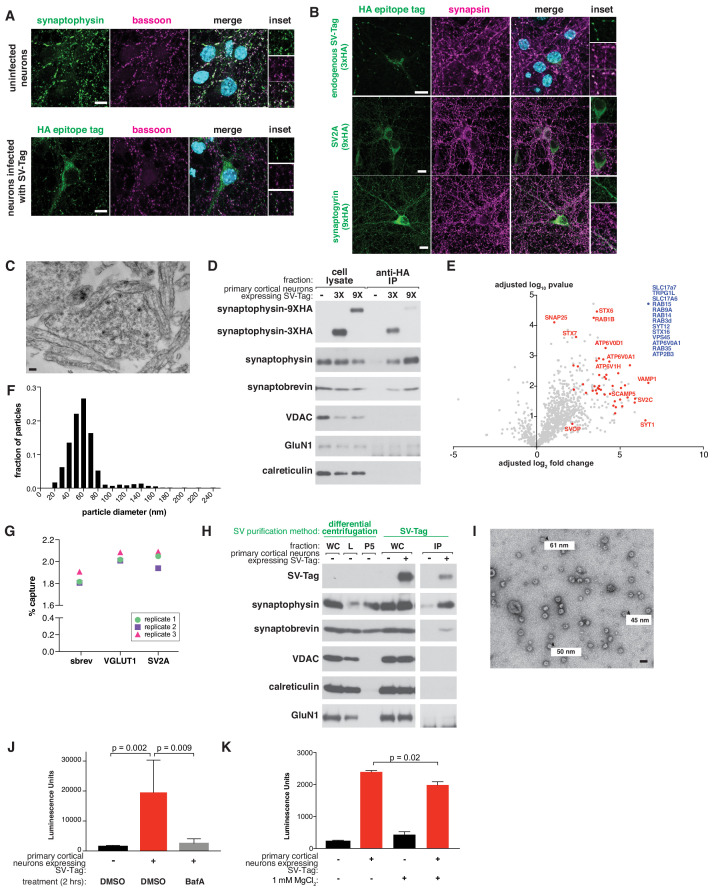
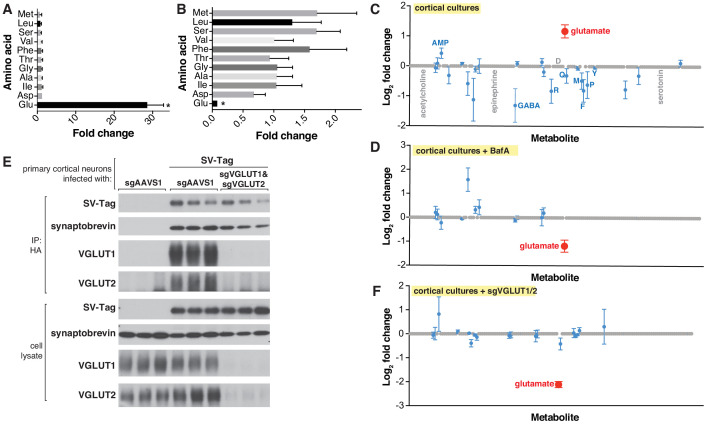
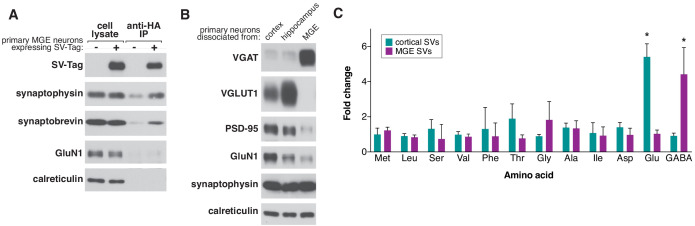
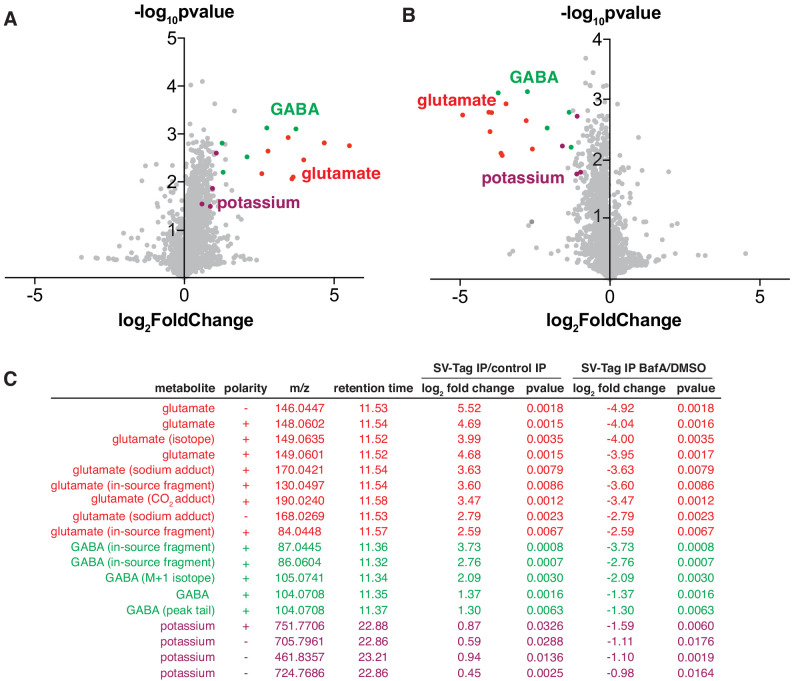
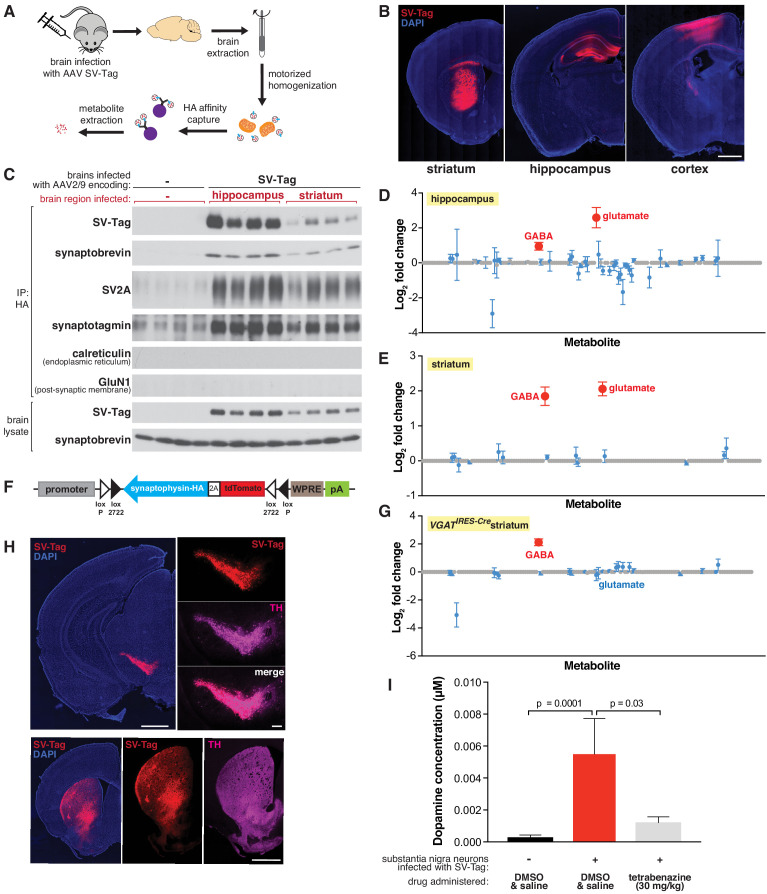
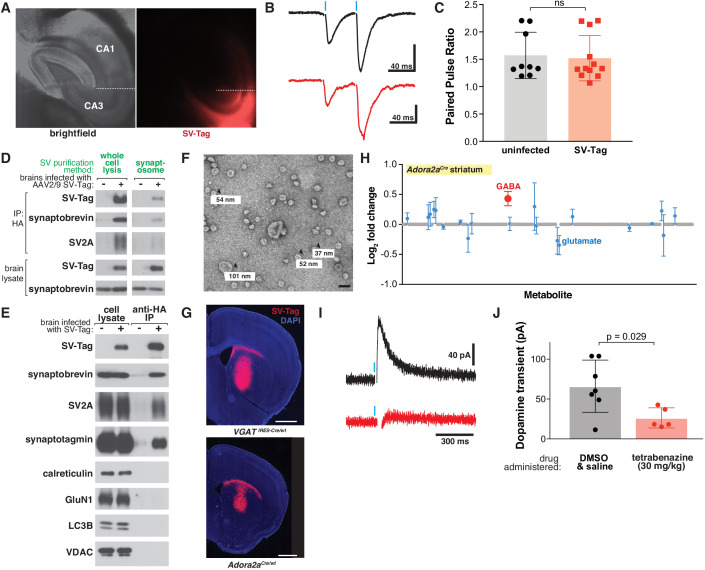
Neurons communicate by the activity-dependent release of small-molecule neurotransmitters packaged into synaptic vesicles (SVs). Although many molecules have been identified as neurotransmitters, technical limitations have precluded a full metabolomic analysis of SV content. Here, we present a workflow to rapidly isolate SVs and to interrogate their metabolic contents at high-resolution using mass spectrometry. We validated the enrichment of glutamate in SVs of primary cortical neurons using targeted polar metabolomics. Unbiased and extensive global profiling of SVs isolated from these neurons revealed that the only detectable polar metabolites they contain are the established neurotransmitters glutamate and GABA. In addition, we adapted the approach to enable quick capture of SVs directly from brain tissue and determined the neurotransmitter profiles of diverse brain regions in a cell-type-specific manner. The speed, robustness, and precision of this method to interrogate SV contents will facilitate novel insights into the chemical basis of neurotransmission.

Keywords: metabolomics; mouse; neuroscience; neurotransmitters; synaptic vesicle.


Conflict of interest statement

LC, JS, WW, DJ, MP, BS No competing interests declared

Figures

Figure 1.
Figure 1.. A method for rapid and specific isolation of synaptic vesicles (SVs) from mouse primary cortical cultures.
(A) Construct design for tagging SVs and schematic of the workflow used to isolate SVs. (B) Representative traces of mEPSCs in uninfected neurons (black) and neurons infected with SV-tag (red). (C) Summary of the average amplitude (± standard deviation (std) and rate of mEPSCs in uninfected neurons and neurons infected with SV-tag (Vhold = −70 mV, 1 µM TTX, 10 µM gabazine)). Non-significant p-value = n.s. (D) Immunostaining of uninfected primary neurons for endogenous synaptophysin (green) and synapsin (magenta). Cyan in the merged image represents DAPI-stained nuclei. Insets show selected fields that were magnified 1.6X. Scale bars: 10 µm. (E) Immunostaining of infected primary neurons expressing SV-tag (green) and synapsin (magenta) in. Insets show selected fields that were magnified 1.6X. Scale bars: 10 µm. (F) Immunoblot analysis of protein markers for SVs and indicated subcellular compartments and membranes in whole-cell lysates, purified SVs, and control immunoprecipitates. Lysates were prepared from neurons infected with lentivirus encoding SV-tag. 0.4% of the lysate and 5% of the immunoprecipitates were loaded into the indicated lane. (G) Electron microscope image of vesicles isolated with the workflow. Values denote diameter of indicated particles, specified by black arrows. Scale bar: 100 nm (H) Table summarizing the relative enrichment of synaptobrevin in the final immunoisolate from SV-tagged neurons, as assessed by quantitative immunoblotting. Values represent the mean ± std of three biological replicates. Source data is included (Figure 1—source data 1).
Figure 1—figure supplement 1.
Figure 1—figure supplement 1.. Characterization of synaptic vesicles isolated from mouse primary cortical cultures.
(A) Immunostaining of bassoon (magenta) in uninfected primary neurons (top panel) and neurons expressing SV-tag (green) (bottom panel). Cyan in merged image represents DAPI-stained nuclei. Insets show selected fields that were magnified 1.5X. Scale bars: 10 µm. (B) Immunostaining of primary neurons expressing indicated HA-tagged proteins (green) and endogenous synapsin (magenta). Specifically, neurons are expressing endogenously tagged synaptophysin with a triple HA-tag (top row), SV2A tagged at the N-terminus with nine tandem HA-tags (9x HA) (middle row), and synaptogyrin tagged at the N-terminus with a 9X HA-tag (bottom row). Insets show selected fields that were magnified 1.7X (top row) and 1.35X (middle and bottom row). Scale bars, 10 µm. (C) Electron microscope image of synaptosomes generated with the workflow. Scale bar, 100 nm. (D) Immunoblot analysis of the effect of the number of HA-tags on the efficiency of SV isolation. Lysates were prepared from neurons infected with lentivirus encoding for synaptophysin conjugated to three HA-tags (3X) or nine HA-tags (9X). (E) Proteomics analysis of isolated SVs vs. control IP. The blue dot denotes proteins in which there were no detected peptides in the control IP (n = 70, 14 of which are validated SV proteins), and red dots represent established SV proteins based on literature. (F) Histogram of the distribution of particle diameters observed by EM imaging of the final immunoisolate from SV-tagged neurons (source data included in Figure 1—source data 2) (G) Percent of initial input of synaptobrevin (sbrev), VGLUT1, and SV2A proteins present in the immunoisolate from SV-tagged neurons (H) Immunoblot analysis of SVs isolated with the SV-tag based workflow compared to a previously established one based on differential centrifugation. WC: whole cell, L: whole-cell lysate, P5: SV pellet, IP: HA immunoprecipitate (I) Electron microscope image of SVs generated with the differential centrifugation method used in S1H. Values denote diameter of indicated particles. Scale bar, 100 nm (J) Luminescence-based detection of glutamate in SVs isolated from neurons treated with DMSO or Bafilomycin A (500 nM) 2 hr prior to isolation. (K) Luminescence-based detection of glutamate in SVs isolated in the absence or presence of 1 mM MgCl2.
Figure 2.
Figure 2.. Targeted metabolite profile of purified synaptic vesicles (SVs) from cultured neurons.
(A) Fold change (mean ± standard error of the mean (SEM), n = 3) of selected amino acids detected by GC/MS in purified SVs vs. control IPs. Asterisk denotes a statistically significant difference (p-value < 0.05) of the abundance of the indicated amino acid in SVs profiled from cells infected with SV-tag compared to uninfected cells. (B) Effect of pretreatment of neurons with BafilomycinA on the abundance of selected amino acids in purified SVs, as detected with GC/MS (mean ± SEM, n = 3) (C) Relative abundance via LC/MS of 153 polar metabolites present in purified SVs derived from SV-tag infected cells, compared to preps from uninfected cells (mean ± SEM, n = 3–4). Red indicates p-value < 0.05, blue indicates p- value > 0.05, and gray indicates that the metabolite was undetected in all samples. Single letter codes annotate selected amino acids. Metabolites are listed in alphabetical order, and their corresponding identities can be found in Supplementary file 2. (D) Effect of BafilomycinA on the presence of a panel of polar metabolites in purified SVs profiled with LC/MS (mean ± SEM, n = 3–4). Fold changes are color coded using the same specifications as in (C). (E) Immunoblot analysis of neurons expressing control guides (sgAAVS1) or guides targeting glutamate transporters (sgVGLUT1 and sgVGLUT2). Lysates were prepared from neurons infected with lentivirus encoding the indicated constructs. Fold changes are color coded using the same specifications as in (C). (F) LC/MS metabolite profile of SVs isolated from cells with glutamate transporter knockdown compared with control cells expressing the control guide.
Figure 2—figure supplement 1.
Figure 2—figure supplement 1.. Comparison of metabolite profiles of isolated synaptic vesicles from cultured excitatory and inbitory neuronns.
(A) Immunoblot analysis of indicated proteins in whole-cell lysates, HA immunoprecipitates from medial ganglionic eminence (MGE) cultures infected with SV-tag, and control immunoprecipitates from uninfected MGE cultures. (B) Immunoblot analysis of whole-cell lysates of primary cortical, hippocampal, and MGE neurons. Lysates were probed for the presence of indicated synaptic and pan neuronal markers. (C) Comparison of the relative abundances of specified amino acids in purified synaptic vesicles (SVs) isolated from cortical vs. MGE cultures and profiled with GC/MS (mean ± SEM, n = 3). Asterisk denotes statistical significance. Glutamate fold change p-value = 7.5e−5, GABA fold change p-value = 4.8e−3.
Figure 3.
Figure 3.. Unbiased polar metabolomics profile of purified synaptic vesicles (SVs) from cultured cortical neurons.
(A) Global polar metabolomics analysis via LC/MS of purified SVs, compared to an IP from uninfected cells. Green indicates glutamate and its associated derivatives generated during the LC/MS run. Red indicates GABA and its derivatives. Purple indicates potassium. Each dot represents the average of three replicate samples. (B) Global polar metabolomics analysis on purified SVs from Bafilomycin-treated vs. DMSO treated neurons. Legend is same as in A. (C) Summary of metabolites from global analysis which are significantly enriched in SV-tagged SVs and significantly depleted by BafilomycinA treatment.
Figure 4.
Figure 4.. Adaptation of the workflow for rapid and specific isolation and metabolite profiling of synaptic vesicles (SVs) directly from mouse brain tissue.
(A) Schematic of the workflow used to isolate SVs from mouse brain tissue. (B) Immunofluorescence images of coronal sections from wild-type mouse brains transduced with SV-tag in the indicated brain regions. Neurons are labeled with DAPI nuclear stain (blue) and SV-tag (red). Scale bar: 1 mm. (C) Immunoblot analysis of indicated protein markers present in brain lysates, control immunoprecipitates from uninfected brains, and HA immunoprecipitates from hippocampi and striatum that were infected with SV-tag. (D) LC/MS profile of SVs isolated from wild-type mice brains infected with SV-tag in hippocampus compared to a control IP from uninfected brains. (mean ± SEM, n = 4). Color code and legend is the same as in Figure 2C. (E) LC/MS profile of SVs isolated from wild-type mice brains infected with SV-tag in striatum compared to uninfected brains. (mean ± SEM, n = 4) (F) Construct design for expression of SV-tag in neurons in a Cre-dependent manner. (G) LC/MS profile of SVs isolated from Slc32a1IRES-Cre/wt (VGATIRES-Cre) mice brains infected with SV-tag in striatum compared to uninfected brains. (mean ± SEM, n = 4) (H) Coronal sections from a Slc6a3IRES-Cre/wt mouse transduced with Cre-dependent SV-tag in dopaminergic neurons of the midbrain. Dopamine neurons are immunolabelled for tyrosine hydroxylase (TH, magenta), DAPI nuclear stain (blue) and SV-tag (red). (I) Targeted LC/MS profiling of dopamine in SVs isolated from Slc6a3IRES-Cre/wt mice transduced with Cre-dependent SV-tag in dopaminergic neurons of the midbrain. Indicated mice were subjected to saline injection or tetrabenazine injection intraperitoneally 2 hr prior to harvesting of SVs.
Figure 4—figure supplement 1.
Figure 4—figure supplement 1.. Characterization of synaptic vesicles isolated directly from mouse brain tissue.
(A) Immunofluorescence images of transverse sections containing hippocampal CA3 transduced with SV-tag. A cut was made between CA2 and CA1 (dashed white line) to prevent recurrent excitation of these synapses. (B) Representative traces of evoked current responses in hippocampus from electrical stimulation. Vertical blue bars indicate stimulation that occurred with an interstimulus interval of 50 ms of Schaffer collaterals with (red) and without (black) expression of SV-tag. Vertical bar indicates 100 pA. Non-significant p-value = n.s. (C) Summary of paired-pulse ratios of electrically evoked synaptic responses from CA3 to CA1 synapses that were uninfected or expressing SV-tag. (D) Immmunoblot analysis of indicated proteins for synaptic vesicles (SVs) isolated from the whole-cell lysis method of brains compared to vesicles isolated with the synaptosome method. (E) Immunoblot analysis of SVs isolated from mouse brains transduced with SV-tag in the cortex. (F) Electron microscope image of SVs generated with the workflow. Values denote diameter of indicated particles. Scale bar: 100 nm (G) Coronal sections from Slc32a1IRES-Cre/wt (VGAT IRES-Cre/wt) and Adora2aCre/wt mice transduced with a Cre-dependent SV-tag in the striatum. (H) LC/MS profile of SVs isolated from Adora2aCre/wt mice brains infected with SV-tag in striatum compared with uninfected brains. (mean ± SEM, n = 4) (I) Representative traces of amperometry demonstrating the effects of DMSO (black) and tetrabenazine (black) on evoked dopamine. Blue indicates electrical stimulation. (J) Amperometry for dopamine in coronal slices prepared from mice administered intraperitoneally with tetrabenazine (30 mg/kg) or vehicle control 2 hr before slicing.

Similar articles

Cited by

References

    1. Abu-Remaileh M, Wyant GA, Kim C, Laqtom NN, Abbasi M, Chan SH, Freinkman E, Sabatini DM. Lysosomal metabolomics reveals V-ATPase- and mTOR-dependent mechanisms for the efflux of amino acids from lysosomes. Science. 2017;358:807–813. doi: 10.1126/science.aan6298. - DOI - PMC - PubMed
    1. Ahmed S, Holt M, Riedel D, Jahn R. Small-scale isolation of synaptic vesicles from mammalian brain. Nature Protocols. 2013;8:998–1009. doi: 10.1038/nprot.2013.053. - DOI - PubMed
    1. Atasoy D, Aponte Y, Su HH, Sternson SM. A FLEX switch targets Channelrhodopsin-2 to multiple cell types for imaging and long-range circuit mapping. Journal of Neuroscience. 2008;28:7025–7030. doi: 10.1523/JNEUROSCI.1954-08.2008. - DOI - PMC - PubMed
    1. Beale DJ, Pinu FR, Kouremenos KA, Poojary MM, Narayana VK, Boughton BA, Kanojia K, Dayalan S, Jones OAH, Dias DA. Review of recent developments in GC-MS approaches to metabolomics-based research. Metabolomics. 2018;14:152. doi: 10.1007/s11306-018-1449-2. - DOI - PubMed
    1. Beaudoin GM, Lee SH, Singh D, Yuan Y, Ng YG, Reichardt LF, Arikkath J. Culturing pyramidal neurons from the early postnatal mouse Hippocampus and cortex. Nature Protocols. 2012;7:1741–1754. doi: 10.1038/nprot.2012.099. - DOI - PubMed

Publication types