

Effectiveness of Containment Measures Against COVID-19 in Singapore: Implications for Other National Containment Efforts
- PMID: 33044319
- PMCID: PMC7707159
- DOI: 10.1097/EDE.0000000000001257
Effectiveness of Containment Measures Against COVID-19 in Singapore: Implications for Other National Containment Efforts
Abstract
Background: We hypothesize that comprehensive surveillance of COVID-19 in Singapore has facilitated early case detection and prompt contact tracing and, with community-based measures, contained spread. We assessed the effectiveness of containment measures by estimating transmissibility (effective reproduction number, (Equation is included in full-text article.)) over the course of the outbreak.
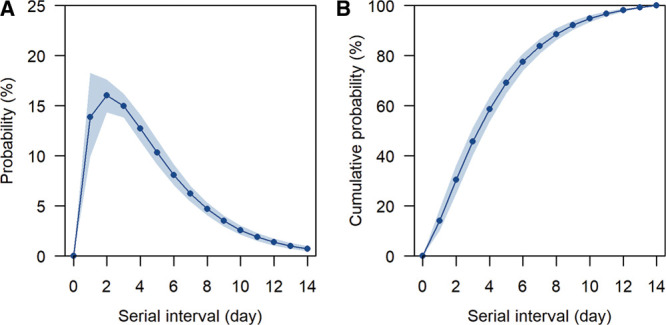
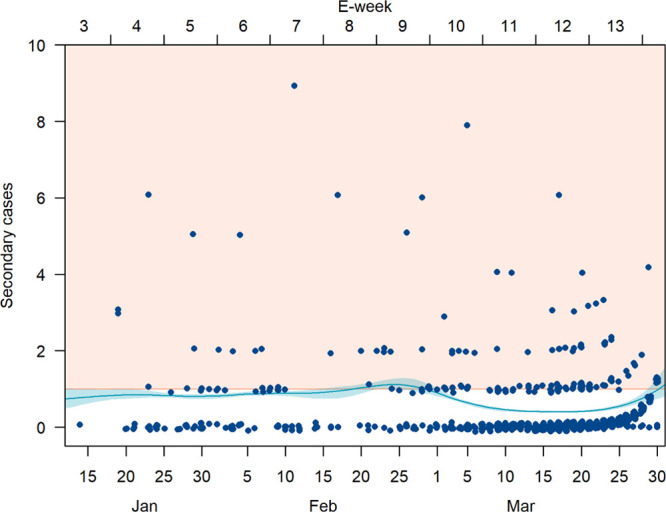
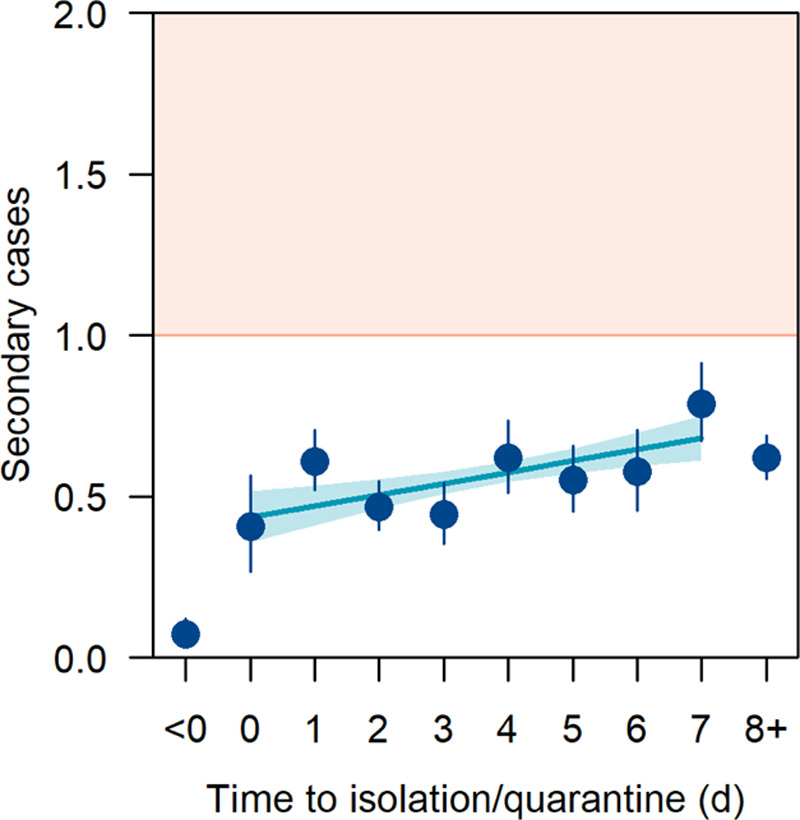
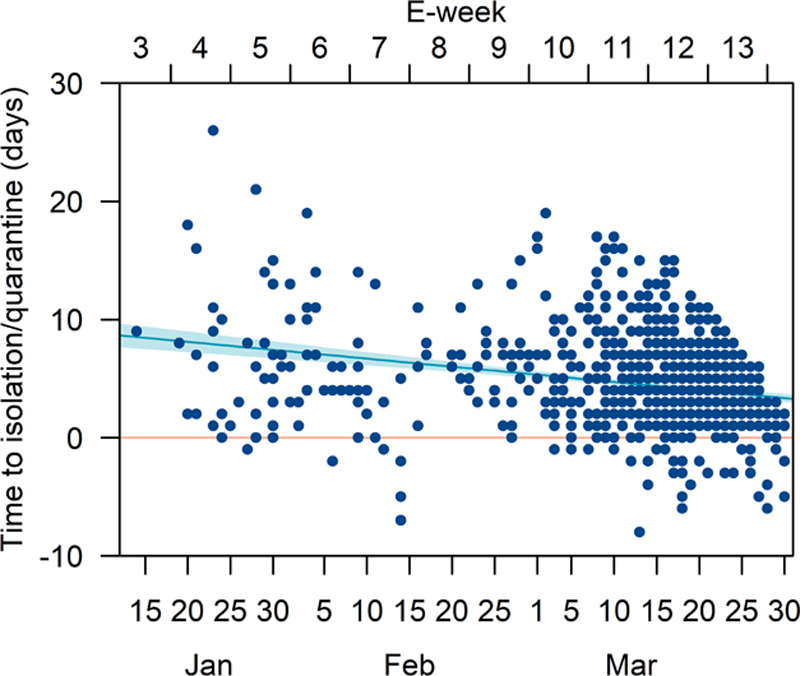
Methods: We used a Bayesian data augmentation framework to allocate infectors to infectees with no known infectors and determine serial interval distribution parameters via Markov chain Monte Carlo sampling. We fitted a smoothing spline to the number of secondary cases generated by each infector by respective onset dates to estimate (Equation is included in full-text article.)and evaluated increase in mean number of secondary cases per individual for each day's delay in starting isolation or quarantine.
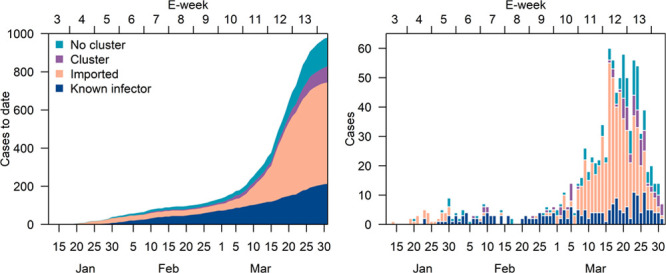
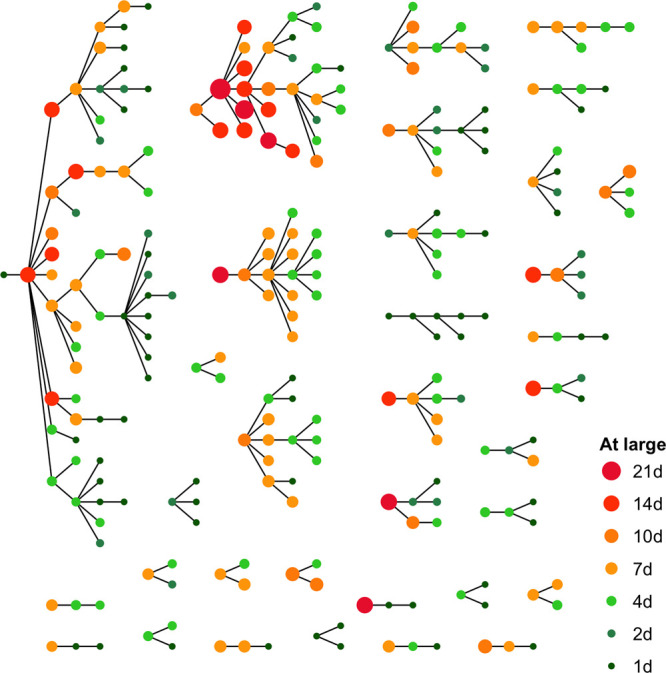
Results: As of April 1, 2020, 1000 COVID-19 cases were reported in Singapore. We estimated a mean serial interval of 4.6 days [95% credible interval (CI) = 4.2, 5.1] with a SD of 3.5 days (95% CI = 3.1, 4.0). The posterior mean (Equation is included in full-text article.)was below one for most of the time, peaking at 1.1 (95% CI = 1.0, 1.3) on week 9 of 2020 due to a spreading event in one of the clusters. Eight hundred twenty-seven (82.7%) of cases infected less than one person on average. Over an interval of 7 days, the incremental mean number of cases generated per individual for each day's delay in starting isolation or quarantine was 0.03 cases (95% CI = 0.02, 0.05).
Conclusions: We estimate that robust surveillance, active case detection, prompt contact tracing, and quarantine of close contacts kept (Equation is included in full-text article.)below one.
Conflict of interest statement
The authors report no conflicts of interest.
Figures
Similar articles
-
Sustainable border control policy in the COVID-19 pandemic: A math modeling study.Travel Med Infect Dis. 2021 May-Jun;41:102044. doi: 10.1016/j.tmaid.2021.102044. Epub 2021 Apr 7. Travel Med Infect Dis. 2021. PMID: 33838318 Free PMC article.
-
Comparison of Estimated Effectiveness of Case-Based and Population-Based Interventions on COVID-19 Containment in Taiwan.JAMA Intern Med. 2021 Jul 1;181(7):913-921. doi: 10.1001/jamainternmed.2021.1644. JAMA Intern Med. 2021. PMID: 33821922 Free PMC article.
-
Assessing the effectiveness of travel control measures in preventing imported COVID-19 cases reveals the critical role of travel volume.Epidemics. 2025 Jun;51:100837. doi: 10.1016/j.epidem.2025.100837. Epub 2025 May 15. Epidemics. 2025. PMID: 40398087
-
International travel-related control measures to contain the COVID-19 pandemic: a rapid review.Cochrane Database Syst Rev. 2021 Mar 25;3(3):CD013717. doi: 10.1002/14651858.CD013717.pub2. Cochrane Database Syst Rev. 2021. PMID: 33763851 Free PMC article.
-
Travel-related control measures to contain the COVID-19 pandemic: a rapid review.Cochrane Database Syst Rev. 2020 Oct 5;10:CD013717. doi: 10.1002/14651858.CD013717. Cochrane Database Syst Rev. 2020. Update in: Cochrane Database Syst Rev. 2021 Mar 25;3:CD013717. doi: 10.1002/14651858.CD013717.pub2. PMID: 33502002 Updated.
Cited by
-
Relative role of border restrictions, case finding and contact tracing in controlling SARS-CoV-2 in the presence of undetected transmission: a mathematical modelling study.BMC Med. 2023 Mar 16;21(1):97. doi: 10.1186/s12916-023-02802-0. BMC Med. 2023. PMID: 36927576 Free PMC article.
-
Association of SARS-CoV-2 clades with clinical, inflammatory and virologic outcomes: An observational study.EBioMedicine. 2021 Apr;66:103319. doi: 10.1016/j.ebiom.2021.103319. Epub 2021 Apr 8. EBioMedicine. 2021. PMID: 33840632 Free PMC article.
-
Clinical and Virological Features of Severe Acute Respiratory Syndrome Coronavirus 2 (SARS-CoV-2) Variants of Concern: A Retrospective Cohort Study Comparing B.1.1.7 (Alpha), B.1.351 (Beta), and B.1.617.2 (Delta).Clin Infect Dis. 2022 Aug 24;75(1):e1128-e1136. doi: 10.1093/cid/ciab721. Clin Infect Dis. 2022. PMID: 34423834 Free PMC article.
-
One Year on: An Overview of Singapore's Response to COVID-19-What We Did, How We Fared, How We Can Move Forward.Int J Environ Res Public Health. 2021 Aug 30;18(17):9125. doi: 10.3390/ijerph18179125. Int J Environ Res Public Health. 2021. PMID: 34501718 Free PMC article. Review.
-
Secondary transmission of SARS-CoV-2 during the first two waves in Japan: Demographic characteristics and overdispersion.Int J Infect Dis. 2022 Mar;116:365-373. doi: 10.1016/j.ijid.2022.01.036. Epub 2022 Jan 20. Int J Infect Dis. 2022. PMID: 35066162 Free PMC article.
References
-
- World Health Organization. Statement on the second meeting of the International Health Regulations (2005) Emergency Committee regarding the outbreak of novel coronavirus (2019-nCoV). Available at: https://www.who.int/news-room/detail/30-01-2020-statement-on-the-second-...). Accessed 27 February 2020.
-
- World Health Organisation. WHO Director-General’s opening remarks at the media briefing on COVID-19 – 11 March 2020. 2020Available at: https://www.who.int/dg/speeches/detail/who-director-general-s-opening-re.... Accessed 20 March 2020.
MeSH terms
LinkOut - more resources
Full Text Sources
Medical
Research Materials
Miscellaneous
