. 2020 Dec 7;219(12):e202004202.
doi: 10.1083/jcb.202004202.

The mitotic protein NuMA plays a spindle-independent role in nuclear formation and mechanics

Affiliations

The mitotic protein NuMA plays a spindle-independent role in nuclear formation and mechanics

Andrea Serra-Marques et al. J Cell Biol. .

Abstract

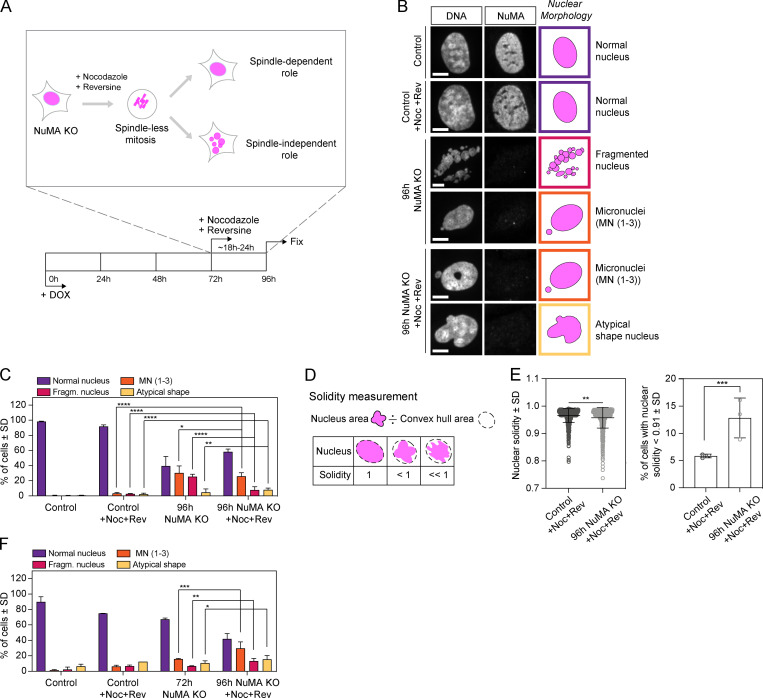
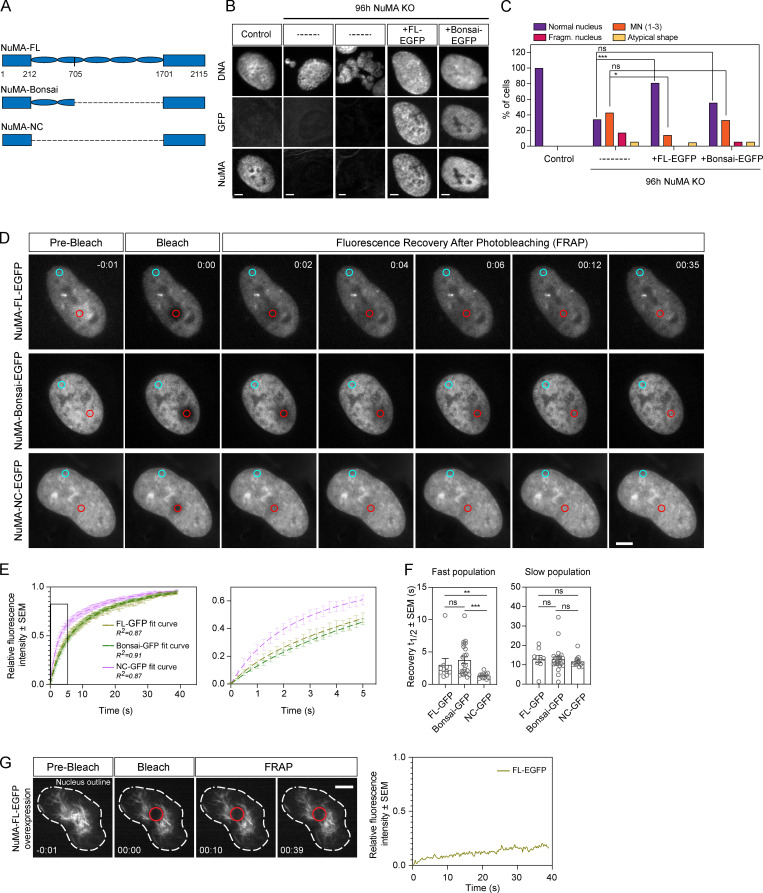
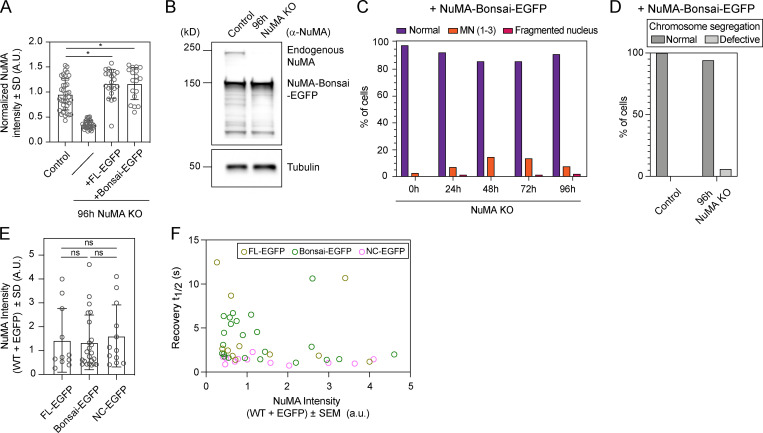
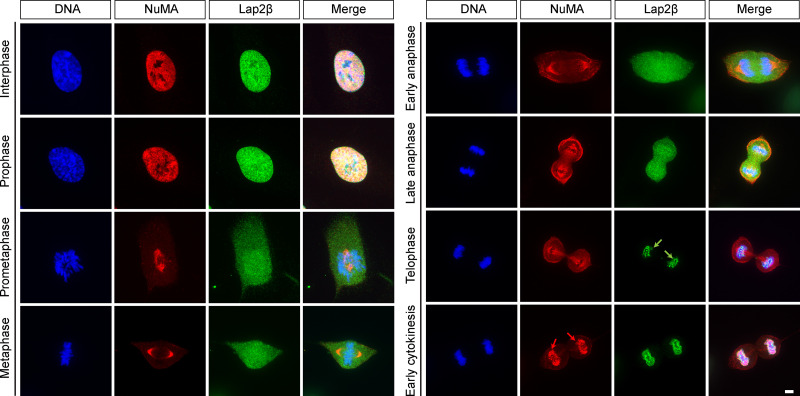
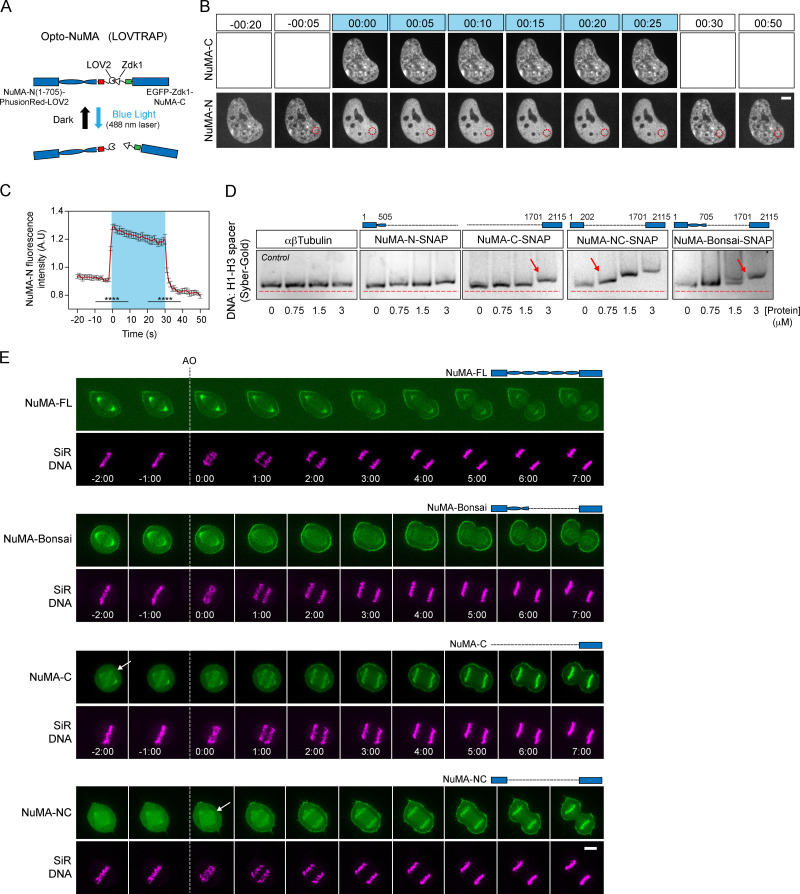
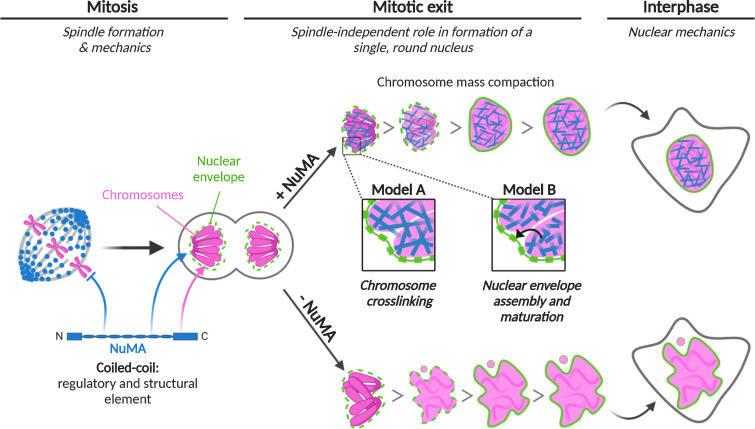
Eukaryotic cells typically form a single, round nucleus after mitosis, and failures to do so can compromise genomic integrity. How mammalian cells form such a nucleus remains incompletely understood. NuMA is a spindle protein whose disruption results in nuclear fragmentation. What role NuMA plays in nuclear integrity, and whether its perceived role stems from its spindle function, are unclear. Here, we use live imaging to demonstrate that NuMA plays a spindle-independent role in forming a single, round nucleus. NuMA keeps the decondensing chromosome mass compact at mitotic exit and promotes a mechanically robust nucleus. NuMA's C terminus binds DNA in vitro and chromosomes in interphase, while its coiled-coil acts as a central regulatory and structural element: it prevents NuMA from binding chromosomes at mitosis, regulates its nuclear mobility, and is essential for nuclear formation. Thus, NuMA plays a structural role over the cell cycle, building and maintaining the spindle and nucleus, two of the cell's largest structures.


Figures

Figure S1.
Figure S1.
Validation of the RPE1 inducible Cas9 NuMA KO cell line and of the nocodazole/reversine treatment. (A) Western blot (top) and immunofluorescence measurement (bottom) of endogenous NuMA levels in RPE1 cells after DOX-induced NuMA depletion for the indicated times. n = 147 (0 h), 190 (24 h), 141 (48 h), 107 (72 h), and 64 (96 h) cells. (B) Representative immunofluorescence images showing spindle morphology (tubulin), NuMA, and chromosomes (Hoechst) in the indicated conditions. Cells were untreated or treated with nocodazole (664 nM) and reversine (320 nM) for 18-24 h. Scale bar, 5 µm. Control cells assemble a spindle, NuMA KO cells assemble a perturbed spindle, and nocodazole- and reversine-treated cells do not assemble a spindle. (C) Nuclear morphology in immunofluorescence images of DOX-induced Cas9 RPE1 cells not expressing sgRNAs. n = 209 (no DOX control) and 328 (DOX) cells. (D) Representative immunofluorescence images of nuclear shapes in control and NuMA KO cells after DOX-induced NuMA depletion for the indicated times. The green line outlines the nucleus. Scale bar, 10 µm. (E) Nuclear solidity of interphase cells with respect to endogenous NuMA levels after DOX-induced NuMA depletion for 0–96 h. Whiskers represent minimum to maximum. n = 61 (1.2–1.8), 183 (0.8–1.2), 191 (0.4–0.8), and 214 (0.0–0.4) cells. Two-sided Mann–Whitney test: ***, P = 0.0009; *, P = 0.01; ns, nonsignificant. MN, micronuclei; Noc, nocodazole; and Rev, reversine.
Figure 1.
Figure 1.
NuMA plays a spindle-independent role in the formation of a single, round nucleus. (A) Experimental design for inducible CRISPR/Cas9 NuMA KO RPE1 cells to undergo and exit a spindle-less mitosis. Endogenous NuMA is depleted by DOX addition starting at 0 h, and cells treated with nocodazole (664 nM) and reversine (320 nM) for a spindle-less mitosis starting at 72 h, and subsequently fixed and stained for immunofluorescence at 96 h. (B) Representative immunofluorescence images of nuclear morphologies observed in uninduced NuMA KO RPE1 (control) cells, control cells treated with nocodazole and reversine (for 24 h), 96 h NuMA KO cells, and 96 h NuMA KO cells treated with nocodazole and reversine (for last 24 h). Cells were stained for tubulin (not shown), DNA (Hoechst), and NuMA. Scale bar, 10 µm. (C) Percentage of cells with different nuclear morphologies in the indicated conditions, from DNA images in B. Plot shows mean ± SD n = 1,385 (control), 1,123 (control +Noc+Rev), 638 (96 h NuMA KO), and 649 (96 h NuMA KO +Noc+Rev) cells, from three independent experiments. Two-sided Fisher’s exact test: ****, P < 0.0001; **, P = 0.003; *, P = 0.01. The same nuclear morphologies are compared within different conditions. (D) The solidity of nuclei corresponds to the ratio of the nucleus’ area to its convex hull area. (E) Nuclear solidity in nocodazole- and reversine-treated control and 96 h NuMA KO cells, and corresponding percentage of cells with nuclear solidity 2 SDs below the control mean. Plot shows mean ± SD n = 750 (control) and 656 (96 h NuMA KO) cells, from three independent experiments. Left plot, two-sided Mann–Whitney test: **, P = 0.001. Right plot, two-sided Fisher’s exact test: ***, P = 0.0001. (F) Percentage of cells with different nuclear morphologies in the indicated conditions, from DNA images. Plot shows mean ± SD n = 285 (control), 456 (control +Noc+Rev), 321 (72 h NuMA KO), and 347 (96h NuMA KO +Noc+Rev) cells, from two independent experiments. Two-sided Fisher’s exact test: ***, P = 0.0001; **, P = 0.009; *, P = 0.03. The same nuclear morphologies are compared within different conditions. Fragm., fragmented; MN, micronuclei; Noc, nocodazole; and Rev, reversine.
Figure 2.
Figure 2.
NuMA acts at the time of nuclear formation, compacting the chromosome mass at mitotic exit. (A) Representative live images of observed nuclear phenotypes after 16-18 h of nocodazole and reversine treatment (spindle-less mitosis) in 96 h NuMA KO RPE1 cells stably expressing mCherry-H2B and EGFP-Lap2β. Arrow indicates a micronucleus. Scale bar, 5 µm. (B) Percentage of cells with different nuclear morphologies before and 16-18 h after nocodazole and reversine treatment (spindle-less mitosis). All cells, and not only those that went through mitosis, were analyzed. Plot shows mean ± SD n = 476 (control) and 820 (NuMA KO) cells from five and two independent experiments, respectively. Two-sided Fisher’s exact tests: ****, P < 0.0001; *, P < 0.04. (C) Experimental design as in Fig. 1 A, except that individual cell trajectories were followed by live imaging for the 16-18 h period in nocodazole (664 nM) and reversine (control 1 µM; NuMA KO 320 nM). Mother cell, cell before mitotic entry; daughter cell, cell after mitotic exit. (D) Representative time-lapse images of control and NuMA KO RPE1 cells stably expressing mCherry-H2B (magenta) and EGFP-Lap2β (green) that were followed live through spindle-less mitosis for 16-18 h, noting nuclear envelope breakdown (NEB) and nuclear envelope reformation (NER). White arrows indicate nuclear defects. Time in hours:minutes. Scale bar, 10 µm. See also Video 1 (control) and Video 2 (NuMA KO). (E) Percentage of cells with the indicated nuclear phenotypes in uninduced control and NuMA-KO cells treated with nocodazole and reversine just before mitotic entry (mother cells) into a spindle-less mitosis and just after mitotic exit (daughter cells). Mother cells include only cells that entered mitosis with a single, round nucleus. Plot shows mean ± SD n = 508 (control) and 308 (NuMA KO) cells from five and two independent experiments, respectively. Two-sided unpaired t test: ***, P < 0.001; *, P = 0.01. (F) Expansion of the chromosome mass from the time of nuclear envelope reformation (t = 0) in control and NuMA KO cells treated with nocodazole and reversine for a spindle-less mitosis. Plot shows mean ± SEM n = 5 cells in each condition. Two-sided Mann–Whitney test: **, P = 0.008 at 132 min. Fragm., fragmented; MN, micronuclei; Noc, nocodazole; and Rev, reversine.
Figure 3.
Figure 3.
NuMA’s coiled-coil is required for the formation of a single nucleus and modulates its mobility in the nucleus. (A) Schematic representations of FL NuMA and truncations NuMA-Bonsai and NuMA-NC, with amino acid numbers indicated. (B) Representative immunofluorescence images of nuclear morphologies observed in uninduced NuMA KO RPE1 cells (control), NuMA KO cells without exogenous constructs (–, two examples), and NuMA KO cells transiently expressing the rescue constructs NuMA-FL-EGFP or NuMA-Bonsai-EGFP. Cells were stained for tubulin (not shown), DNA (Hoechst), GFP, and NuMA. Scale bar, 5 µm. (C) Percentage of cells with different nuclear morphologies observed in experiment from B. n = 38 (control), 35 (NuMA KO), 21 (NuMA KO + NuMA-FL-EGFP), and 18 (NuMA KO + NuMA-Bonsai-EGFP) cells. These rescues were repeated one more time, with similar results (not shown). Two-sided Fisher’s exact test: ***, P < 0.0006; *, P = 0.04; ns, nonsignificant. (D and E) FRAP of NuMA-FL-EGFP, NuMA-Bonsai-EGFP, and NuMA-NC-EGFP in the nucleus of uninduced NuMA KO RPE1 cells. GFP intensity was measured in the bleached area (red circle) and in a nonbleached area (blue circle) to account for photobleaching. Scale bar, 10 µm. Time in minutes:seconds; 0:00 indicates the time of bleaching. n = 11 (NuMA-FL-EGFP), 23 (NuMA-Bonsai-EGFP), and 12 (NuMA-NC-EGFP) cells. (F) Distribution of the fast and slow recovery halftimes (t1/2) of the different GFP-tagged NuMA proteins during FRAP. Plot shows mean ± SEM n = 11 (NuMA-FL-EGFP), 23 (NuMA-Bonsai-EGFP), and 12 (NuMA-NC-EGFP) cells. Two-sided Mann–Whitney test: ***, P < 0.001; **, P = 0.001; ns, nonsignificant. (G) Time-lapse images showing the nucleus (dashed white line) of an uninduced NuMA KO RPE1 cell highly overexpressing NuMA-FL-EGFP and forming cable-like structures (left) and FRAP of the same cell (right). NuMA was bleached in the indicated red circle at 0:00, and only minimal GFP intensity recovered by 39 s. Time in minutes:seconds. Scale bar, 5 µm. See also Video 3. Fragm., fragmented; and MN, micronuclei.
Figure S2.
Figure S2.
Validation of the RPE1 NuMA KO line stably expressing NuMA-Bonsai-EGFP and estimate of NuMA-EGFP intensity in cells used in the FRAP analysis. (A) Normalized NuMA intensity in uninduced NuMA KO RPE1 cells (control), NuMA KO cells, and NuMA KO cells overexpressing the rescue constructs NuMA-FL-EGFP and NuMA-Bonsai-EGFP. An antibody against the N terminus was used in order to detect both endogenous and overexpressed protein. Plot shows mean ± SD n = 38 (control), 35 (NuMA KO), 21 (NuMA KO + NuMA-FL-EGFP), and 18 (NuMA KO + NuMA-Bonsai-EGFP) cells. Two-sided unpaired t test: *, P < 0.02. (B) Western blot of endogenous NuMA and NuMA-Bonsai-EGFP in uninduced NuMA KO RPE1 cells (control) and 96 h NuMA KO cells stably overexpressing NuMA-Bonsai-EGFP. (C) Percentage of cells with different nuclear phenotypes at 0 h, 24 h, 48 h, 72 h, and 96 h of endogenous NuMA KO in cells stably overexpressing NuMA-Bonsai-EGFP and fixed for immunofluorescence as in Fig. 1 B. n = 205 (0 h), 177 (24 h), 181 (48 h), 181 (72 h), and 177 (96 h) cells. (D) Chromosome segregation defects in live control and NuMA KO cells stably overexpressing Bonsai-NuMA-EGFP. Normal segregation indicates anaphase progression without lagging chromosomes or anaphase bridges. n = 8 (control) and 17 (NuMA KO) cells. 1 out of 17 NuMA KO cells exited mitosis with a defective nucleus, and without completing anaphase, and was scored as segregation defective. (E) NuMA-FL-EGFP, NuMA-Bonsai-EGFP, and NuMA-NC-EGFP fluorescence intensity in the cells analyzed in the FRAP experiment presented in Fig. 3, D and E. Plot shows mean ± SD n = 11 (NuMA-FL-EGFP), 23 (NuMA-Bonsai-EGFP), and 12 (NuMA-NC-EGFP). Two-sided Mann–Whitney test: ns, nonsignificant. (F) Fast recovery halftime as a function of NuMA-FL-EGFP, NuMA-Bonsai-EGFP, and NuMA-NC-EGFP intensity in the cells from Fig. 3, D and E. n = 11 (NuMA-FL-EGFP), 23 (NuMA-Bonsai-EGFP), and 12 (NuMA-NC-EGFP). MN, micronuclei; and WT, wild-type.
Figure S3.
Figure S3.
NuMA is only detectable on chromosomes after initial Lap2β recruitment. Representative immunofluorescence images of uninduced RPE1 NuMA KO cells showing localization of the nuclear envelope protein Lap2β (green), NuMA (red), and DNA (Hoechst, blue) over the cell cycle. Lap2β is detectable around the chromosome mass (green arrows) before NuMA appears on chromosomes (red arrows). Scale bar, 5 µm.
Figure 4.
Figure 4.
NuMA’s coiled-coil regulates its C terminus’ chromatin binding over the cell cycle. (A) LOVTRAP light-induced dissociation system: in the dark, LOV2 (phototropin) binds to Zdk1, while blue light induces a conformational change in LOV2 that prevents binding to Zdk1. In the Opto-NuMA engineered protein NuMA-N(1–705)-PhusionRed-LOV2 + EGFP-Zdk1-NuMA-C, both NuMA ends are linked through LOVTRAP, and blue light dissociates them from each other. (B) Representative time-lapse of an uninduced NuMA KO RPE1 cell stably expressing Opto-NuMA in the nucleus before, during (0:00-0:25), and after illumination with blue (488 nm) light, showing NuMA-N but not NuMA-C becoming diffuse upon dissociation. EGFP-Zdk1-NuMA-C cannot be imagined without dissociating Opto-NuMA. Red circle corresponds to the area chosen for intensity analysis in C. Time in minutes:seconds. Scale bar, 5 µm. See also Video 4. (C) NuMA-N(1–705)-PhusionRed-LOV2 intensity in the nucleus before, during (blue box), and after illumination with blue light. Red trace = mean; black = SEM. n = 9 cells. Two-sided Mann–Whitney test: ****, P < 0.0001. (D) Top: The schematics represent the NuMA constructs used in each gel, with amino acid numbers indicated. Bottom: EMSA using 60 ng H1-H3 spacer DNA fragment and increasing concentrations of αβtubulin, NuMA-N-SNAP, NuMA-C-SNAP, NuMA-Bonsai-SNAP, and NuMA-NC-SNAP. DNA was labeled with Sybr-Gold. Arrows indicate the minimum protein concentration for each protein with a noticeable DNA band shift. (E) Representative time-lapse images of RPE1 cells transiently expressing NuMA-FL-EGFP and stably expressing NuMA-Bonsai-EGFP, EGFP-Zdk1-NuMA-C, or NuMA-NC-EGFP and labeled with SiR-Hoechst (DNA), followed from metaphase through cytokinesis. NuMA-C and NuMA-NC localize to chromosomes at mitosis, while NuMA-Bonsai does not. Time in minutes:seconds; 0:00 corresponds to anaphase onset (AO, vertical dashed line). Arrows indicate when we detect different NuMA truncations on chromosomes. Scale bar, 5 µm. See also Video 5.
Figure S4.
Figure S4.
NuMA-N and -C responses in Opto-NuMA in vivo experiments, and purified NuMA truncation proteins used for in vitro EMSAs. (A) Pearson’s correlation coefficient between NuMA-N and/or NuMA-C images of nuclear regions in Opto-NuMA experiments at the indicated times (related to Fig. 4 B). Blue represents illumination with blue light. Lines 1 and 2 show that NuMA-C localization during illumination correlates with NuMA-N localization both before and after illumination, consistent with NuMA-N being recruited to the same NuMA-C localization before and after illumination; line 3 shows that NuMA-C localization does not correlate with NuMA-N localization during illumination, consistent with NuMA-N unbinding from NuMA-C during illumination; line 4 shows that NuMA-N localizations before and during illumination do not correlate; line 5 shows that NuMA-N localizations before and after illumination correlate, consistent with NuMA-N being recruited to the same NuMA-C localization before and after illumination; line 6 shows that NuMA-C localizations at the start and end of illumination correlate. Together these results suggest that NuMA-C drives NuMA-N localization, and that NuMA-C has a higher affinity for chromatin than NuMA-N. The representative cell shown in Fig. 4 B was analyzed. (B) Coomassie blue–stained gels with SNAP-tagged NuMA-N, NuMA-C, NuMA-Bonsai, and NuMA-NC proteins purified from insect Sf9 cells. These purified NuMA truncation proteins were used in EMSAs (Fig. 4 D).
Figure S5.
Figure S5.
CDK1 activity does not affect NuMA binding to chromosomes during mitosis. Representative time-lapse images of uninduced NuMA KO RPE1 cells stably expressing NuMA-Bonsai-EGFP, EGFP-Zdk1-NuMA-C, or NuMA-NC-EGFP, treated with SiR-Hoechst (DNA), and treated with the CDK1 inhibitor RO-3366 ∼10 s before 0:00. Time in minutes:seconds. Cells were imaged during metaphase to monitor the localization of the different EGFP-tagged NuMA truncation proteins on chromosomes. Arrows indicate the time at which we detect the tested EGFP-tagged NuMA truncations on chromosomes upon CDK1 inhibition. Scale bars, 5 µm.
Figure 5.
Figure 5.
NuMA provides mechanical robustness to the nucleus. (A) Representative side (y-z) view images of a live control and 96 h NuMA KO RPE1 cell expressing mCherry-H2B (magenta) and EGFP-Lap2β (green), with images acquired every 0.25 µm over 8 µm. Scale bar, 5 µm. (B) Cell area of unconfined control and NuMA KO cells. Plot shows mean ± SD n = 18 cells in both conditions. Two-sided unpaired t test: **, P < 0.002. (C) Projected nuclear area of unconfined control and NuMA KO cells. Plot shows mean ± SD n = 19 (control) and 25 (NuMA KO) cells. Two-sided unpaired t test: *, P = 0.019. (D) 3D nuclear volume of unconfined control and NuMA KO cells. Plot shows mean ± SD n = 19 (control) and 25 (NuMA KO) cells. Two-sided unpaired t test: ****, P < 0.0001. (E) Schematic representation of cell confinement using a PDMS device (gray) with 3-µm-high pillars. Nuclear (pink) compression occurs when pillars are brought down to contact the coverslip (black). (F) Top (x-y) view images of a live control and 96 h NuMA KO RPE1 cells from A, shown before (unconfined) and during confinement by the PDMS device depicted in B. Scale bar, 5 µm. (G) Representative side (y-z) view images of a confined live control and NuMA KO RPE1 cell from A and C. Scale bar, 5 µm. (H and I) Nuclear height of unconfined and confined control and NuMA KO cells (E), calculated based on EGFP-Lap2β localization, and unconfined nuclear height ratio in control and NuMA KO cells (F). Plot shows mean ± SD n = 19 (control) and 25 (NuMA KO) cells. Two-sided Mann–Whitney test: ****, P < 0.0001; ***, P = 0.007; **, P < 0.008. Same dataset as in Fig. 5 B.
Figure 6.
Figure 6.
Model for NuMA’s role in nuclear formation and mechanics, and its structural role over the cell cycle. NuMA (blue) plays a spindle-independent role in nuclear formation (“Mitotic exit,” center) and mechanics (“Interphase,” right). It keeps the chromosome (pink) mass compact at nuclear formation, and is essential to building a single, round and mechanically robust nucleus (“+NuMA”, top). Without NuMA (“-NuMA”, bottom), micronucleation and nuclear shape defects occur. We propose two models for how NuMA, whose C terminus binds interphase chromosomes (pink arrow), performs its nuclear function. To promote nuclear formation and mechanics, NuMA could cross-link chromosomes (Model A, blue filaments) or regulate nuclear envelope (green) assembly and maturation (Model B, black arrow), either directly or indirectly. At “Mitosis” (left), NuMA plays a critical role in spindle formation and mechanics, and its coiled-coil prevents it from binding chromosomes (blue inhibitory arrow), when these must but segregated instead of kept together. At mitotic exit and interphase, the coiled-coil drives NuMA’s nuclear dynamics and function (blue arrow). As such, we propose that NuMA’s coiled-coil acts as a central regulatory and structural element to control its function in space and time. Altogether, NuMA is essential to the formation and stability of two of the cell’s largest structures, the spindle and the nucleus. Figure created with Biorender.com.

Similar articles

Cited by

References

    1. Abad, P.C., Lewis J., Mian I.S., Knowles D.W., Sturgis J., Badve S., Xie J., and Lelièvre S.A.. 2007. NuMA influences higher order chromatin organization in human mammary epithelium. Mol. Biol. Cell. 18:348–361. 10.1091/mbc.e06-06-0551 - DOI - PMC - PubMed
    1. Andreassi, M.G., Barale R., Iozzo P., and Picano E.. 2011. The association of micronucleus frequency with obesity, diabetes and cardiovascular disease. Mutagenesis. 26:77–83. 10.1093/mutage/geq077 - DOI - PubMed
    1. Barboro, P., D’arrigo C., Diaspro A., Mormino M., Alberti I., Parodi S., Patrone E., and Balbi C.. 2002. Unraveling the Organization of the Internal Nuclear Matrix: RNA-Dependent Anchoring of NuMA to a Lamin Scaffold. Exp. Cell Res. 279:202–218. doi:. 10.1006/excr.2002.5605 - DOI - PubMed
    1. Barboro, P., D’Arrigo C., Mormino M., Coradeghini R., Parodi S., Patrone E., and Balbi C.. 2003. An intranuclear frame for chromatin compartmentalization and higher-order folding. J. Cell. Biochem. 88:113–120. 10.1002/jcb.10378 - DOI - PubMed
    1. Buxboim, A., Ivanovska I.L., and Discher D.E.. 2010. Matrix elasticity, cytoskeletal forces and physics of the nucleus: how deeply do cells ‘feel’ outside and in? J. Cell Sci. 123:297–308. 10.1242/jcs.041186 - DOI - PMC - PubMed

Publication types