

Clinical significance and biological function of transcriptional repressor GATA binding 1 in gastric cancer: a study based on data mining, RT-qPCR, immunochemistry, and vitro experiment
- PMID: 33044891
- PMCID: PMC7714475
- DOI: 10.1080/15384101.2020.1827499
Clinical significance and biological function of transcriptional repressor GATA binding 1 in gastric cancer: a study based on data mining, RT-qPCR, immunochemistry, and vitro experiment
Abstract
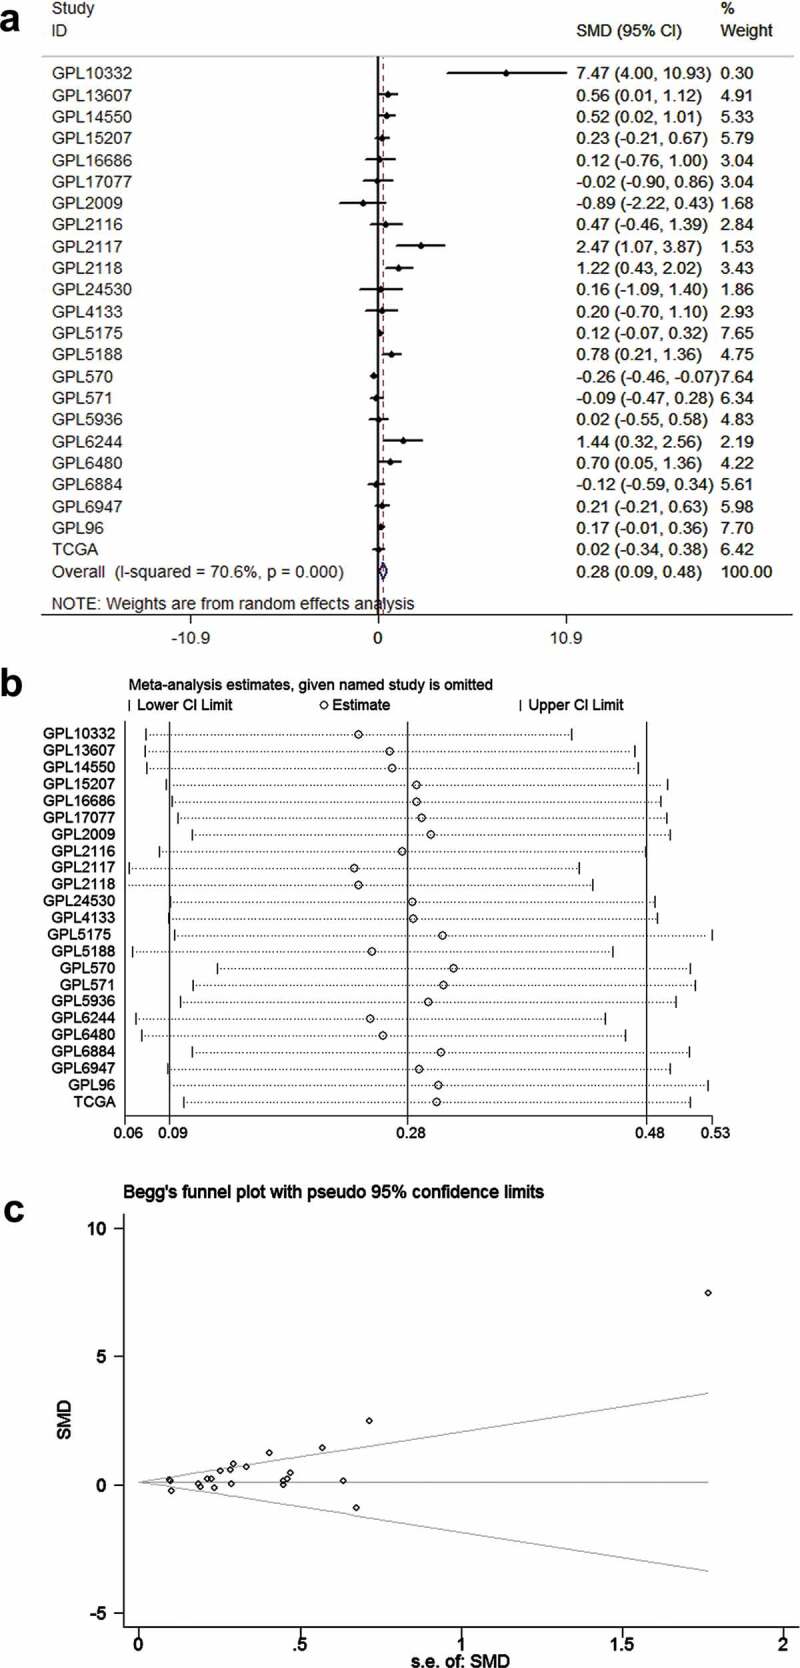
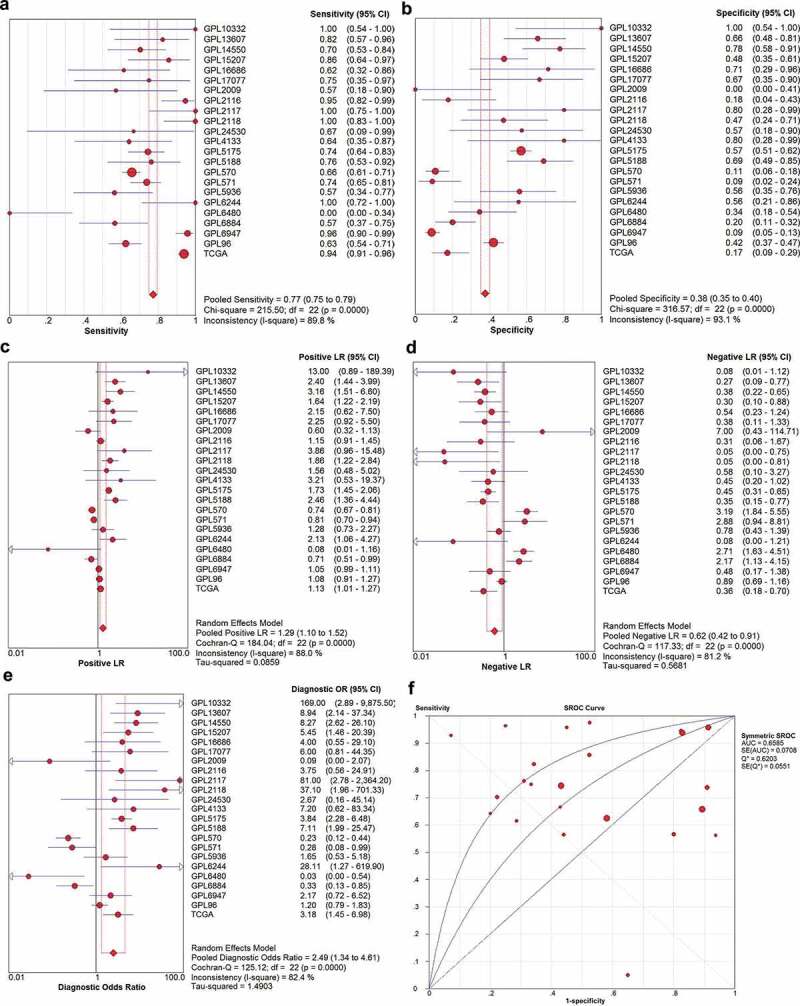
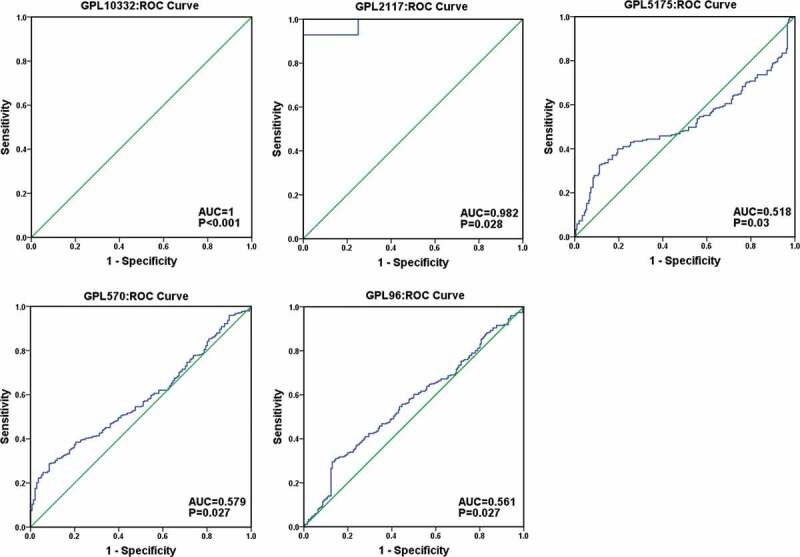
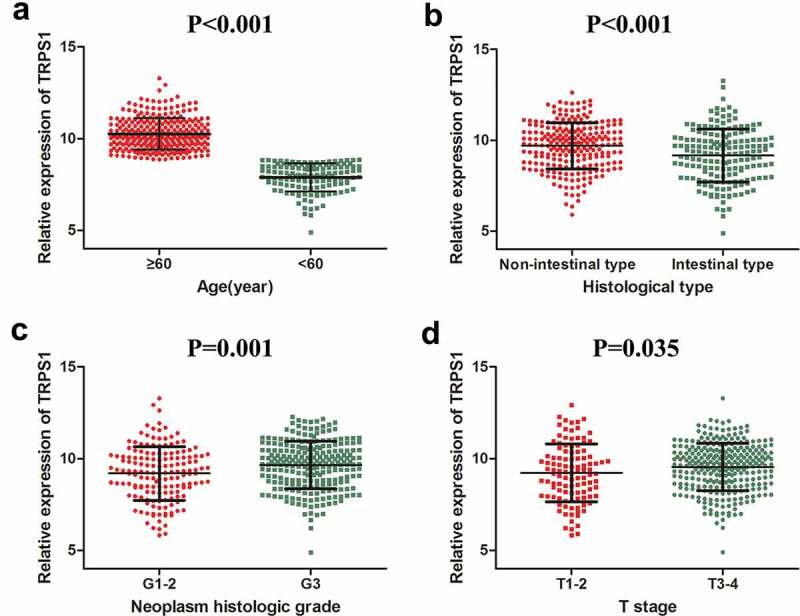
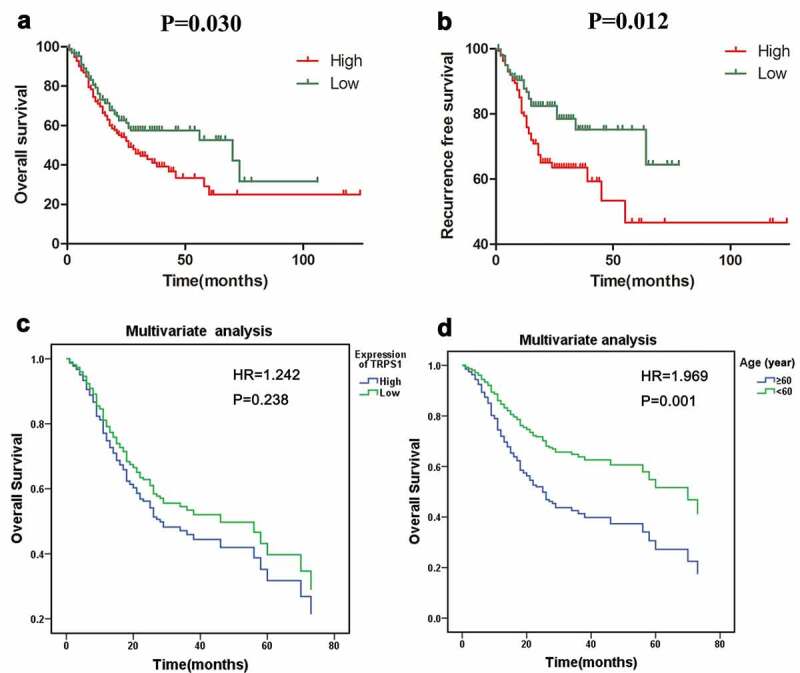
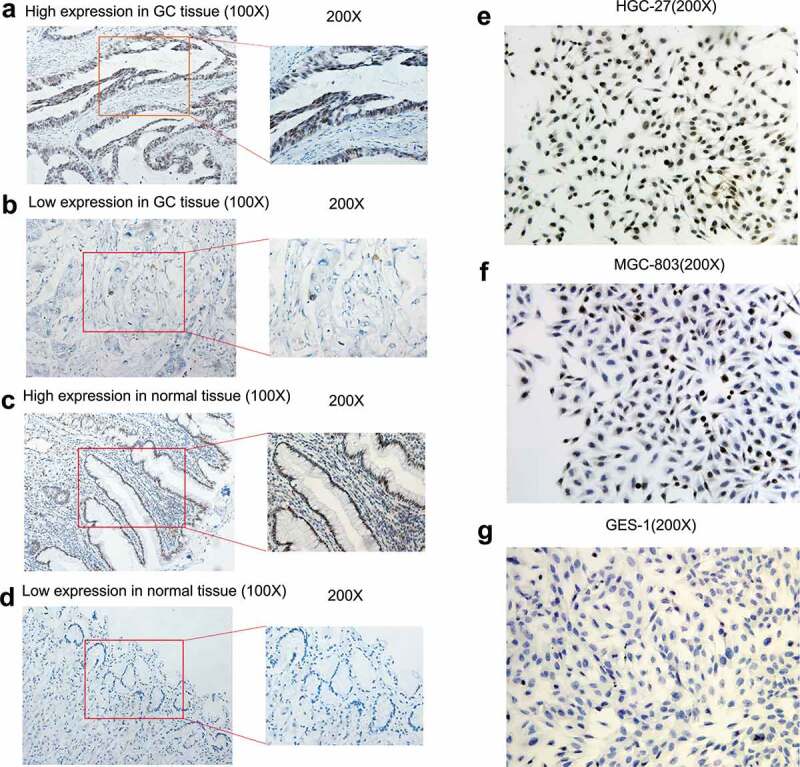
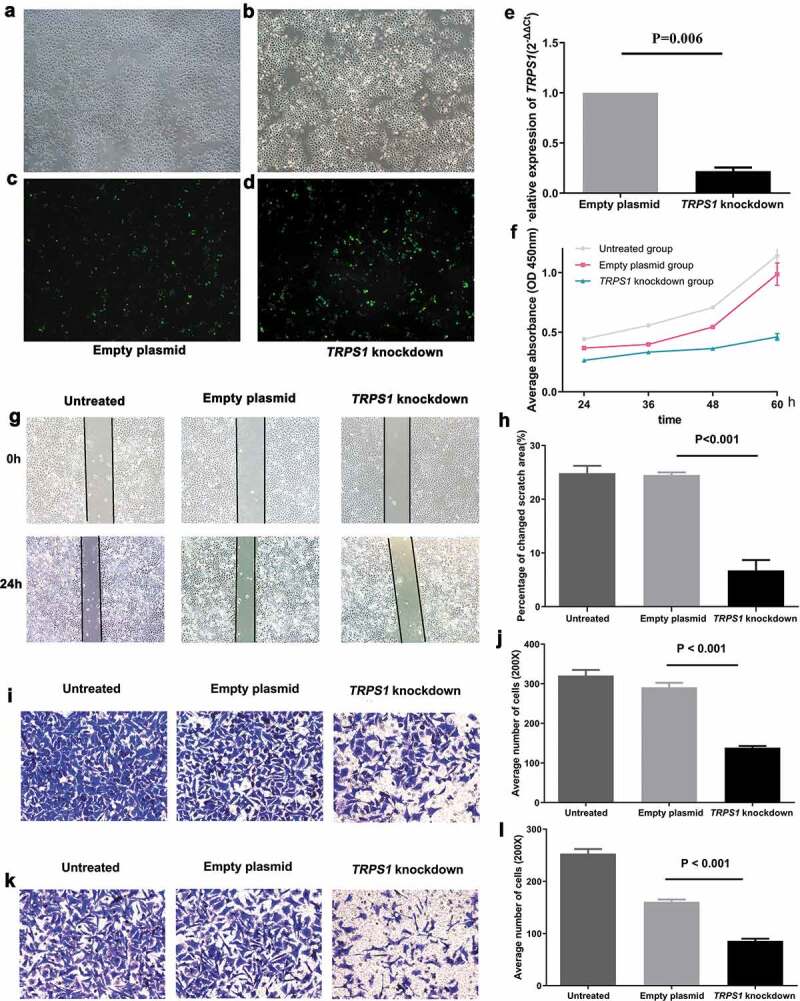
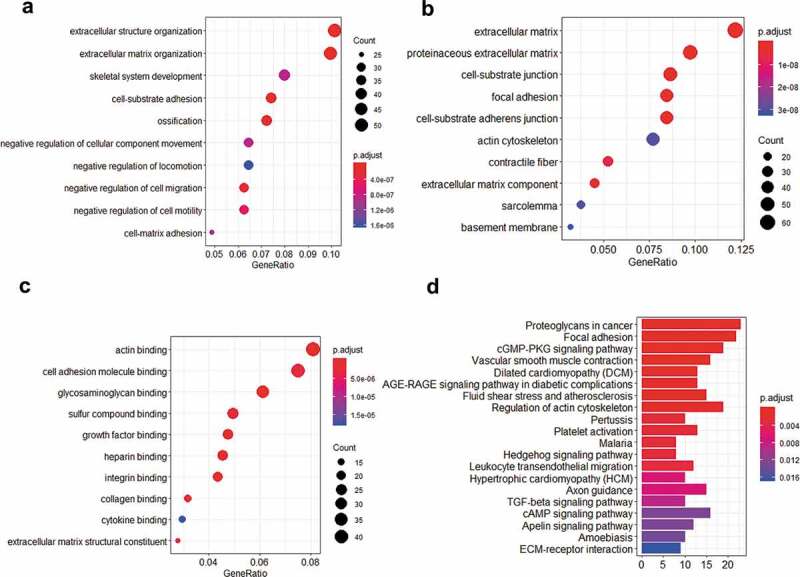
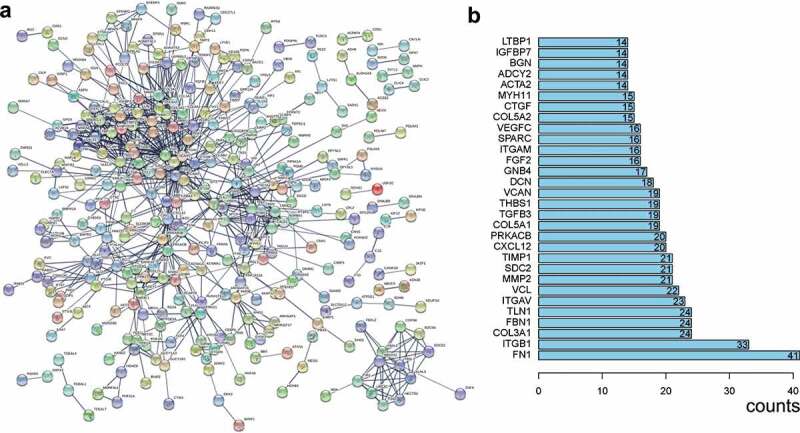
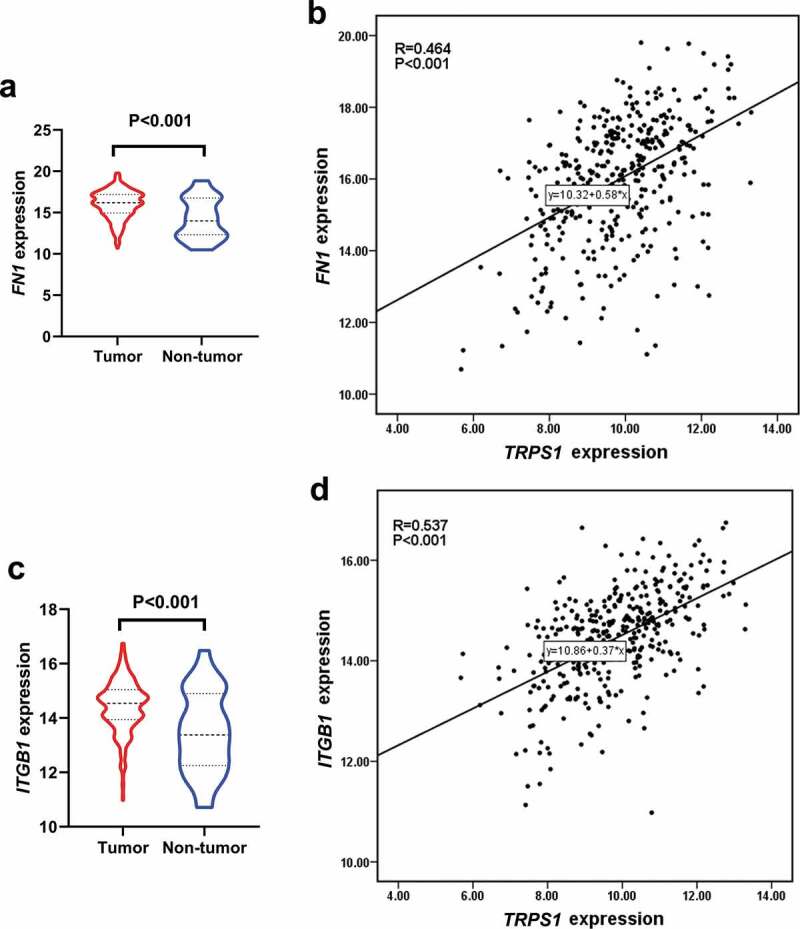
Transcriptional repressor GATA binding 1 (TRPS1) is a newly discovered transcription factor, which has been reported in many tumors, except for gastric cancer (GC). In this study, we aimed to grope for clinical significance and biological function of TRPS1 in GC. TRPS1 expression in GC and its relationship with clinicopathological features were analyzed based on public databases, and verified by immunohistochemistry and RT-qPCR. Kaplan-Meier survival curve and Cox regression model were used to estimate the influence of TRPS1 on the univariate prognosis and multivariate survival risk factors of GC. The effects of TRPS1 on malignant biological behaviors of GC cells were studied by CCK8 cell proliferation, scratch test, and Transwell assay. The function of TRPS1 was further analyzed by signaling pathway analysis. TRPS1 mRNA expression in GC tissues was up-regulated and was of great significance in some prognostic factors. Protein expression of TRPS1 in tumor tissues was significantly higher than that in paracancerous tissues. Over-expression of TRPS1 was a poor prognostic indicator for GC patients. TRPS1 knockdown could inhibit the proliferation, migration, and invasion of GC cells. The important role of TRPS1 was in the extracellular matrix, and it was involved in actin binding and proteoglycan in cancer. The hub genes of TRPS1 (FN1, ITGB1) were defined. TRPS1 may be a tumor promoter and promote the development of GC by influencing the malignant biological behaviors of GC. TRPS1 is expected to be a key diagnostic and prognostic indicator for GC patients.
Keywords: TRPS1; expression; function; gastric cancer.
Conflict of interest statement
Theauthors declare that they have no competing interests.
Figures
Similar articles
-
Upregulation of TRPS1 promotes proliferation, migration, and invasion in ovarian clear cell carcinoma and correlates with poor patient prognosis.J Ovarian Res. 2025 Apr 7;18(1):73. doi: 10.1186/s13048-025-01603-8. J Ovarian Res. 2025. PMID: 40197498 Free PMC article.
-
HOX transcript antisense intergenic RNA represses E-cadherin expression by binding to EZH2 in gastric cancer.World J Gastroenterol. 2017 Sep 7;23(33):6100-6110. doi: 10.3748/wjg.v23.i33.6100. World J Gastroenterol. 2017. PMID: 28970725 Free PMC article.
-
GATA3 and TRPS1 are distinct biomarkers and prognostic factors in breast cancer: database mining for GATA family members in malignancies.Oncotarget. 2017 May 23;8(21):34750-34761. doi: 10.18632/oncotarget.16160. Oncotarget. 2017. PMID: 28423734 Free PMC article.
-
Centromere Protein I (CENP-I) Is Upregulated in Gastric Cancer, Predicts Poor Prognosis, and Promotes Tumor Cell Proliferation and Migration.Technol Cancer Res Treat. 2021 Jan-Dec;20:15330338211045510. doi: 10.1177/15330338211045510. Technol Cancer Res Treat. 2021. PMID: 34617858 Free PMC article.
-
Analysis of the function, mechanism and clinical application prospect of TRPS1, a new marker for breast cancer.Gene. 2025 Jan 10;932:148880. doi: 10.1016/j.gene.2024.148880. Epub 2024 Aug 23. Gene. 2025. PMID: 39181273 Review.
Cited by
-
Five hypoxia and immunity related genes as potential biomarkers for the prognosis of osteosarcoma.Sci Rep. 2022 Jan 31;12(1):1617. doi: 10.1038/s41598-022-05103-3. Sci Rep. 2022. PMID: 35102149 Free PMC article.
-
TRPS1 is a Highly Sensitive Marker for Breast Cancer: A Tissue Microarray Study Evaluating More Than 19,000 Tumors From 152 Different Tumor Entities.Am J Surg Pathol. 2024 Jun 1;48(6):637-651. doi: 10.1097/PAS.0000000000002213. Epub 2024 Apr 18. Am J Surg Pathol. 2024. PMID: 38647255 Free PMC article.
-
A Comprehensive Review of TRPS1 as a Diagnostic Immunohistochemical Marker for Primary Breast Carcinoma: Latest Insights and Diagnostic Pitfalls.Cancers (Basel). 2024 Oct 23;16(21):3568. doi: 10.3390/cancers16213568. Cancers (Basel). 2024. PMID: 39518009 Free PMC article. Review.
-
Expression Landscape and Functional Roles of HOXA4 and HOXA5 in Lung Adenocarcinoma.Int J Med Sci. 2022 Mar 6;19(3):572-587. doi: 10.7150/ijms.70445. eCollection 2022. Int J Med Sci. 2022. PMID: 35370463 Free PMC article.
-
Identification of ZIC2 as a Potential Biomarker Linked with the Clinical Progression and Immune Infiltration of Oral Cancer: A Multicenter Study.Int J Genomics. 2024 Jan 24;2024:3256694. doi: 10.1155/2024/3256694. eCollection 2024. Int J Genomics. 2024. PMID: 38304730 Free PMC article.
References
-
- Bray F, Ferlay J, Soerjomataram I, et al. Global cancer statistics 2018: GLOBOCAN estimates of incidence and mortality worldwide for 36 cancers in 185 countries. CA Cancer J Clin. 2018;68(6):394–424. . - PubMed
-
- Siegel RL, Miller KD, Jemal A.. Cancer statistics, 2019. CA Cancer J Clin. 2019;69(1):7–34. - PubMed
-
- Gai Z, Gui T, Muragaki Y. The function of TRPS1 in the development and differentiation of bone, kidney, and hair follicles. Histol Histopathol. 2011;26(7):915–921. - PubMed
-
- Wilke CM, Hess J, Klymenko SV, et al. Expression of miRNA-26b-5p and its target TRPS1 is associated with radiation exposure in post-Chernobyl breast cancer. Int J Cancer. 2018;142(3):573–583. - PubMed
Publication types
MeSH terms
Substances
LinkOut - more resources
Full Text Sources
Other Literature Sources
Medical
Miscellaneous